ABSTRACT
DAMIEN C. CROTEAU‐CHONKA: Genetic contributions to obesity and related complex traits in the Cebu Longitudinal Health and Nutrition Survey
(Under the direction of Karen L. Mohlke, Ph.D.)
Obesity represents a major world health problem across socio‐economic strata. Characterizing known candidate genes and identifying novel genes contributing to obesity and other related heritable risk factors may aid our understanding of its complex etiology and provide new treatment targets. Based in the Philippines, a country experiencing a rapid obesogenic
transition, the Cebu Longitudinal Health and Nutrition Survey (CLHNS) is a useful population cohort in which to study the genetics of obesity. For more than 20 years since 1983, researchers have followed a cohort of Filipino mothers and their
offspring from the metropolitan area of Cebu, collecting a wide variety of
weight, and waist circumference), metabolic (adiponectin), and physiological (age of menarche).
I first performed a genome‐wide association (GWA) study of body size traits in Filipinos to determine the contribution of common genetic variants to those traits. I replicated three well‐known BMI loci (BDNF, MC4R, and FTO) and further observed evidence of longitudinal changes in the effects of those genes.
Next, I sought to establish the putative causal variant(s) underlying a haplotype at the ADIPOQ gene identified in a previous CLHNS GWA study to be strongly associated with lower circulating plasma adiponectin level. I identified a population‐specific missense variant (R221S) that affected the original
measurement of the phenotype and explained the observed GWA signal.
Next, to identify novel biology underlying the etiology of central adiposity, I performed a meta‐analysis of GWA studies of waist circumference (WC) in European individuals from the Genetic Investigation of Anthropometric Traits (GIANT)
Consortium. Findings from this large‐scale study may suggest other candidate loci for future genetic study in the CLHNS. I observed evidence of novel associations specific to WC and not other related anthropometric traits, such as BMI, height, and waist‐hip ratio. These signals included the genes NLRP3, which is part of the
obesity‐related inflammasome complex, and IRS1, which is previously associated with body fat percentage and an adverse metabolic profile.
Europeans replicated in Filipinos. While this association appeared not to be
ACKNOWLEDGEMENTS
Science in the 21st century is very much a team sport, and I am indebted to
the many people who helped guide, support, and distract me during my doctoral studies.
First, I would like to thank my advisor, Dr. Karen Mohlke, for being a mentor par excellence: sending tremendous opportunities my way early and often and encouraging me to take intellectual ownership of my work. In addition, Karen's ongoing enthusiasm for the scientific endeavor was uplifting even when the
scientific process was a little bit of a grind. I would also like to thank the members of my dissertation committee: Drs. Linda Adair, Ethan Lange, Yun Li, and Pat
Sullivan. Their periodic reminders to really know the biology inside and out and to stick to my guns were much appreciated. Thanks also to Dr. Leslie Lange for her statistical assistance and advice on various projects.
words of encouragement and for occasionally taking me down a peg to keep this process honest.
Grad school would not have been nearly as positive an experience if not for the many awesome friends I made in both the Genetics Curriculum and the
Bioinformatics and Computational Biology Curriculum. For fear of leaving anybody out, I will omit an exhaustive list, but they know who they are. Thanks to all of them for their devoted comradery, for our many fun adventures enjoying North Carolina, and for all the rides before I finally got myself a car!
A special thanks, too, to Professor Susan Klebanow and the many members of the UNC Chamber Singers with whom I’ve had the pleasure of making music (with Karen's blessing, of course). I always told people that Chamber Singers was the four hours a week I didn't think about science unless asked a direct question. To their credit indeed, my fellow singers would often be interested in what it was that I did every day.
Finally, I would like to acknowledge the many fine people who have been a part of the Mohlke Lab during my time at UNC. Amanda Marvelle, Kyle Gaulton, and Li Qin were there at the start, helping to sell me on the lab before eventually moving on to bigger and brighter things. I've known Marie Fogarty the longest as she
TABLE OF CONTENTS
LIST OF FIGURES... x
LIST OF TABLES... xiii
LIST OF ABBREVIATIONS... xvi
I. INTRODUCTION ...1
Measuring obesity traits and associated health risks ...3
Genetic association studies of obesity traits ...7
The Cebu Longitudinal Health and Nutrition Survey ... 10
II. GENOMEWIDE ASSOCIATION STUDY OF ANTHROPOMETRIC TRAITS AND EVIDENCE OF INTERACTIONS WITH AGE AND STUDY YEAR IN FILIPINO WOMEN... 12
Introduction... 13
Methods and Procedures ... 14
Results... 18
Discussion... 22
Acknowledgments... 26
III. POPULATIONSPECIFIC CODING VARIANT UNDERLIES
GENOMEWIDE ASSOCIATION WITH ADIPONECTIN LEVEL ... 49
Introduction... 50
Results... 52
Discussion... 59
Materials and Methods ... 63
Acknowledgements ... 69
Disclosure Statement... 69
IV. METAANALYSIS OF 231,355 EUROPEAN INDIVIDUALS IDENTIFIES SEVEN NOVEL LOCI ASSOCIATED WITH WAIST CIRCUMFERENCE... 86
Introduction... 87
Materials and Methods ... 88
Results... 91
Discussion... 98
Acknowledgments... 100
V. REPLICATION OF LIN28B SNP ASSOCIATION WITH AGE OF MENARCHE IN YOUNG FILIPINO WOMEN ...123
Introduction... 124
Subjects and Methods... 125
Results... 127
Discussion... 128
LIST OF FIGURES
Figure 2.1 Manhattan plots of SNP associations with current
measurements of four anthropometric traits ... 27 Figure 2.2 Quantile‐quantile plots of SNP associations with current
measurements of four anthropometric traits ... 29 Figure 2.3 Further localization in the CLHNS of the BMI association
signal at the BDNF locus ... 30 Figure 2.4 Evidence for a consistent longitudinal age‐by‐genotype
interaction influencing BMI at rs17782313 (MC4R)... 31 Figure 2.5 No evidence for a longitudinal age‐by‐genotype interaction
influencing BMI at rs4923461 (BDNF)... 32 Figure 2.6 Evidence for a longitudinal age‐by‐genotype interaction
influencing BMI at FTO...33 Figure 2.7 Inconclusive evidence at multiple loci for longitudinal
Figure 3.3 Two adiponectin association signals (P < 5.0 × 10‐8) on
chromosome 3 in 1,695 CLHNS offspring ... 72 Figure 3.4 Association of KNG1–ADIPOQ haplotype in CLHNS offspring
is attenuated by ADIPOQ missense variant R221S... 73 Figure 3.5 Association of KNG1–ADIPOQ haplotype in CLHNS mothers
is attenuated by ADIPOQ missense variant R221S... 74 Figure 3.6 Inconsistent plasma adiponectin measurements between
assays is attributable to R221S... 75 Figure 3.7 In CLHNS mothers, only the KNG1–ADIPOQ association
signal is substantially attenuated when taking into account
ADIPOQ missense variant R221S ... 76 Figure 3.8 Residual association signals near ADIPOQ in CLHNS mothers
after adjustment for R221S genotype... 77 Figure 4.1 Study design for the meta‐analysis of waist circumference
association data...101 Figure 4.2 Quantile‐quantile plot of sex‐combined SNP associations
with waist circumference...102 Figure 4.3 Quantile‐quantile plots of sex‐specific SNP associations
with waist circumference...103 Figure 4.4 Quantile‐quantile plot of sex‐combined associations with
Figure 4.6 Chicago plot of sex‐specific SNP associations with waist
circumference...106 Figure 4.7 Quantile‐quantile plot of sex‐based heterogeneity in SNP
associations with waist circumference ...107 Figure 4.8 Manhattan plot of sex‐based heterogeneity in SNP
associations with waist circumference ...108 Figure 5.1 Illustration of two genetic models for SNP‐menarche
LIST OF TABLES
Table 2.1 Pair‐wise Pearson correlations of anthropometric traits
in the CLHNS cohort ... 35 Table 2.2 Associations of trait covariates with outcomes in the
CLHNS cohort ... 36 Table 2.3 Demographic and descriptive statistics of the CLHNS cohort... 37 Table 2.4 SNPs with suggestive evidence of association (P < 10‐5)
with four anthropometric traits in the CLHNS... 38 Table 2.5 CLHNS association for SNPs previously reported to be
associated with BMI, weight, and waist circumference ... 40 Table 2.6 CLHNS association for SNPs previously reported to be
associated with height... 41 Table 2.7 Associations in CLHNS cohort of BMI and height SNPs
previously reported (P < 10‐4) in a Korean or Japanese
population cohort... 43 Table 2.8 Evidence in CLHNS cohort of longitudinal genotype main
Table 2.10 Evidence of study year‐by‐genotype interactions influencing
longitudinal BMI in the CLHNS cohort ... 47 Table 2.11 Age‐by‐genotype and study year‐by‐genotype interaction
results for longitudinal BMI in the CLHNS cohort... 48 Table 3.1 Association of three SNPs with plasma adiponectin level
in CLHNS offspring and mothers... 79 Table 3.2 Association of three‐SNP haplotypes with plasma
adiponectin level in CLHNS offspring ... 80 Table 3.3 Association of three‐SNP haplotypes with plasma
adiponectin level in CLHNS mothers... 81 Table 3.4 Association of candidate ADIPOQ SNPs with plasma
adiponectin level in CLHNS mothers conditioned on
R221S genotype... 82 Table 3.5 General characteristics of the CLHNS samples ... 83 Table 3.6 TaqMan primers for genotyping ADIPOQ and ETV5
SNPs of interest ... 84 Table 3.7 Associations of plasma adiponectin level in CLHNS offspring
Table 4.2 Conditional analysis identifies 117 unique SNPs independently associated with waist circumference
in sex‐combined and sex‐specific meta‐analyses ...113 Table 4.3 Associations of 84 independent waist circumference
signals with other anthropometric traits...120 Table 5.1 Basic characteristics of the CLHNS cohort... 132 Table 5.2 Associations of previously reported menarche and
obesity SNPs with age of menarche in the CLHNS ...133 Table 5.3 Mediation effects of childhood adiposity on associations
of menarche and obesity SNPs with age of menarche
LIST OF ABBREVIATIONS
1000G: 1000 Genomes Project
ADIPOQ: adiponectin, C1Q and collagen domain containing
BF%: body fat percentage
BMI: body mass index
CDH13: cadherin 13, H‐cadherin
CEU: Utah residents with ancestry from northern and western Europe
CHB: Han Chinese from Beijing, China
CNV: copy number variation
CVD: cardiovascular disease
CLHNS: Cebu Longitudinal Health and Nutrition Survey
CT: computed tomography
eQTL: expression quantitative trait locus
GWA: genome‐wide association
h2: narrow‐sense heritability
HapMap: International Haplotype Map Project
HC: hip circumferenceJPT: Japanese from Tokyo, Japan
LD: linkage disequilibrium
MAF: minor allele frequency
MetS: metabolic syndrome
PolyPhen: Polymorphism Phenotyping
R2: squared type II partial correlations
SAT: subcutaneous adipose tissue
SD: standard deviation
SE: standard error of the mean
SEM: standard error of the mean
SES: socio‐economic status
sICAM‐1: soluble circulating intracellular adhesion molecule‐1
UNC‐CH: The University of North Carolina at Chapel Hill
VAT: visceral adipose tissue
WC: waist circumference
WHO: World Health Organization
WHR: waist‐hip ratio
CHAPTER I Introduction
Obesity, or the accumulation of excess body fat, is a major world health issue. The World Health Organization (WHO) has estimated that in 2008 1.5 billion people worldwide were overweight, and of those, 500 million were obese (1). Despite being largely preventable, obesity and overweight together are the fifth leading risk factors for death worldwide (1). In the United States alone, medical costs in 2008 related to obesity were estimated to be $147 billion per year, representing nearly 10% of all medical costs (2). Once thought to be a disease of wealthy countries, the prevalence of obesity is also increasing in low‐ and middle‐income nations as well (3), especially in Asian countries. A major consequence of excess body fat is the development of metabolic syndrome (MetS), a collection of maladies including dyslipidemia, insulin resistance, and hypertension that contributes to increased risk of cardiovascular disease (CVD) (4). CVDs resulted in 30% of all deaths worldwide in 2008, more than any other single cause (5).
causes of obesity across the world (1). Socio‐economic status (SES), which influences both of these two factors, has itself a complicated relationship with obesity. In developed countries, higher SES is consistently associated with decreased risk of obesity in women but not in men (6). In developing countries, higher SES is generally associated with increased risk of obesity (6), but as these countries become richer, individuals with lower SES become more obese (7). Nonetheless, heritability studies of obesity‐related traits in pairs of monozygotic and dizygotic twins suggest they each have substantial genetic components (h2 = 40‐70%) (8).
MAJOR BODY FAT DEPOTS
tissue are associated with several metabolic risk factors, such as increased fasting plasma glucose or high blood pressure, these associations are significantly stronger in VAT than in SAT (10). Relatedly, VAT is also associated with increased risk of CVD (11). Within SAT, deep SAT is more associated with metabolic complications than superficial SAT (12).
The amount of fat per given body size varies by sex and age and also by ethnicity, which could be a proxy for the influence of genetic and dietary factors. Initial differences in body composition between men and women manifest during puberty and are related to exposures to various endocrine factors (13). Women tend to develop more gluteo‐femoreal fat (i.e., in the thighs, hips, and buttocks), whereas men develop more abdominal fat (13). In both men and women, body weight and the prevalence of obesity generally increase with age, mostly due to changes in diet and lifestyle (14, 15). After the onset of menopause, substantially more fat is distributed to the intra‐abdominal area in women than before (16). Ethnic differences in obesity risk have also been observed in both children and adults, and are attributed to a wide variety of factors, including SES, physiology, and other cultural exposures (17).
MEASURING OBESITY TRAITS AND ASSOCIATED HEALTH RISKS
epidemiological studies. Several other technological methods exist for measuring body fat, including ultrasound and dual‐energy X‐ray absorpitometry (DXA). Ultrasound measures body fat by applying very high frequency sound waves to the tissue and using the timing of the echoes to determine its size. DXA uses differences in X‐ray absorption to help distinguish bone from soft tissue and estimate fat
volume. Both of these methods are correlated with VAT measures made by CT (r = 0.79 and 0.70, respectively) (18). As succinctly summarized in (19), these methods and others not described here have advantages and disadvantages in terms of their availability, specificity, accuracy, and reproducibility that have to be carefully considered.
Anthropometric measures of obesity are most commonly used in research settings as they can be obtained in the field or the clinic with considerably less expensive equipment (e.g., a tape measure) and more basic training of staff. One of the most commonly used measures is body mass index (BMI), which is the ratio of a person's weight (kg) to the square of their height (m2). BMI represents overall
adiposity or the total amount of fat located around the body. While some body fat is necessary for proper health, excess adiposity is associated with increased cardio‐ metabolic risk. According to the WHO, a man or woman with a BMI ≥ 25 kg/m2 is
populations did not suggest clear enough cut‐off points different from the original guidelines (21). Although BMI is strongly correlated with VAT (r = 0.67) (18), its primary weakness as a health risk indicator is that it cannot distinguish between individuals who differ in muscle mass given the same weight and height.
Anthropometric traits exist along with other heritable obesity‐related traits—both metabolic (e.g., adiponectin) and physiological (e.g., age at
menarche)—as nodes in a complex biological network underlying the etiology of obesity. Their relationships will be briefly outlined below.
Excess adiposity results in an altered metabolic state that underlies the downstream co‐morbidities of obesity (30). One of the most abundant proteins found in the bloodstream, adiponectin is a protein hormone primarily secreted by cells called adipocytes that comprise the bulk of fat depots (31). Adiponectin is implicated in glucose regulation and fatty acid catabolism (32) and plays a number of roles in the cardiovascular system (32). Circulating plasma levels of adiponectin are negatively correlated with BMI (33), and hypoadiponectinemia is a risk factor for MetS and related traits (34, 35). The heritability of adiponectin level ranges from 30‐70% (36‐38).
Obesity is also connected to physiological traits such as age of menarche or the first onset of menstruation in girls. Very early menarche (< 12 years of age) is a risk factor for adult obesity (39, 40), T2D (41, 42), MetS (43), and CVD (44).
differences in menarcheal timing between racial groups suggest genetic
contributions to the trait (48). Approximately 50% of phenotypic variability in age of menarche is estimated to be explained by genetic factors (49). It is yet unclear whether early menarche is a risk factor per se or whether it is associated with poor health outcomes through the development of obesity or hormonal changes, or possibly all three pathways concurrently.
GENETIC ASSOCIATION STUDIES OF OBESITY TRAITS
increase in the number of published GWA studies and is considered a turning point towards widespread adoption of the approach (50).
Two competing hypotheses exist about how associated genetic variants, such as SNPs, act to drive phenotypic variability (51). The first posits that multiple common variants with smaller effects together in aggregate have a substantial impact on a trait. Most GWA studies so far have focused on studying common SNPs ascertained by the International HapMap Project (53). The second hypothesis contends instead that a few rare variants have large individual effects on trait variability. These two hypotheses are not necessarily mutually incompatible, but without a more comprehensive catalog of known genetic variants to test for association and much functional characterization of observed association loci, it is as yet unclear how much each frequency class contributes. Towards this end, the 1000 Genomes Project was initiated to ascertain a more complete set of low frequency variants for genetic study (54).
The National Human Genome Research Institute (NHGRI) has published and continues to update a resource cataloging the results of GWA studies since 2005 (55). As of April 2012, the NHGRI GWA catalog (available on‐line at
studies, research groups obtain the increased sample sizes and statistical power necessary to detect additional genetic variants with even smaller contributions to traits of interest.
One such meta‐analysis effort is the Genetic Investigation of Anthropometric Traits (GIANT) Consortium, which studies heritable body size traits. Previous GIANT meta‐analyses have been published on SNP associations with waist circumference (56), waist‐to‐hip ratio (WHR) (56, 57), BMI (58, 59), and height (60). These studies observed that while they only explained a small fraction of total variation in their respective anthropometric traits, there was compelling evidence to suggest that greater sample sizes would help identify additional signals. To facilitate ongoing large‐scale replication of these signals, the Cardio‐MetaboChip (MetaboChip) array was designed by members of GIANT and other large disease and trait consortiums. The MetaboChip is a custom genotyping array containing
>66,000 individual SNPs identified in meta‐analyses as associated with one or more of 23 metabolic, atherosclerotic, and cardiovascular diseases and traits. At 257 loci previously detected for these phenotypes, >140,000 SNPs provide dense coverage of rare and common variants to allow for the fine‐mapping of those association signals and the identification of potential secondary signals.
continental populations (61), may assist in fine‐mapping the disease‐causing variants in loci implicated across association studies. In some cases, the overlap of LD between two populations may correspond to an area of increased association signal strength, thus suggesting a narrower region of interest than in the discovery population alone (62).
THE CEBU LONGITUDINAL HEALTH AND NUTRITION SURVEY
During the original survey and at periodic follow‐ups, trained field staff from
the CLHNS conducted in‐home interviews and collected anthropometrics and
comprehensive environmental data, including nutritional intake and socio‐economic
indicators. In 2005, fasting blood samples were collected from both the mothers
and their now young adult offspring. Multiple plasma biomarkers were measured
and genomic DNA was extracted. These phenotypes and genotypes have allowed for
the ongoing genetic study of complex traits in this population‐based cohort. So far,
data from the CLHNS has been utilized in a candidate gene study of obesity (66),
GWA studies of plasma homocysteine (67), C reactive protein (68), and adiponectin
(69), as well as in a large‐scale meta‐analysis of lipid trait associations (70).
In the following chapters of this dissertation, I describe my studies of the
genetic bases of body size (71), circulating plasma adiponectin levels (72), and age
of menarche in individuals from the CLHNS. I also describe my main contribution to
the GIANT Consortium's efforts to understand the genetic basis of central obesity in
individuals of European ancestry. In the concluding chapter, I discuss how together
these published and unpublished data contribute to a greater understanding of
CHAPTER II
Genomewide association study of anthropometric traits and evidence of interactions with age and study year in Filipino women1
OVERVIEW
Increased values of multiple adiposity‐related anthropometric traits are important risk factors for many common complex diseases. We performed a genome‐wide association (GWA) study for four quantitative traits related to body size and adiposity (body mass index [BMI], weight, waist circumference, and height) in a cohort of 1,792 adult Filipino women from the Cebu Longitudinal Health and Nutrition Survey. This is the first GWA study of anthropometric traits in Filipinos, a population experiencing a rapid transition into a more obesogenic environment. In addition to identifying suggestive evidence of additional SNP association signals (P < 10‐5), we replicated (P < 0.05, same direction of additive effect) associations
and Asian populations suggests a narrowed association region for BDNF, while still including a proposed functional non‐synonymous amino acid substitution variant (rs6265, Val66Met). Finally, we observed significant evidence (P < 0.0042) for age‐ by‐genotype interactions influencing BMI for rs17782313 (MC4R) and rs9939609 (FTO), and for a study year‐by‐genotype interaction for rs4923461 (BDNF). Our results show that several genetic risk factors are associated with anthropometric traits in Filipinos and provide further insight into the effects of BDNF, FTO, and MC4R on BMI.
INTRODUCTION
Increased values of adiposity‐related traits are important risk factors for many common complex diseases. Understanding the basis for increased human body size may lead to insights into disease etiologies. Higher body mass index (BMI), weight, and waist circumference are associated with type 2 diabetes,
cardiovascular disease (CVD), hypertension, and cancer (73, 74). Increased height, however, is inversely associated with CVDs (75).
Over the last few decades, the adoption in Asian populations of Western‐style diets of increased fats and carbohydrates and of more sedentary habits has led to a marked increase in obesity (64, 65). In particular, a cohort of women from the ongoing Cebu Longitudinal Health and Nutrition Survey (CLHNS) based in the Philippines showed a six‐fold increase in prevalence of overweight and obesity associated with nearly two decades of substantial and continuing socio‐economic modernization (also illustrated by a increase in mean weight of 6.8 ± 7.1 kg) (65). The portion of increased prevalence due to the changes in environment versus increased age of these women is unclear.
We performed a GWA study to test for main effect SNP associations with measures of BMI, weight, waist circumference, and height in 1,792 adult Filipino women from the CLHNS. The longitudinal nature of this cohort also allowed us to examine the interactive effect of age and genotype on BMI over a 22‐year period from 1983 to 2005.
METHODS AND PROCEDURES
Most outcome and covariate measures reported in this current study were taken from the 2005 survey, except height, which is the average of the measurement during the pregnancy of the birth cohort in 1983‐1984 and the first post‐partum measurement. BMI, weight, and waist circumference were highly correlated with each other (Pearson r > 0.88), but not with average height (r < 0.44) (Table 2.1). For the longitudinal analyses, we used BMI from seven different time points in the study. The first BMI value was measured four months after birth of the index child; if data were missing, the measurement at six months or two months post‐partum was substituted. Six additional measurements were taken at 1, 8, 11, 15, 19, and 22 years after the baseline survey (the final measurement is from the 2005 survey). Observations were excluded from the analysis if women were pregnant at the time of the survey. The phenotypes weight, waist circumference, and height were approximately normally distributed, and BMI values were natural log‐transformed to satisfy model assumptions.
genotyped for QC purposes, and we dropped any SNPs that showed ≥ 3 Mendelian inheritance errors or genotype discrepancies with known HapMap genotypes. We then used CLHNS genotypes of 352,264 SNPs and pooled reference haplotypes of 60 CEU and 90 combined CHB+JPT HapMap samples to impute the genotypes of an additional 1,878,188 SNPs in MACH (92). Imputed values were substituted for all 352,264 directly genotyped SNPs, including any missing genotypes. We then
discarded SNPs with low‐quality imputations (Rsq ≤ 0.3) and estimated minor allele frequencies ≤ 0.01. In total, 2,073,674 SNPs were tested for association with the four quantitative anthropometric traits in 1,792 non‐pregnant CLHNS women with complete trait outcome and covariate data.
To evaluate population substructure among our CLHNS subjects, we constructed principal components (PCs) using the software EIGENSOFT (93, 94). We tested each of the first 10 PCs for association with each of the four
anthropometric outcomes (Table 2.2). We included all PCs for which association with any trait was significant at P < 0.05, hence five PCs were used as covariates in the final SNP association model for all traits.
Array Studio version 3.1 was used to perform the GWA statistical analyses (Omicsoft Corporation, Research Triangle Park, NC, USA). Assuming an additive
associated (P < 0.05) with at least one anthropometric trait in our samples (Table 2.2). Quanto version 1.2.3 was used for statistical power calculations (available on‐ line at hydra.usc.edu/gxe/).
For loci previously reported in a GWA study at P < 5 × 10‐8 in at least 1,000
samples, we chose a single representative SNP. If this SNP was not present in our dataset, we substituted a proxy SNP in high LD (r2 > 0.8 in both CEU and CHB+JPT,
HapMap Release 22) when possible. For one study of an Asian population cohort, we also evaluated additional loci reported with less significant evidence of
association (P < 10‐4). Conditional analyses to search for independent secondary
signals were performed for all SNPs within a 2 Mb region centered on the SNP with the strongest primary signal, including the primary signal SNP as an additional covariate in the linear regression.
To detect differences in local LD structure we identified the genomic positions of the SNPs bounding a 1 LD‐map unit window centered on the most strongly associated SNP in a locus, using previously constructed LD maps made from the individual CEU, CHB, and JPT HapMap populations (95).
Selected SNPs were tested for additive genotype effects on BMI in
other visits at which they were not pregnant. Examination of the model residuals indicated that natural log‐transformation was not appropriate in this longitudinal setting, and we therefore analyzed untransformed BMI.
RESULTS
We tested 2,073,674 SNPs for association with BMI, weight, waist circumference, and height in the CLHNS cohort (Table 2.3, Figure 2.1). No evidence of residual population stratification or cryptic relatedness between samples was observed based on genomic control values (λGC = 1.00‐1.03) and
quantile‐quantile plots (Figure 2.2). The most significant main effect associations (P < 10‐5) had not been previously reported (Table 2.4). The SNP most strongly
associated with BMI was rs17124318 (P = 5.91 × 10‐7), located downstream of
ATG4C. For weight, the most strongly associated SNP was rs16877106 (P = 1.44 × 10‐6), located in an intron of ANAPC4. The SNP most strongly associated with waist
circumference was rs1440072 (P = 7.87 × 10‐7), an intergenic SNP located
downstream of KCNE4 and in perfect LD (r2 = 1 [CEU, CHB+JPT]) with a SNP in the
3’‐UTR of the gene (rs3795884, P = 1.65 × 10‐6). Our strongest height association
signal (rs17818399, P = 2.74 × 10‐7) spans the PIGF and CRIPT genes. Our study had
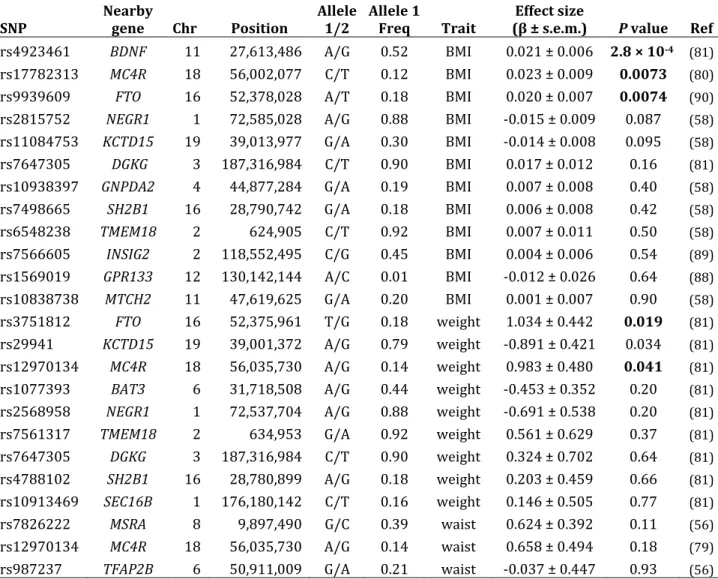
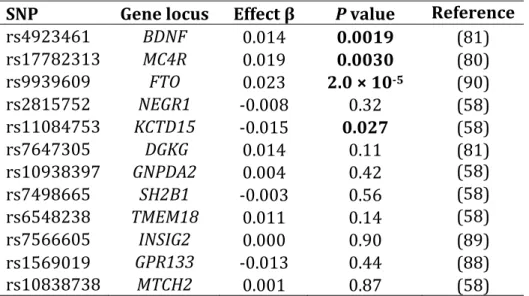
at the BDNF (rs4923461, P = 0.00028), MC4R (rs17782313, P = 0.0073), and FTO loci (rs9939609, P = 0.0074). Evidence from conditional analyses was consistent with a single BMI association signal at MC4R. For weight, we replicated previously reported associations at FTO (rs3751812, P = 0.019) and MC4R (rs12970134, P = 0.041). The CLHNS weight association for KCTD15 (rs29941, P = 0.034) was in the opposite direction as previously reported, and did not meet our criteria for
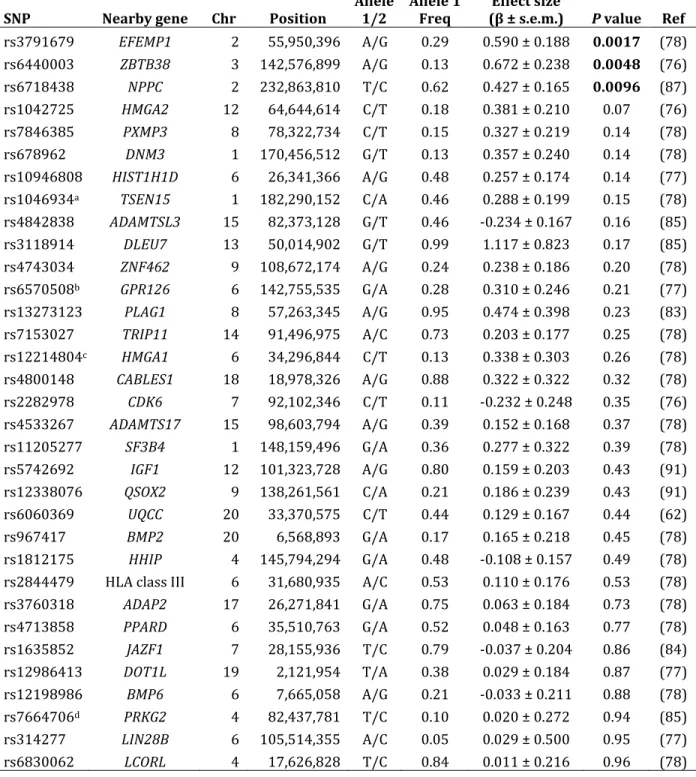
replication. For height, we replicated three previously reported associations with EFEMP1 (rs3791679, P = 0.0017), ZBTB38 (rs6440003, P = 0.0048), and NPPC (rs6718438, P = 0.0096). None of three previously reported associations with waist circumference replicated in the CLHNS. Together, these SNPs explain a small
proportion of trait variation (R2 = 1.9% [BMI], 1.1% [weight], 0.3% [waist
circumference], and 2.9% [height]). Our study had 80% power to replicate (P < 0.05) SNPs that explained 0.44% of the total variation in anthropometric traits in 1,792 Filipino women after adjustment for covariates.
We additionally examined 20 SNPs reported in a Korean population cohort with suggestive evidence of association (P < 10‐4) with either BMI or height (83),
and 10 SNPs reported in a Japanese cohort with suggestive evidence of association (P < 10‐5) with height (91). CLHNS data support evidence for association with BMI
narrow one of the association regions (Figure 2.3). Based on calculations from HapMap‐based LD maps, the association signal at BDNF appears smaller in genomic size in Asian populations (115 kb [CHB], and 124 kb [JPT]) than in European ones (294 kb [CEU]). This association region contains a non‐synonymous amino acid substitution SNP in BDNF (rs6265, Val66Met), which is in LD with the most associated CLHNS SNP rs4923461 (r2 = 0.85 [CEU], 0.64 [CHB+JPT]).
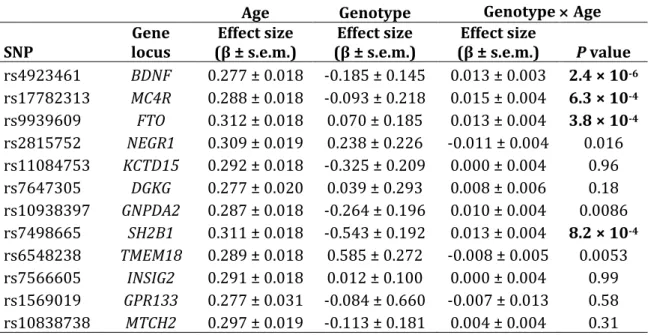
To examine whether genetic effects changed over time due to age or increasingly obesogenic environmental conditions, SNPs at 12 loci previously reported as associated with BMI were further evaluated in longitudinal mixed models using data from seven visits spanning 22 years. Of these 12 SNPs, three were nominally associated with BMI in CLHNS cross‐sectional analysis (Table 2.5). We tested all 12 SNPs for genotype main effects and then for age‐by‐genotype and study year‐by‐genotype interactions, both individually and jointly. Due to
confounding of age effects by study year (and vice‐versa), when evaluating SNPs that showed genotype interactions involving either age or study year, we performed tests of genotype main effects and age‐by‐genotype interactions stratified by study year. The most significantly associated SNP from the longitudinal genotype main effect analysis was the FTO SNP rs9939609 (P = 2.0 × 10‐5) (Table 2.8). Three
Four of the 12 SNPs showed statistically significant evidence (P < 0.0042, considering 12 tests) for an age‐by‐genotype interaction in the longitudinal analyses: rs4923461 (BDNF, P = 2.4 × 10‐6); rs9939609 (FTO, P = 3.8 × 10‐4);
rs17782313 (MC4R, P = 6.3 × 10‐4); and rs7498665 (SH2B1, P = 8.2 × 10‐4) (Table
2.9). Three additional SNPs had nominally significant age‐by‐genotype interactions: rs6548238 (TMEM18, P = 0.0053), rs1093839 (GNPDA2, P = 0.0086), and
rs2815752 (NEGR1, P = 0.016). Except for rs6548238 (TMEM18), the same pattern of significance occurred for all of these SNPs when tested for study year‐by‐
genotype interactions in models without an age‐by‐genotype interaction term (Table 2.10). In mixed models that included both age‐by‐genotype and study year‐ by‐genotype interaction terms, only the age‐by‐genotype interaction for
rs17782313 (MC4R) remained nominally significant (P = 0.046) (Table 2.11). Further analyses stratified by study year only clearly supported an age‐by‐ genotype interaction for rs17782313 (MC4R) (Figure 2.4). Specifically, the age‐by‐ genotype interaction coefficients for rs17782313 were consistent across study visits, resulting in slightly increasing main effect estimates of genotype over time in models absent the age‐by‐genotype interaction term. In contrast, age‐by‐genotype interaction coefficients for rs4923461 (BDNF) were not significantly different from zero at any single study visit, but the effect of genotype, in main effects analyses only, consistently increased over the study visits (Figure 2.5). The FTO SNP
patterns were less clear for the other loci that exhibited evidence for age‐by‐ genotype and study year‐by‐genotype interactions (Figure 2.7).
DISCUSSION
We have performed the first GWA scan for anthropometric traits in a cohort from the Philippines, a country undergoing socio‐economic and nutrition transition. The strongest signals with suggestive evidence of association in the CLHNS (P < 10‐
5) require confirmation in other studies. Among these signals, a SNP in the KCNE4
locus (rs1440072) was associated with both BMI and waist circumference. KCNE4 codes for the potassium voltage‐gated channel, Isk‐related family, member 4 protein, which acts as an inhibitory subunit to KCNQ1 (potassium voltage‐gated channel, subfamily Q, member 1) (97). KCNQ1 is expressed in adipose tissue and has been associated with type 2 diabetes in both European and Asian populations (98‐100).
We replicated (P < 0.05 and consistent direction of effect) 8 of 55 non‐ independent previously reported SNP‐trait associations (P < 5 × 10‐8) with BMI,
weight, waist circumference, and height, providing further evidence that these loci influence anthropometric trait variation across world populations. We also
additional loci likely reflects modest power of the CLHNS study to detect the signals, but could also indicate that the loci are population‐specific or influenced by
environmental or dietary exposures that differ between populations.
Inter‐population differences in local LD, which are especially pronounced between continental populations (53), may assist in fine‐mapping the disease‐ causing variants in loci implicated across association studies. In some cases, the overlap of LD between two populations may correspond to an area of increased association signal strength, thus suggesting a narrower region of interest than in the discovery population alone (62). We observed an appreciable difference in LD between the European and Asian HapMap populations at the BDNF locus. Consistent with previous observations that the LD from the CHB and JPT
populations is similar to the CLHNS (66), we observed a putatively smaller BDNF association region that still contained a non‐synonymous amino acid substitution (rs6265, Val66Met) associated with obesity (101). Further suggestive evidence of BDNF’s functional relevance to BMI includes observations that heterozygous and conditional knockout mice develop hyperphagia and obesity (102‐104).
support an age‐by‐genotype interaction for the widely studied BDNF SNP
rs4923461, but we found evidence suggesting increased main effects of genotype (specifically the A allele) over the study time period. Our results suggest that rs4923461 genotype likely interacts with a factor other than age that also changed over the 22‐year study period. Dietary and other environmental factors changed considerably between 1983 and 2005 and one or more of these factors may modify the effect of the rs4923461 genotype. Rates of overweight and obesity were initially low, and increased over time, providing substantially more variation in levels of body fat.
The BMI association for the FTO SNP rs9939609 over time is even more multifaceted, as we found evidence in the models stratified by study year supporting decreased effects of genotype with age at the later study visits, but no evidence for such an effect during the first 11 years of the study when our subjects were younger. The main effects, absent the age‐by‐genotype interaction term, of rs9939609
Recently, Hardy et al. reported evidence for age‐by‐genotype interactions influencing BMI for the same two MC4R and FTO SNPs (105). They observed
increasing effects of genotype for both loci through childhood and adolescence up to age 20, and then decreasing effects through adulthood. Because their participants were all the same age at any given year of the study, they could not distinguish between the effects of age and changing environment over time. The CLHNS
involved participants with wide ranging ages at baseline (15–48 years) followed for 22 years. While our stratified analyses can begin to separate the nature of these putative interactions, these analyses do not completely remove the mutual confounding of age and study year in our models because the participants necessarily aged during the course of the study.
In summary, we found suggestive evidence for additional association signals in a Filipino population cohort, and replicated several previously reported SNP associations with variation in BMI, weight, and height. We also further
characterized in a longitudinal setting the MC4R, BDNF, and FTO loci associated with BMI. Together, these results show that multiple genetic risk factors identified in other populations are also associated with anthropometric traits in Filipinos despite a transitioning nutritional environment.
ACKNOWLEDGMENTS
We thank the Office of Population Studies Foundation research and data collection teams. This work was supported by National Institutes of Health grants DK078150, TW05596, HL085144, and TW008288, pilot funds from RR20649, ES10126, and DK56350, and training grants T32 GM007092 to D.C.C.‐C. and T32 HL69768 to A.F.M.
DISCLOSURE STATEMENT
Figure 2.1 – Manhattan plots of associations with current measurements of (A) body mass index (natural logtransformed), (B) weight, (C) waist
Figure 2.3 – Further localization in the CLHNS of the BMI association signal at the BDNF locus. CLHNS association –log10(P values) for BMI and nearby genes
plotted against pair‐wise HapMap Phase II linkage disequilibrium values from phased genotypes in the CEU and the CHB+JPT populations. Dark red indicates r2 =
1 and white indicates r2 = 0. An arrow marks the non‐synonymous amino acid
Figure 2.4 – Evidence for a consistent longitudinal agebygenotype
interaction influencing BMI at rs17782313 (MC4R). Cross‐sectional main effect β coefficients (with no interaction term in the model) and age‐by‐genotype
interaction β coefficients at seven time‐points from baseline to 22 years afterward. Error bars represent standard errors. β coefficients are measured in untransformed BMI units (kg/m2).
Figure 2.5 – No evidence for a longitudinal agebygenotype interaction influencing BMI at rs4923461 (BDNF). Cross‐sectional main effect β coefficients (with no interaction term in the model) and age‐by‐genotype interaction β
Figure 2.6 – Evidence for a longitudinal agebygenotype interaction influencing body mass index (BMI) at rs9939609 (FTO) beginning after 11 years since baseline. Cross‐sectional main effect β coefficients (with no
Table 2.1 – Pairwise Pearson correlations of anthropometric traits in the CLHNS cohort
Waist circumference (cm) Weight (kg) log(kg/mBMI 2)
Average height (cm) 0.24 0.44 0.13
Waist circumference (cm) ‐ 0.88 0.88
Weight (kg) ‐ ‐ 0.94
BMI, natural log‐transformed body mass index.
Table 2.2 – Associations of trait covariates with outcomes in the CLHNS cohort P value
Trait Covariates BMI Weight
Waist circumference
Average height
Age ‐ < 0.0001 < 0.0001 0.21 0.0088
Age2 age 0.010 0.0013 0.0091 0.0002
Assets age, age2 < 0.0001 < 0.0001 < 0.0001 < 0.0001 Log(income) age, age2 < 0.0001 < 0.0001 < 0.0001 < 0.0001 Number of
Pregnancies age, age2 < 0.0001 < 0.0001 0.0002 0.016
Menopausal
status age, age2 0.0005 0.0003 0.11 0.075
PC1 age, age2, all other PCs 0.67 0.069 0.35 < 0.0001
PC2 age, age2, all other PCs 0.27 0.36 0.33 0.99
PC3 age, age2, all other PCs 0.73 0.72 0.88 0.61
PC4 age, age2, all other PCs 0.96 0.11 0.27 < 0.0001
PC5 age, age2, all other PCs 0.0092 0.012 0.36 0.37
PC6 age, age2, all other PCs 0.38 0.32 0.11 0.51
PC7 age, age2, all other PCs 0.15 0.091 0.093 0.29
PC8 age, age2, all other PCs 0.15 0.082 0.06 0.18
PC9 age, age2, all other PCs 0.64 0.82 0.52 0.33
PC10 age, age2, all other PCs 0.41 0.60 0.39 0.82
All traits are measured from the 2005 survey except average height, which is the average of the baseline measurement (during initial pregnancy) and seven post‐ partum measurements. Number of pregnancies is categorized into three groups: 0–4, 5–10, and ≥11. Significant associations (P < 0.05) are denoted in boldface. Age, age2, household assets, natural log‐transformed household income, number of
Table 2.3 – Demographic and descriptive statistics of the CLHNS cohort
Trait Value n
Body mass index (kg/m2) 24.3 ± 4.4 1,780
Waist circumference (cm) 81.1 ± 10.9 1,779
Weight (kg) 55.2 ± 10.9 1,780
Average height (cm) 150.4 ± 4.9 1,792
Age (years) 48.4 ± 6.1 1,792
Number of pregnancies 6.5 ± 3.0 1,792 Menopausal status
(yes/no) 687 / 1105 1,792
Table 2.4 – SNPs with suggestive evidence of association (P < 105) with four
anthropometric traits in the CLHNS
SNP Nearby gene Chr Position Allele 1/2 Allele 1 Freq Trait (β ± s.e.m.) Effect size P value
associated standard errors (s.e.m.). BMI is reported in natural log‐transformed units.
Table 2.5 – CLHNS association for SNPs previously reported to be associated with BMI, weight, and waist circumference
SNP Nearby gene Chr Position Allele 1/2 Allele 1 Freq Trait (β ± s.e.m.) Effect size P value Ref
rs4923461 BDNF 11 27,613,486 A/G 0.52 BMI 0.021 ± 0.006 2.8 × 10⁴ (81) rs17782313 MC4R 18 56,002,077 C/T 0.12 BMI 0.023 ± 0.009 0.0073 (80)
rs9939609 FTO 16 52,378,028 A/T 0.18 BMI 0.020 ± 0.007 0.0074 (90)
rs2815752 NEGR1 1 72,585,028 A/G 0.88 BMI ‐0.015 ± 0.009 0.087 (58)
rs11084753 KCTD15 19 39,013,977 G/A 0.30 BMI ‐0.014 ± 0.008 0.095 (58)
rs7647305 DGKG 3 187,316,984 C/T 0.90 BMI 0.017 ± 0.012 0.16 (81)
rs10938397 GNPDA2 4 44,877,284 G/A 0.19 BMI 0.007 ± 0.008 0.40 (58)
rs7498665 SH2B1 16 28,790,742 G/A 0.18 BMI 0.006 ± 0.008 0.42 (58)
rs6548238 TMEM18 2 624,905 C/T 0.92 BMI 0.007 ± 0.011 0.50 (58)
rs7566605 INSIG2 2 118,552,495 C/G 0.45 BMI 0.004 ± 0.006 0.54 (89)
rs1569019 GPR133 12 130,142,144 A/C 0.01 BMI ‐0.012 ± 0.026 0.64 (88)
rs10838738 MTCH2 11 47,619,625 G/A 0.20 BMI 0.001 ± 0.007 0.90 (58)
rs3751812 FTO 16 52,375,961 T/G 0.18 weight 1.034 ± 0.442 0.019 (81)
rs29941 KCTD15 19 39,001,372 A/G 0.79 weight ‐0.891 ± 0.421 0.034 (81)
rs12970134 MC4R 18 56,035,730 A/G 0.14 weight 0.983 ± 0.480 0.041 (81)
rs1077393 BAT3 6 31,718,508 A/G 0.44 weight ‐0.453 ± 0.352 0.20 (81)
rs2568958 NEGR1 1 72,537,704 A/G 0.88 weight ‐0.691 ± 0.538 0.20 (81)
rs7561317 TMEM18 2 634,953 G/A 0.92 weight 0.561 ± 0.629 0.37 (81)
rs7647305 DGKG 3 187,316,984 C/T 0.90 weight 0.324 ± 0.702 0.64 (81)
rs4788102 SH2B1 16 28,780,899 A/G 0.18 weight 0.203 ± 0.459 0.66 (81)
rs10913469 SEC16B 1 176,180,142 C/T 0.16 weight 0.146 ± 0.505 0.77 (81)
rs7826222 MSRA 8 9,897,490 G/C 0.39 waist 0.624 ± 0.392 0.11 (56)
rs12970134 MC4R 18 56,035,730 A/G 0.14 waist 0.658 ± 0.494 0.18 (79)
rs987237 TFAP2B 6 50,911,009 G/A 0.21 waist ‐0.037 ± 0.447 0.93 (56)
Significant associations (P < 0.05, consistent direction of effect) are shown in boldface.
Table 2.6 – CLHNS association for SNPs previously reported to be associated with height
SNP Nearby gene Chr Position Allele 1/2 Allele 1 Freq (β ± s.e.m.) Effect size P value Ref
rs3791679 EFEMP1 2 55,950,396 A/G 0.29 0.590 ± 0.188 0.0017 (78) rs6440003 ZBTB38 3 142,576,899 A/G 0.13 0.672 ± 0.238 0.0048 (76)
rs6718438 NPPC 2 232,863,810 T/C 0.62 0.427 ± 0.165 0.0096 (87)
rs1042725 HMGA2 12 64,644,614 C/T 0.18 0.381 ± 0.210 0.07 (76)
rs7846385 PXMP3 8 78,322,734 C/T 0.15 0.327 ± 0.219 0.14 (78)
rs678962 DNM3 1 170,456,512 G/T 0.13 0.357 ± 0.240 0.14 (78)
rs10946808 HIST1H1D 6 26,341,366 A/G 0.48 0.257 ± 0.174 0.14 (77) rs1046934a TSEN15 1 182,290,152 C/A 0.46 0.288 ± 0.199 0.15 (78) rs4842838 ADAMTSL3 15 82,373,128 G/T 0.46 ‐0.234 ± 0.167 0.16 (85)
rs3118914 DLEU7 13 50,014,902 G/T 0.99 1.117 ± 0.823 0.17 (85)
rs4743034 ZNF462 9 108,672,174 A/G 0.24 0.238 ± 0.186 0.20 (78)
rs6570508b GPR126 6 142,755,535 G/A 0.28 0.310 ± 0.246 0.21 (77)
rs13273123 PLAG1 8 57,263,345 A/G 0.95 0.474 ± 0.398 0.23 (83)
rs7153027 TRIP11 14 91,496,975 A/C 0.73 0.203 ± 0.177 0.25 (78)
rs12214804c HMGA1 6 34,296,844 C/T 0.13 0.338 ± 0.303 0.26 (78)
rs4800148 CABLES1 18 18,978,326 A/G 0.88 0.322 ± 0.322 0.32 (78)
rs2282978 CDK6 7 92,102,346 C/T 0.11 ‐0.232 ± 0.248 0.35 (76)
rs4533267 ADAMTS17 15 98,603,794 A/G 0.39 0.152 ± 0.168 0.37 (78)
rs11205277 SF3B4 1 148,159,496 G/A 0.36 0.277 ± 0.322 0.39 (78)
rs5742692 IGF1 12 101,323,728 A/G 0.80 0.159 ± 0.203 0.43 (91)
rs12338076 QSOX2 9 138,261,561 C/A 0.21 0.186 ± 0.239 0.43 (91)
rs6060369 UQCC 20 33,370,575 C/T 0.44 0.129 ± 0.167 0.44 (62)
rs967417 BMP2 20 6,568,893 G/A 0.17 0.165 ± 0.218 0.45 (78)
rs1812175 HHIP 4 145,794,294 G/A 0.48 ‐0.108 ± 0.157 0.49 (78)
rs2844479 HLA class III 6 31,680,935 A/C 0.53 0.110 ± 0.176 0.53 (78)
rs3760318 ADAP2 17 26,271,841 G/A 0.75 0.063 ± 0.184 0.73 (78)
rs4713858 PPARD 6 35,510,763 G/A 0.52 0.048 ± 0.163 0.77 (78)
rs1635852 JAZF1 7 28,155,936 T/C 0.79 ‐0.037 ± 0.204 0.86 (84)
rs12986413 DOT1L 19 2,121,954 T/A 0.38 0.029 ± 0.184 0.87 (77)
rs12198986 BMP6 6 7,665,058 A/G 0.21 ‐0.033 ± 0.211 0.88 (78)
rs7664706d PRKG2 4 82,437,781 T/C 0.10 0.020 ± 0.272 0.94 (85)
rs314277 LIN28B 6 105,514,355 A/C 0.05 0.029 ± 0.500 0.95 (77)
rs6830062 LCORL 4 17,626,828 T/C 0.84 0.011 ± 0.216 0.96 (78)
Columns and abbreviations are as described in Table 2.4.
ars1046934 is a proxy for reported SNP rs2274432 (r2 = 1 [CEU], 0.98 [CHB+JPT],
HapMap Phase 2, Release 22).
brs6570508 is a proxy for reported SNP rs4896582 (r2 = 0.96 [CEU], 0.92
[CHB+JPT]).