Exploiting Drug Addiction
Mechanisms to Select against
MAPKi-Resistant Melanoma
Aayoung Hong
1, 2
, 3
, Gatien Moriceau
1, 3
, Lu Sun
1, 3
, Shirley Lomeli
1, 3
, Marco Piva
1, 3
, Robert Damoiseaux
2, 3
, 4
,
Sheri L. Holmen
5, Norman E. Sharpless
6, Willy Hugo
1, 3
, and Roger S. Lo
1, 2
, 3
, 4
RESEARCH ARTICLE
ABSTRACT
Melanoma resistant to MAPK inhibitors (MAPKi) displays loss of fi tness upon experi-mental MAPKi withdrawal and, clinically, may be resensitized to MAPKi therapy after a drug holiday. Here, we uncovered and therapeutically exploited the mechanisms of MAPKi addiction in MAPKi-resistant BRAFMUT or NRAS MUT melanoma. MAPKi-addiction phenotypes evident upon drugwithdrawal spanned transient cell-cycle slowdown to cell-death responses, the latter of which required a robust phosphorylated ERK (pERK) rebound. Generally, drug withdrawal–induced pERK rebound upregu-lated p38–FRA1–JUNB–CDKN1A and downreguupregu-lated proliferation, but only a robust pERK rebound resulted in DNA damage and parthanatos-related cell death. Importantly, pharmacologically impairing DNA damage repair during MAPKi withdrawal augmented MAPKi addiction across the board by convert-ing a cell-cycle deceleration to a caspase-dependent cell-death response or by furtherconvert-ing parthanatos-related cell death. Specifi cally in MEKi-resistant NRASMUT or atypical BRAF MUT melanoma, treatment
with a type I RAF inhibitor intensifi ed pERK rebound elicited by MEKi withdrawal, thereby promoting a cell death–predominant MAPKi-addiction phenotype. Thus, MAPKi discontinuation upon disease pro-gression should be coupled with specifi c strategies that augment MAPKi addiction.
SIGNIFICANCE: Discontinuing targeted therapy may select against drug-resistant tumor clones, but drug-addiction mechanisms are ill-defi ned. Using melanoma resistant to but withdrawn from MAPKi, we defi ned a synthetic lethality between supraphysiologic levels of pERK and DNA damage. Actively promoting this synthetic lethality could rationalize sequential/rotational regimens that address evolv-ing vulnerabilities. Cancer Discov; 8(1); 74–93.
©
2017 AACR.See related commentary by Stern, p. 20.
1Division of Dermatology, Department of Medicine, University of
California, Los Angeles, California. 2 Department of Molecular and Medical
Pharmacology, University of California, Los Angeles, California. 3 David
Geffen School of Medicine, University of California, Los Angeles, Cali-fornia. 4 Jonsson Comprehensive Cancer Center, University of California,
Los Angeles, California. 5 Huntsman Cancer Institute and Department of
Surgery, University of Utah Health Sciences Center, Salt Lake City, Utah.
6 Lineberger Comprehensive Cancer Center, University of North Carolina
School of Medicine, Chapel Hill, North Carolina .
Note: Supplementary data for this article are available at Cancer Discovery Online (http://cancerdiscovery.aacrjournals.org/).
A. Hong and G. Moriceau contributed equally to this article.
Corresponding Author: Roger S. Lo, University of California, Los Angeles, 52-121 CHS , 10833 Le Conte Avenue, Los Angeles, CA 90095-1750. E-mail: [email protected]
doi:10.1158/2159-8290.CD-17-0682
INTRODUCTION
The combination of BRAF inhibitors plus MEK inhibi-tors (BRAFi + MEKi) extends the survival benefits of BRAFi monotherapy in BRAFV600-mutant melanoma by
counteract-ing MAPK-reactivatcounteract-ing resistance mechanisms (1–9). However, acquired resistance to BRAFi + MEKi is the norm rather than the exception. In cell line and patient-derived xenograft (PDX) models of BRAFV600-mutant melanoma adapted to BRAFi
mon-otherapy, loss-of-fitness due to BRAFi withdrawal in a process termed drug addiction has been documented (2, 10). Moreover, the magnitude of drug addiction increases with adaptation to BRAFi + MEKi (2). Regardless of the extent of drug addiction, rebound phosphorylated ERK (pERK) levels induced by MAPKi (BRAFi or BRAFi + MEKi) withdrawal seemed critical for this phenotype, because a low dose of ERK inhibitor (ERKi) was sufficient to block this pERK rebound and reversed drug addic-tion (2). However, how pERK rebound mediates tumor cell cycle decele ration and/or cell death is unknown. Identifying the factor(s) that, together with pERK rebound, incite tumor cell death or regression (rather than mere tumor stabilization or tran-sient tumor cytostasis) may inform potential clinical strategies.
Anecdotal case series of patients with advanced BRAFV600-
mutant melanoma suggest that rechallenge with a MAPKi, after evidence of disease progression and a brief drug holi-day, can lead to clinical benefits, including objective tumor regression and enhanced life quality (11–16). More recently, a prospective clinical trial demonstrated that, following an interval of at least 12 weeks since disease progression and
off MAPKi, rechallenge with BRAFi + MEKi led to 32% par-tial responses and 40% disease stabilization (17). Thus, an intentional drug holiday may select against MAPKi-resistant melanoma, leading to a resensitization phenomenon. Maxi-mizing this counter-selection may lead to greater rates of resensitization and, if applied against microscopic resistance earlier during MAPKi therapy, could lead to longer durations of response or disease control.
Currently, MAPKi therapy is clinically approved only for patients with advanced BRAFV600-mutant melanoma. This is
because type I RAF inhibitors (vemurafenib and dabrafenib) specifically inhibit monomeric BRAFV600 mutants (18) but
paradoxically activate the MAPK pathway in NRAS-mutant and/or dimeric RAF-active melanoma (19–22). MEKi mono-therapy has clear clinical activity against advanced BRAFV600-
mutant melanoma (23) but more limited activity against advanced NRASMUT melanoma (24). Thus, strategies against
MEKi-resistant melanoma, including NRASMUT melanoma
specifically and other subsets of melanoma with potential MAPKi sensitivity, may have clinical utility.
or atypical BRAF mutations, we derived data suggesting that MAPKi addiction is not exclusive to BRAFV600-mutant
mela-noma and may be a hallmark of MAPKi-resistant melamela-noma.
RESULTS
Depth of Drug Addiction in Resistant Melanoma
Is Determined by Slow-Cycling versus Cell-Death
Responses to MAPKi Withdrawal
Previously, we have shown that acquired MAPKi resistance mechanisms vary in their degrees of ERK reactivation (1, 3, 25) and that the levels of MAPKi addiction correlate with the degrees of pERK rebound upon drug(s) withdrawal (2).
To assess the spectrum of variations in the MAPKi-addiction phenotype, we analyzed the cellular responses of BRAFV600-
mutant, double-drug resistant (DDR) melanoma cell lines to BRAFi + MEKi withdrawal. We extended our analysis to
NRASQ61-mutant melanoma sublines with acquired MEKi
resistance [M207 and M245 single-drug resistant (SDR)]. All 10 melanoma cell lines with diverse mechanisms (Sup-plementary Fig. S1A) of acquired MAPKi resistance (R-lines) displayed MAPKi addiction (Fig. 1A). This loss-of-fitness response (to MAPKi withdrawal) was transient in some R-lines but persistent in others, suggesting reversible slow-cycling and (by definition, irreversible) cell-death responses, respec-tively (Fig. 1A). By vital imaging (Fig. 1B), we observed that
Figure 1. MAPKi-resistant melanomas display distinct drug-addiction phenotypes characterized by slow-cycling versus cell-death responses. A,
Clono-genic growth of double-drug resistant or DDR (BRAFMUT) or single-drug resistant or SDR (NRASMUT) melanoma cell lines plated 24 hours with BRAFi
(vemu-rafenib) + MEKi (selumetinib) at 1 μmol/L or MEKi (trametinib) at 0.1 μmol/L followed by 7 days with (on) or 7 and 18 days without (off) inhibitor. B, Temporal vital images of MAPKi-resistant or R-lines on or off BRAFi + MEKi. C–E, Percentages of Annexin-V/PI-positive dead cells (C), CFSE dye dilution patterns (D), and levels of SA-βgal staining (E) in R-lines on or off MAPKi(s) for 6 days. Loading control (D) refers to the intensity of the CFSE dye initially loaded into the cells. F, Correlation between fold changes (FC) in CFSE dye dilution and % cell death off vs. on MAPKi(s). PI, propidium iodide.
A
Slow cycling–predominant Cell death–predominantSlow cycling–predominant
Senescent
subpopulation (%)
P
opulation (%)
CFSE dye dilution
Unstained + MAPKi(s) – MAPKi(s) Loading control CFSE (FC)
Cell death (FC)
1 0.5 1.5 2.5 3.5 4.5 5.5
2 3 4
100 50 0
Cell death–predominant
On (7d)
M229 DDR4
M229 DDR4
SKMEL28 DDR1
SKMEL28 DDR1
M395
DDR poly
M397 DDR poly
M397
DDR poly
M397 DDR poly
M238 DDR1
M229 DDR4
M229 DDR4
SKMEL28 DDR1
SKMEL28 DDR1
M229 DDR4 SKMEL28 DDR1 M395 DDR poly
M397 DDR poly
M238 DDR1
M207
SDR1
M245
SDR4
M245 SDR4
M245 SDR4
M245 SDR4
M245 SDR4
M207 SDR1
M249
DDR4
M249
DDR5
M249 DDR5
M249 DDR5
M249 DDR5
M249 DDR5
M249 DDR4
M249 DDR5
M249
DDR poly
Off (7d) Off (18d) On (7d)
On
Off
On
3.62 5.12 8.81
7.53 35.9
17.5 12.3
Annexin V
Pl
Off On Off
On
Off
On
Off
Off (7d) Off (18d) Days 0 3 5 7
B
C
E
D
F
a subset of R-lines responded to MAPKi withdrawal by slow-ing down proliferation, whereas a distinct subset responded predominantly by cell death (Fig. 1C). Consistently, cell-cycle slowdown predominant R-lines off-MAPKi displayed relatively lower CFSE dye dilution compared with on-MAPKi (Fig. 1D). On the other hand, residual cells that escaped a pre-dominantly cell-death response to drug withdrawal tended to retain dye strongly relative to the same R-lines on-MAPKi and the slow-cycling R-lines off-MAPKi (Fig. 1D). Furthermore, greater fractions of persisting cells after MAPKi withdrawal displayed senescence-associated β-galactosidase staining in the cell death–predominant R-lines (Fig. 1E), consistent with a reduced proliferative potential. Thus, a cell death–predomi-nant drug-addiction phenotype characterizes MAPKi-resist-ant melanoma cells that, upon drug withdrawal, undergo cell death in the majority subpopulation and a robust and per-sistent cell-cycle deceleration in the minority, remainder sub-population. On the other hand, a slow cycling–predominant drug-addiction phenotype characterizes MAPKi- resistant melanoma cells that, upon drug withdrawal, undergo a tran-sient cell-cycle deceleration (Fig. 1F).
Extent of ERK Rebound Induced by MAPKi
Withdrawal Dictates Tumor Cell Slow-Cycling or
Death Responses
We then assessed whether the extent of MAPKi withdrawal– induced pERK rebound (fold change from baseline) is causally related to distinct phenotypic outcomes. Cell death–predomi-nant R-lines displayed greater pERK rebound when compared with the slow cycling–predominant R-lines (Supplementary Fig. S1B and S1C). Moreover, a suboptimal or low dose of an ERKi (Supplementary Fig. S1D), when added to cell death–predomi-nant R-lines concomitant with MAPKi withdrawal, completely blocked cell death (Supplementary Fig. S1E) and, when added to both groups of R-lines during MAPKi withdrawal, reversed cell-cycle deceleration (Supplementary Fig. S1F). Consistently, suboptimal ERKi protected all R-lines from clonogenic growth suppression spurred by BRAFi +MEKi (in BRAFMUT R-lines) or
MEKi (in NRASMUT R-lines) withdrawal (Supplementary Fig.
S1G). We then tested whether augmenting MAPKi withdrawal– induced pERK rebound in a slow cycling–predominant R-line would enhance MAPKi addiction. BRAFV600E amplification drives
acquired MAPKi resistance via ERK reactivation (6) and has been associated with BRAFi (10) or BRAFi + MEKi (2) addiction. We engineered exogenous BRAFV600E overexpression in the slow
cycling–predominant R-lines SKMEL28 DDR1 (Supplementary Fig. S1H), which increased pERK levels on and especially off double-drug treatment. Functionally, BRAFV600E overexpression,
upon double-drug withdrawal, enhanced cell-death and cell-cycle deceleration, and suppressed long- and short-term growth (Sup-plementary Fig. S1I–S1L). Hence, the extent of pERK rebound upon MAPKi withdrawal determines the addiction phenotype of MAPKi-resistant melanoma (Supplementary Fig. S1M).
Effectors of Cell-Cycle or Death Responses to
MAPKi Withdrawal in Resistant Melanoma
To identify the effectors of distinct MAPKi-addiction phe-notypes in drug-resistant melanoma, we generated RNA-sequencing (RNA-seq) profiles of cell death–predominant (M249 DDR5) and slow cycling–predominant (SKMEL28
DDR1) R-lines on (6 hours) or off (6 hours and 24 hours) BRAFi + MEKi. From genes that were induced ≥2 fold by double-drug withdrawal in both R-lines and at both time points (Supplementary Fig. S2A), we analyzed for transcrip-tion factor (TF)–binding motif enrichment of the differen-tially up-expressed genes (Supplementary Fig. S2B). Among the six TFs whose binding motifs were enriched, four (JUNB, FOSL1/FRA1, FOSL2, and c-JUN) belonged to the AP1 fam-ily. Among these, JUNB and FOSL1/FRA1 transcripts were induced by MAPKi withdrawal (Supplementary Fig. S2C). At the protein level, both total FRA1 (and pFRA1) and total JUNB were induced by MAPKi withdrawal, together with induction of total FOS (and pFOS), FOSB, and p-p38, the upstream kinase (Supplementary Fig. S2D and see below). In slow cycling–predominant R-lines, double-drug with-drawal induced levels of pFRA1, p-p38, and the cell-cycle inhibitor p21 (Supplementary Fig. S2E). Treatment with a p38 inhibitor (p38i) during MAPKi withdrawal reduced the phosphorylation of its substrate (pHSP27) but not the level of p21. However, treatment with p38i in combination with FRA1 knockdown during MAPKi withdrawal abolished p21 induction, accelerated cell cycling, and reversed 40% to 60% of growth inhibition induced by MAPKi withdrawal in these slow cycling–predominant R-lines (Supplementary Fig. S2E–S2H). Given that JUNB was induced by MAPKi withdrawal (Supplementary Fig. S2C and S2I), we knocked down JUNB. Interestingly, joint JUNB and FRA1 knockdown abolished p21 induction by MAPKi withdrawal and recov-ered the growth of slow cycling–predominant R-lines after double-drug withdrawal (Supplementary Fig. S2I and S2J). However, shFRA1 transduction together with p38i treatment in a cell death–predominant R-line, M249 DDR5, blunted MAPKi withdrawal–induced p21 but failed to alter the cell-cycling profile, likely because the major growth inhibition phenotype, i.e., cell death, was not affected (Supplementary Fig. S2K–S2M). Consistently, M249 DDR5 was still strongly addicted to BRAFi + MEKi despite FRA1 knockdown and p38 inhibition (Supplementary Fig. S2N). Thus, p38–FRA1/ JUNB signaling and p21 accumulation induced by MAPKi withdrawal are necessary for the slow cycling but not the cell death–predominant phenotype of drug addiction.
To identify processes that drive the cell death–predomi-nant MAPKi-addiction phenotype, we analyzed the RNA-seq data for differential gene set enrichment between SKMEL28 DDR1 and M249 DDR5 [using the C2 (CGP subset), C6, and hallmark gene sets in MSigDB version 5.1] under each condi-tion (on drug for 6 hours, off drug for 6 hours, off drug for 24 hours). We selected gene sets that showed higher (median log2 difference of 1.25-fold or 25% up-expression across all
DACOSTA_UV_RESPONSE_VIA_ERCC3_COMMON_UP ZEMBUTSU_SENSITIVITY_TO_VINCRISTINE
HALLMARK_WNT_BETA_CATENIN_SIGNALING
YORDY_RECIPROCAL_REGULATION_BY_ETS1_AND_SP100_UP
Row z-score –2
On 6 h
on
off
0
0 2 8 24 48 0 2 8 24 48 0 2 8 24 48 0 2 8 24 48 0 2 8 24 48 0 2 8 24 48 0 2 8 2448
Nuclear
3 6
Ta
il moment (FC)
Off 6 h
M249 DDR5
M249 DDR5
M249 DDR4 M249 DDR5
M245 SDR4
M245 SDR4
M249 DDR5
M229 DDR4
M229 DDR4 vector
M229 DDR4 vector M395 DDR
poly
M229 DDR4 BRAF V600E
M229 DDR4 BRAF V600E
SKMEL28 DDR1
SKMEL28 DDR1
SkMEL28 DDR1
M249 DDR5
M229 DDR4
On Off
D
API
AIF
Merge
D
API
P
ARP
Merge
D
API
pH2AX
Merge
On Off
Off 24 h
Mito 0 1 3
Nucl 0 1 3
Cyto 0 1 3
WCL Days off drugs
AIF
PARP
pH2AX
PARP
Histone H3 pH2AX pERK Hrs off drugs
AIF
PARP
pH2AX 0 1 3
On 6 h
Off 6 h
Off 24 h
0 2 TIAN_BHLHA15_TARGETS SCHAVOLT_TARGETS_OF_TO53_AND_TP63 TSAI_RESPONSE_TO_IONIZING_RADIATION HALLMARK_INTERFERON_ALPHA_RESPONSE VANTVEER_BREAST_CANCER_BRCA1_UP TORCHIA_TARGETS_OF_EWSR1_FLI1_FUSION_TOP20_UP BRAF_SIGNATURE
MARCINIAK_ER_STRESS_RESPONSE_VIA_CHOP PARK_TRETINOIN_RESPONSE_AND_RARA_PLZF_FUSION PARK_TRETINOIN_RESPONSE_AND_PML_RARA_FUSION MOREIRA_RESPONSE_TO_TSA_UP
JOHANSSON_GLIOMAGENESIS_BY_PDGFB_UP THEILGAARD_NEUTROPHIL_AT_SKIN_WOUND_UP MARZEC_IL2_SIGNALING_UP
GARGALOVIC_RES_TO_OXIDIZED_PHOSPHOLIPIDS_YELLOW_UP SESTO_RESPONSE_TO_UV_C1
HOUSTIS_ROS
RAMPON_ENRICHED_LEARNING_ENVIRONMENT_LATE_UP HALLMARK_NOTCH_SIGNALING
TONKS_TARGETS_OF_RUNX1_RUNX1T1_FUSION_MONOCYTE KORKOLA_TERATOMA_UP
AMUNDSON_DNA_DAMAGE_RESPONSE_TP53 NIELSEN_SYNOVIAL_SARCOMA_UP INGA_TP53_TARGETS
FINAK_BREAST_CANCER_SDPP_SIGNATURE NUMATA_CSF3_SIGNALING_VIA_STAT3 KORKOLA_EMBRYONAL_CARCINOMA_UP AMIT_EGF_RESPONSE_60_HELA
GARGALOVIC_RES_TO_OXIDIZED_PHOSPHOLIPIDS_RED_UP XU_CREBBP_TARGETS_UP
CEBALLOS_TARGETS_OF_TP53_AND_MYC_UP KRIGE_AMINO_ACID_DEPRIVATION ZHOU_TNF_SIGNALING_30MIN GENTILE_UV_LOW_DOSE_UP SMIRNOV_RESPONSE_TO_IR_2HR_UP PENG_GLUCOSE_DEPRIVATION_UP STAEGE_EWING_FAMILY_TUMOR DELLA_RESPONSE_TO_TSA_AND_BUTYRATE ZHU_CMV_8_HR_UP
WILLIAMS_ESR1_TARGETS_UP
IIZUKA_LIVER_CANCER_PROGRESSION_G2_G3_UP RADAEVA_RESPONSE_TO_IFNA1_UP WHITEHURST_PACLITAXEL_SENSITIVITY HOFMANN_CELL_LYMPHOMA_UP CAIRO_HEPATOBLASTOMA_POOR_SURVIVAL PACHER_TARGETS_OF_IGF1_AND_IGF2_UP NUNODA_RESPONSE_TO_DASATINIB_IMATINIB_UP BENPORATH_ES_CORE_NINE_CORRELATED SANSOM_WNT_PATHWAY_REQUIRE_MYC STAMBOLSKY_BOUND_BY_MUTATED_TP53 COLLER_MYC_TARGETS_UP FUKUSHIMA_TNFS11_TARGETS
A
C
B
D
E
Figure 2. Excessive ERK activation induces DNA damage and AIF-mediated death in the cell death–predominant MAPKi-addiction phenotype. A, Heat
I
Vector M245 SDR4 shAIF shH2AX 5.03 2.74 Annexin-V Pl On Off 5.61 2.2986.2 3.16 93.3 1.66
102 102 103 103 DsRed-A 104 104 105 105 0 0 102 102 103 103 FITC-A FITC-A 5.78 3.98 85 5.19 102 102 103 103 DsRed-A 104 104 105 105 0 0 FITC-A DsRed-A 104 104 105 105 0 0 36.4 4.4 5.91 6.69
40.4 2.42 86.6 7.2
102 102 103 103 DsRed-A 104 104 105 105 0 0 102 102 103 103 FITC-A FITC-A 3.4 2.12 91 3.5 102 102 103 103 DsRed-A 104 104 105 105 0 0 FITC-A DsRed-A 104 104 105 105 0 0
F
Nuclear V sh + + V sh – – WCL V sh + +V sh shAIF BRAFi + MEKi
Vector M249 DDR5 M249 DDR5 M245 SDR4 – – Nuclear V sh + + V sh – – WCL V sh + +
V sh shAIF
shAIF MEKi PARP AIF pH2AX GAPDH pH2AX pERK GAPDH
– – shH2AX
V #2 + + #4 + shH2AX shH2AX V #2 – – #4
– BRAFi + MEKi
M249 DDR5 shH2AX V + #4 + shH2AX V – #4 – MEKi M245 SDR4
H
G
6.75 7.58 Annexin-V Pl On Off 7.06 6.3465.1 3.53 62.8 3.33
102 102 103 103 DsRed-A 104 104 105 105 0 0 102 102 103 103 FITC-A FITC-A 12.9 6.68 74.2 6.25 102 102 103 103 DsRed-A 104 104 105 105 0 0 FITC-A DsRed-A 104 104 105 105 0 0 36.4 13.6 5.92 4.25
44.1 13.6 74.7 7.2
102 102 103 103 DsRed-A 104 104 105 105 0 0 102 102 103 103 FITC-A FITC-A 14.3 6.65 72.6 6.46 102 102 103 103 DsRed-A 104 104 105 105 0 0 FITC-A DsRed-A 104 104 105 105 0 0
Figure 2. (Continued)F and G, Levels of indicated proteins by WBs in the nuclear fraction (F,G) or WCL (F) of R-lines, on or off MAPKi(s), transduced
J
K
N
M
O
P
L
M229 DDR4
M395 DDR1
SKMEL28 DDR1
M249 DDR5
0 0
Alexa fluor 488-A 20
40 60 80 100
M245 SDR4
0 0
Alexa fluor 488-A
Unstained shVector + MAPKi(s) shAIF + MAPKi(s)
shAIF
shAIF - MAPKi(s) Loading control
shVector - MAPKi(s) Unstained shVector + MAPKi(s)
Vector 10
20
Sur
viv
al (%)
30 40 50 60 70 80
shAIF Vector
***
***
shH2AX + MAPKi(s) shH2AX - MAPKi(s) Loading shVector - MAPKi(s) 20
40 60 80 100
merge
P
opulation (%)
CFSE dye dilution
M249 DDR5
M249 DDR5
M249 DDR5
0 0
Alexa fluor 488-A 20
40 60 80 100
M245 SDR4
M245 SDR4
shH2AX #2 shH2AX #4 shH2AX #4
Vector Vector
0 20
% Sur
viv
al (on dr
ug as 100%)
40 60 80 100 120
M249 DDR5 M245 SDR4
0 0
Alexa fluor 488-A 20
40 60 80 100
P
opulation (%)
CFSE dye dilution
DA
PI
PA
R
Merge
D
API
PA
R
SKMEL28 DDR1
On Off On Off
on off
Merge
M249 DDR5
M249 DDR5
D
API
P
ARG
Merge
D
API
P
ARG
SKMEL28 DDR1
On Off On Off
Nucl
+ – + – + – + – + – + –
Cyto WCL
PARG
GAPDH pERK
***
***
***
Figure 2. (Continued) CFSE dye dilution patterns (J,K), and viable cell counts (L,M) in R-lines on or off MAPKi(s) for 6 days, transduced with empty
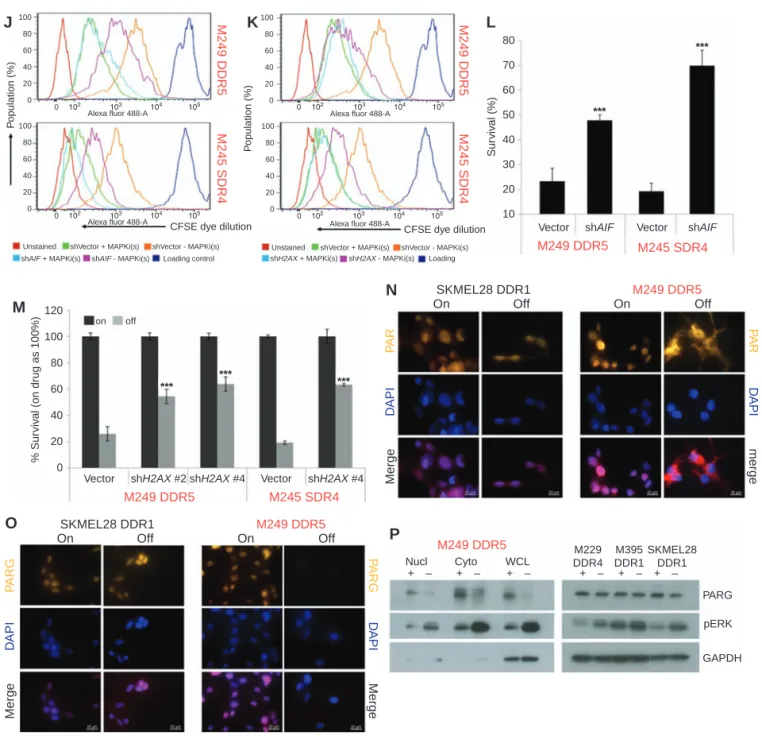
vector (Vector) or AIF (J,L) or H2AX (K,M) shRNA lentiviruses. For L, M,n= 6; mean ± SDs; ***, P< 0.001 based on ANOVA. N and O, Subcellular localization of PAR (N) or levels of PARG (O) by IF in R-lines. Nuclei visualized by DAPI; scale bars, 20 μm. P, PARG and pERK levels by WBs in the indicated fractions of M249 DDR5 or nuclear fractions of indicated additional R-lines. For WB, GAPDH, loading control.
DDR5 when withdrawn from MAPKi. Consistently, when we probed the levels of pH2AX, a marker of DNA damage and mediator of repair, only the cell death–predominant R-line, M249 DDR5, displayed pH2AX induction during MAPKi withdrawal (Fig. 2B and C).
We hypothesized that a strong pERK rebound might induce mitochondrial dysfunction and reactive oxygen species (ROS) and thereby DNA damage. Indeed, MAPKi withdrawal induced pronounced levels of mitochondrial ROS, swelling, and depo-larization only in the cell death–predominant R-lines (Sup-plementary Fig. S3). Pan-caspase inhibition did not rescue
not in the slow cycling–predominant R-line M229 DDR4, after MAPKi withdrawal, in conjunction with nuclear loss of PARP1, a binding partner of AIF and pH2AX (Fig. 2B and C). By using the comet assay, we corroborated increased DNA damage preferentially in the cell death–predominant phe-notype (Fig. 2D). In fact, when a slow cycling–predominant R-line (M229 DDR4) was engineered with BRAFV600E
over-expression, it then displayed increased DNA damage after MAPKi withdrawal, consistent with transition to a cell death– predominant MAPKi-addiction phenotype (Fig. 2D). Fur-thermore, pERK rebound coincided temporally with pH2AX induction in cell death–predominant R-lines (Fig. 2E). By manipulating the levels of pERK rebound pharmacologi-cally, we showed that the extent of pERK rebound among cell death–predominant R-lines was strictly associated with the degree of DNA damage, as measured by the comet assay or levels of pH2AX, or with the level of clonogenic growth (Sup-plementary Fig. S5A–S5E). In fact, pERK and pH2AX levels, quantified by immunofluorescence detection, across all cell death–predominant lines and tumors (see below) were highly correlated (Supplementary Fig. S5F).
To assess the functional contributions of AIF or H2AX to the cell death–predominant drug-addiction phenotype, we engineered M249 DDR5 and M245 SDR4 to express shVec-tor, shAIF or shH2AX (Fig. 2F and G). Importantly, AIF or H2AX knockdown strongly diminished pH2AX accumula-tion induced by MAPKi withdrawal and abrogated cell death while reducing cell-cycle deceleration and loss of viable cells (Fig. 2F–M). On the other hand, AIF knockdown did not rescue the growth-inhibitory effect of MAPKi withdrawal in slow cycling–predominant R-lines (Supplementary Fig. S6). Consistent with PAR as a key signal underlying excessive DNA damage-PARP-AIF-mediated parthanatos (a recently character-ized variant of programmed cell death; ref. 26), we observed PAR cytoplasmic localization as well as loss of PARG, the major enzyme responsible for PAR catabolism, upon MAPKi with-drawal only in the cell death–predominant R-line M249 DDR5, but not the slow cycling–predominant R-line SKMEL28 DDR1 (Fig. 2N–P). Thus, nonapoptotic programmed cell death driven by excessive DNA damage underlies the cell death–predomi-nant MAPKi-addiction phenotype.
Pharmacologic Induction of DNA Damage
Promotes Death across All MAPKi-Resistant Cell
Lines but Selectively during MAPKi Withdrawal
Because the prior results suggested a synthetic-lethal rela-tionship between excessive pERK level/rebound and DNA damage in the cell death–predominant drug-addiction phe-notype, we tested whether enhancing DNA damage via inhi-bition of DNA damage repair in slow cycling–predominant R-lines would shift the drug-addiction phenotype toward cell death. We treated four slow cycling–predominant R-lines with ATMi, PARPi, or both after MAPKi withdrawal. In SKMEL28 DDR1, M229 DDR4, M238 DDR1, and M395 DDR poly, ATMi + PARPi added upon BRAFi + MEKi with-drawal strongly promoted pH2AX accumulation (Fig. 3A; Supplementary Fig. S7A), suppressed clonogenic growth or cell viability (Fig. 3B; Supplementary Fig. S7B and S7C), and induced cell death 6- to 10-fold (vs. only 2- to 4-fold on MAPKi; Fig. 3C; Supplementary S7D). To confirm the
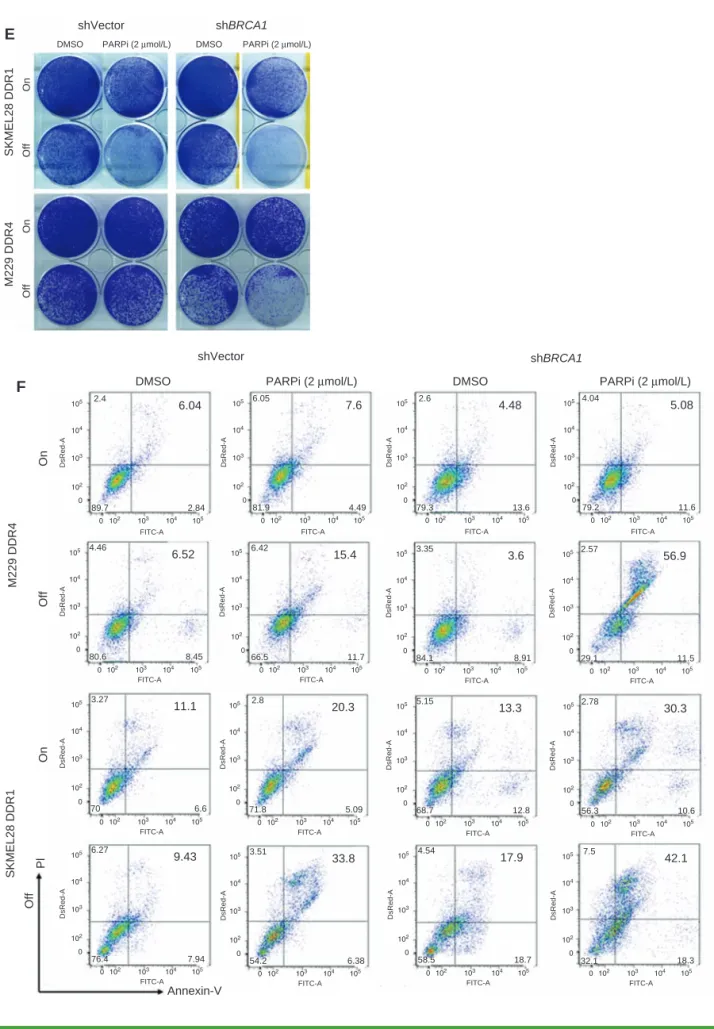
functional importance of DNA damage or its impaired repair in determining the cellular fate (death vs. slow-cycling) of R-lines off MAPKi or during pERK rebound, we knocked down BRCA1 in the slow cycling–predominant R-lines (Supplementary Fig. S7E) and determined the pH2AX lev-els induced by MAPKi withdrawal, with or without PARPi (Fig. 3D). We found that downregulating DNA damage repair via BRCA1 knockdown and PARP1/2 inhibition, specifically after MAPKi withdrawal, strongly induced DNA damage (pH2AX levels), suppressed clonogenic growth (Fig. 3E) or cell viability (Supplementary Fig. S7F), and induced cell death 4- to 10-fold (vs. 0- to 3-fold on MAPKi; Fig. 3F).
We then assessed whether we could further enhance synthetic lethality in R-lines that were already cell-death predominant in their drug-addiction phenotype. In cell death–predominant R-lines (but not in a slow cycling–pre-dominant R-line), PARPi + ATMi added upon MAPKi with-drawal further induced the nuclear levels of AIF (Fig. 3G). Further boosting the induction of DNA damage (pH2AX levels) and nuclear AIF levels resulted in further clonogenic growth suppression that was evident after prolonged cul-ture off MAPKi (Fig. 3H), consistent with the highest level of cell death detected (early during the course of culture) in cell death–predominant R-lines taken off MAPKi along with PARPi + ATMi cotreatment (Fig. 3I). As earlier data indicated that the cell death–predominant drug-addiction phenotype did not involve induction of caspase-3 activity and could not be reversed by a pan-caspase inhibitor (Supplementary Fig. S4A–S4D), we went further to test whether cell death induced by MAPKi withdrawal plus DNA-damage repair inhibition in slow cycling–predominant R-lines would upregulate cas-pase-3 activity or function in a cascas-pase-3–dependent manner (Fig. 3J; Supplementary Fig. S4E). As shown clearly, caspase-3 was induced in slow cycling–predominant R-lines specifically during MAPKi withdrawal plus ATMi + PARPi cotreatment but not in a cell death–predominant R-line (Fig. 3K; Supple-mentary Fig. S4E). Accordingly, in slow cycling–predominant R-lines off MAPKi and on ATMi + PARPi, a caspase-3 inhibi-tor was able to rescue, at least partially, the drug-resistant melanoma cells from clonogenic suppression (Fig. 3L). In contrast, caspase-3 inhibition, consistent with pan-caspase inhibition (Supplementary Fig. S4A and S4B), failed to reverse the cell death–predominant phenotype (Fig. 3L).
Pharmacologically Augmenting ERK Rebound
and DNA Damage Induces Tumor Regression
of MEKi-Resistant NRAS
MUTor Atypical
BRAF
MUTMelanoma
Although MEKi monotherapy has been shown recently to have clinical activity against NRASMUT melanoma,
resist-ance developed readily (27). Thus, we sought a strategy that would exploit the aforementioned synthetic lethality to augment MEKi addiction in MEKi-resistant NRASMUT
melanoma. Because type I RAF inhibitors, including vemu-rafenib and dabvemu-rafenib, paradoxically activate ERK in the
BRAFWT/NRASMUT context (19–22), we hypothesized that
vemurafenib may augment MEKi withdrawal–induced pERK rebound and therefore a cell death–predominant drug-addic-tion phenotype. To this end, we tested four NRASMUT
Figure 3. Impairing DNA-damage repair augments MAPKi addiction. A, Western blot (WB) analysis of pH2AX levels in slow cycling–predominant R-lines on or off MAPKi(s), with or without ATMi and/or PARPi treatment for 3 days. B and C, Clonogenic growth (B) or percentages of Annexin-V/PI-positive dead cells (C) in slow cycling–predominant R-lines on or off MAPKi(s) for 5 days, with or without ATMi and/or PARPi treatment. D, WB analysis of BRCA1 and pH2AX levels in slow cycling–predominant R-lines, transduced with empty vector (V) or BRCA1-specific shRNA lentiviruses, on or off MAPKi(s), with or without PARPi treatment for 3 days. (continued on following page)
SKMEL28 DDR1
SKMEL28 DDR1
+ + + + – – – – – + – + – + – + – – + + – – + +
+ + + + – – – – – + – + – + – + – – + + – – + +
A
D
C
B
M229 DDR4
SKMEL28 DDR1
M229 DDR4
SKMEL28 DDR1
M229 DDR4
BRAFi + MEKi ATMi (2 µmol/L)
ATMi (2 µmol/L) ATMi + PARPi
PARPi (2 µmol/L)
PARPi (2 µmol/L)
pH2AX
TUBULIN
DMSO
ATMi (2 µmol/L) PARPi (2 µmol/L) ATMi + PARPi DMSO
On
Off
On
Off
On
Off
On
Off
Annexin-V
Pl
+ + + + – – – – V V sh sh V V sh sh
– + – + – + – +
+ + + + – – – – V V sh sh V V sh sh
– + – + – + – + M229 DDR4
BRAFi + MEKi shBRCA1
BRCA1 PARPi (2 µmol/L)
pH2AX
TUBULIN
4.99 6.14
84.9 3.93
FITC-A
DsRed-A
9.01 7.66
79.3 4.06
FITC-A
DsRed-A
20.5 18.4
54.6 6.59
FITC-A
DsRed-A
23 24.2
47.1 5.04
FITC-A
DsRed-A
5.86 4.73
84.2 5.25
FITC-A
DsRed-A
13.8 23.9
58.3 3.06
FITC-A
DsRed-A
25.1 19.7
48.6 6.59
FITC-A
DsRed-A
56.1 5.85
30.3 4.74
FITC-A
DsRed-A
6.01 4.45
83.1 6.48
FITC-A
DsRed-A
11.4 4.67
77.1 6.75
FITC-A
DsRed-A
9.43 6.27
76.4 7.54
FITC-A
DsRed-A
17.9 4.54
58.5 18.7
FITC-A
DsRed-A
4.87 4.69
86.5 3.95
FITC-A
DsRed-A
6.97 4.74
54.4 3.92
FITC-A
DsRed-A
14.2 7.45
69 9.35
FITC-A
DsRed-A
30.9 25.1
37.2 5.74
FITC-A
F
E
SKMEL28 DDR1
M229 DDR4
SKMEL28 DDR1
M229 DDR4
PARPi (2 µmol/L)
DMSO DMSO PARPi (2 µmol/L)
On
Off
On
Off
On
Off
On
Off
Annexin-V
Pl
shVector
PARPi (2 µmol/L) DMSO
shVector shBRCA1
PARPi (2 µmol/L) DMSO
shBRCA1
6.04 2.4
89.7 2.84
FITC-A
DsRed-A
7.6 6.05
81.9 4.49
FITC-A
DsRed-A
0
4.48 2.6
79.3 13.6
FITC-A
DsRed-A
5.08 4.04
79.2 11.6
FITC-A
DsRed-A
6.52 4.46
80.6 8.45
FITC-A
DsRed-A
15.4 6.42
66.5 11.7
FITC-A
DsRed-A
0
3.6 3.35
84.1 8.91
FITC-A
DsRed-A
56.9 2.57
29.1 11.5
FITC-A
DsRed-A
11.1 3.27
70 6.6
FITC-A
DsRed-A
20.3 2.8
71.8 5.09
FITC-A
DsRed-A
13.3 5.15
68.7 12.8
FITC-A
DsRed-A
30.3 2.78
56.3 10.6
FITC-A
DsRed-A
9.43 6.27
76.4 7.94
FITC-A
DsRed-A
33.8 3.51
54.2 6.38
FITC-A
DsRed-A
17.9 4.54
58.5 18.7
FITC-A
DsRed-A
42.1 7.5
32.1 18.3
FITC-A
DsRed-A
Figure 3. (Continued) E and F, R-line cells from D were subjected to the same assays as in B and C, respectively. For WBs, TUBULIN, loading control.
G
H
I
NUCL MITO WCL
M249 DDR5
MAPKi(S) PARPi + ATMi PARP
PARG AIF
pH2AX pERK HSP60 (mito) Histone H3 (nuclear)
+ + – – + + – – + + – – – + – + – + – + – + – +
NUCL MITO WCL + + – – + + – – + + – – – + – + – + – + – + – +
NUCL MITO WCL + + – – + + – – + + – – – + – + – + – + – + – +
M207 SDR1 M229 DDR4
M245 SDR4
ATMi (2 µmol/L)
ATMi (2 µmol/L)
ATMi + PARPi PARPi (0.5 µmol/L)
PARPi (0.5 µmol/L)
DMSO
DMSO
M249 DDR5
ATMi (2 µmol/L)
ATMi + PARPi PARPi (0.1 µmol/L) DMSO
M207 SDR1
ATMi (2 µmol/L)
ATMi + PARPi
PARPi + ATMi
PARPi (0.5 µmol/L) DMSO
On
Off
On
Off
On
Off
6 day
Off
16 day
M245 SDR4
M249 DDR5
4.35
Annexin-V
Pl
FITC-A
DsRed-A
4.02
FITC-A
DsRed-A
3.62
FITC-A
DsRed-A
3.44
FITC-A
DsRed-A
45.0
FITC-A
DsRed-A
37.6
FITC-A
DsRed-A
23.9
FITC-A
DsRed-A
22.8
FITC-A
DsRed-A
ATMi (2 µmol/L) PARPi (0.1 µmol/L)
DMSO PARPi + ATMi
9.58
FITC-A
DsRed-A
9.31
FITC-A
DsRed-A
6.04
FITC-A
DsRed-A
4.31
FITC-A
DsRed-A
28.4
FITC-A
DsRed-A
22.2
FITC-A
DsRed-A
15.3
FITC-A
DsRed-A
15.5
FITC-A
DsRed-A
Figure 3. (Continued) G, Levels of indicated proteins by WBs in mitochondrial (MITO), nuclear (NUCL) subcellular fractions or whole-cell lysates (WCL)
MEKi, which displayed variable degrees of ERK reactivation (on drug) or hyperactivation (off drug; Fig. 4A). Importantly, initiating BRAFi treatment at the time of MEKi withdrawal in these NRASMUT melanoma SDR clones resulted in a more
rapid and robust pERK rebound, growth suppression, and cell death, compared with MEKi withdrawal alone (Fig. 4B–D). As was shown with cell death–predominant BRAFMUT
DDR-lines, MEKi withdrawal with or without BRAFi treatment in these NRASMUT SDR-lines induced pH2AX accumulation and
altered PAR and AIF localization (Fig. 4E).
We also tested in vivo the synthetic-lethal relationship (between supraphysiologic ERK activity and excessive DNA damage) underlying a cell death–predominant drug-addic-tion phenotype. We focused on a MEKi-resistant NRASMUT
PDX model (Fig. 5A–E) and a MEKi-resistant non-BRAF V600 or atypical BRAF-mutant (BRAFS365L) PDX model
(Fig. 5F–J), because targeted therapies against these mela-noma genotypes are currently lacking. To derive a MEKi-resistant NRASMUT PDX model, F1 PDX fragments were
transplanted in NSG mice, and mice with tumors of similar volume were treated with trametinib at 5 mg/kg daily (day
25), which led to maximal tumor regression within 10 days (day 33) followed by acquired MEKi resistance (Fig. 5A). One resistant tumor, excised at day 85, was fragmented and seri-ally transplanted into mice with continuous daily MEKi treat-ment until a cohort of mice with similar tumor volumes was assembled. This group of mice was divided into three sub-groups: continuous trametinib, trametinib withdrawal, and vemurafenib treatment with trametinib withdrawal (Fig. 5B). Importantly, withdrawing trametinib (half-life of 4 hours) led to a transient tumor regression. However, vemurafenib treat-ment upon trametinib withdrawal led to a significantly more sustained tumor regression (Fig. 5B–D). Analysis of these three groups of tumors revealed that, whereas trametinib withdrawal induced pERK, vemurafenib treatment on top of trametinib withdrawal further upregulated pERK (Fig. 5E). Consistent with cell line findings (Fig. 4), trametinib withdrawal, especially with vemurafenib treatment, induced DNA damage or pH2AX (Fig. 5E). Interestingly, trametinib withdrawal plus vemurafenib treatment led to redistribu-tion of nuclear PAR to the cytoplasm (Fig. 5E). Consistent with tumor volumes/sizes/weights, tumors withdrawn from
PARPi + ATMi Stauro-sporine (+MAPKi) Z-DEVD-FMK Z-DEVD-FMK
Caspase 3 (FC)
Staurosporine
Z-DEVD-FM
K
DMSO
M229 DDR4
M229 DDR4- 3 day
SKMEL28 DDR1- 3 day SKMEL28 DDR1- 6 day M229 DDR4- 6 day
ATMi + PARPi + Z-DEVD-FMK On Of f M249 DDR5 M249 DDR5 M245 SDR4 On Of f SKMEL28 DDR1 On Of f
J
K
L
MAPKi ATMi + PARPiMAPKi + *** *** *** *** *** *** *** *** *** * ** *** *** ****** *** *** *** ** *** ****** *** *** *** ** ** ** ****** * 0 0.5 1 1.5 2 2.5 3 3.5 – – – + – + – + + – – – – – – – + – – – + + – + – – + + – + + Z-DEVD-FMK Staurosporine MAPKi ATMi + PARPi + 0 1 2
Caspase 3 (FC)
3 4 5 – – – + – + – + + – – – – – – – + – – – + + – + – – + + – + + – + – + – +
Figure 3. (Continued) J–L, Levels of caspase-3 activity (J,K) or clonogenic growth (L) with indicated MAPKi(s) treatment, with or without ATMi and
A
B
C
D
Parental 0 1 241 0
0 – + – + – +
4 24 24 1 240 SDR4 SDR5
M245
M245 SDR4
0 – + – + – +
4 24
M245 SDR5
0 – + – + – +
4 24
M207 SDR1
0 – + – + – +
4 24
M296 SDR3
Parental 0 1241240
SDR1
M207
Parental 0 1241 240
SDR3
M296
pERK
ERK
TUBULIN Hrs on MEKi
pERK
ERK
TUBULIN Hrs off MEKi BRAFi (5 µmol/L)
M245 SDR4
M245 SDR4
DMSO
DMSO
On
Off
On
Off Pl
Annexin V
5.34
FITC-A
DsRed-A
4.35
FITC-A
DsRed-A
12.2
FITC-A
DsRed-A
7.23
FITC-A
DsRed-A
41
FITC-A
DsRed-A
20.3
FITC-A
DsRed-A
42.6
FITC-A
DsRed-A
25.3
FITC-A
DsRed-A
5 µmol/L BRAFi
M245 SDR5
DMSO 5 µmol/L BRAFi
5 µmol/L BRAFi
M245 SDR5
DMSO 5 µmol/L BRAFi
M207 SDR1 DMSO
On
Off Pl
Annexin-V
2.65
FITC-A
DsRed-A
5.54
FITC-A
DsRed-A
8.93
FITC-A
DsRed-A
5.21
FITC-A
DsRed-A
25.4
FITC-A
DsRed-A
16.6
FITC-A
DsRed-A
50.8
FITC-A
DsRed-A
31.9
FITC-A
DsRed-A
5 µmol/L BRAFi
M296 SDR3
DMSO 5 µmol/L BRAFi M207 SDR1
DMSO 5 µmol/L BRAFi
M296 SDR3
DMSO 5 µmol/L BRAFi
Figure 4. Paradoxical ERK activation by BRAFi potentiates drug addiction in MEKi-resistant NRASMUT melanoma. A and B, Western blot levels of pERK,
ERK, and loading control TUBULIN in NRASMUT parental and isogenic MEKi-resistant SDR-lines with indicated hours on MEKi/trametinib (0.1 μmol/L)
treatment (A) or in SDR-lines with indicated hours off MEKi/trametinib (0.1 μmol/L) treatment, with or without BRAFi/vemurafenib (5 μmol/L) treatment (B). C and D, Clonogenic growth (C) and percentages of Annexin-V/PI-positive dead cells (D) in NRASMUT SDR-lines on or off MEKi/trametinib (0.1 μmol/L)
E
–+ ++ –– +– –+ ++ –– +
p-H2AX
PA
R
D
API
D
API
Merge
Merge
AIF
D
API
Merge
p-H2AX
PA
R
D
API
D
API
Merge
Merge
AIF
D
API
Merge
– MEKi BRAFi
M245 SDR4 M207 SDR1
Figure 4. (Continued) E, Levels and/or subcellular localization of pH2AX, PAR, and AIF in cell death–predominant MEKi-addicted R-lines on or off
MEKi for 3 days, with or without BRAFi (5 μmol/L) treatment.
trametinib and then treated with vemurafenib displayed the lowest proliferation or Ki67 level (Fig. 5E). To derive a MEKi-resistant atypical BRAFMUT PDX model, we treated F1 PDX BRAFS365L melanoma tumors in NSG mice with trametinib at
5 mg/kg daily (day 25), which led to maximal tumor regres-sion within 20 days (day 45) followed by acquired MEKi resist-ance (Fig. 5F). The fastest growing MEKi-resistant tumor was selected for serial transplantation on continuous MEKi ther-apy and divided into three experimental groups: continuous trametinib, trametinib withdrawal, and vemurafenib treat-ment with trametinib withdrawal. As with MEKi-resistant
NRASMUT PDX tumors, BRAFS365L PDX tumors resistant to
MEKi responded to MEKi withdrawal but more robustly when a type I RAF inhibitor (vemurafenib) was added during MEKi withdrawal (Fig. 5G–I). Consistent with the notions that non-V600E BRAF mutants operate as RAF dimers and that enhanced RAF dimerization can drive MAPK reactivation and hence acquired MEKi resistance (18), we observed that
BRAFi addition during MEKi withdrawal robustly upregu-lated the pERK level (along with levels of pH2AX, PAR) coin-cident with Ki67 downregulation (Fig. 5J and Supplementary Fig. S8A).
We then tested whether we could effect deeper and more sustained tumor regression by triggering DNA damage dur-ing pERK rebound (Fig. 5K). We noticed in vitro (in NRASMUT
SDR-lines) that PARPi treatment alone (without ATMi) could enhance to some extent clonogenic suppression and cell death induced by MEKi withdrawal (Fig. 3H and I). Simi-larly, in long-term clonogenic assays (Supplementary Fig. S8B), although BRAFi or PARPi each could further suppress the growth of NRASMUT SDR-lines withdrawn from MEKi,
their combination led to the most profound suppression of growth. Importantly, in vivo, MEKi withdrawal combined with BRAFi + PARPi led to the most profound and sustained regression of MEKi-resistant NRASMUT melanoma (Fig. 5K
A
4,500 1,200 MEKi withdra wa l + BRAFi MEKi withdra wa l MEKi continuous MEKi withdr aw al + BRAFi MEKi withdr aw al MEKi continuousMEKi (5 mg/kg) MEKi withdrawal
MEKi withdrawal + BRAFi (100 mg/kg) * P ≤ 0.05
MEKi (5 mg/kg) MEKi withdrawal
MEKi withdrawal + BRAFi (100 mg/kg) ** P ≤ 0.001
** P ≤ 0.001 * P ≤ 0.01
** ** 1,000 800 600 400 200 0 0 4,500 1,400 1,200 1,000 800 600 400 200 0
−43 −28 −18 −8 0 Days Days
3 5 8 Vehicle
MEKi (5 mg/kg) 4,000 3,500 3,000 2,500 2,000 1,500 1,000 500 0 1,600 1,400 1,200 1,000 800 1.4
P = 6.5e-4
1.2 1 0.8 0.6 W eight (g) 0.4 0.2 0
1 2 3 4 Treatment
5 6 7 600
400 200 0
−62−29−19−11−4 0 2 4 Days
6 8 10 12 14 16 ** * 0 19 29 34 39 43 48 53 57 62 67 71 76 80 84 88 93 97 102 107
30 39 48 55 57 Days
59 61 63 Vehicle
MEKi (5 mg/kg) 4,000 3,500 3,000 2,500 2,000 1,500 1,000 500 0 7 BRAFi MEKi pERK D API Merge BRAFi MEKi pERK D API Merge pH2AX D API Merge PA R D API Merge Ki67 D API Merge pH2AX D API Merge PA R D API Merge Ki67 D API Merge − + − − + − − + −− +− −+ −− +− −+ −− +− −+ −− +− + − + − − + − + − − − − + − − + − − 450 1.2 1 0.8 0.6 W eight (g) 0.4 0.2 0 400 350 300 250 W
eight (mg)200
150 100 50 0 MEKi MEKi withdrawal MEKi withdrawal
+ BRAFi
MEKi MEKi withdrawal
MEKi withdrawal
+ BRAFi
21 27 31 36 40 45 50 54 59 Days
64 68 73 78 82 87 92
of pERK, pH2AX, and PAR and suppression of Ki67 (Sup-plementary Fig. S8C and S8D). These and additional results (Supplementary Fig. S8E and S8F) suggest that inhibition of PARP specifically (or DNA damage repair in general) may be a potential strategy to augment MAPKi addiction.
We also assessed whether the synthetic lethality (between supraphysiologic levels of activated ERK and DNA damage) observed across MAPKi-resistant human melanoma cell lines and PDX tumors could also be observed in an immune-competent context. To do this, we generated a syngeneic and transplantable model of MEKi-resistant NrasMUT melanoma.
First, we derived a NrasQ61R/Ink4a/Lkb1 murine melanoma
cell line (TpLN61R for Tyrosinase p16 Lkb1 NrasQ61R) from
a tumor of the Tyr-CRE-NRAS Q61R genetically engineered murine melanoma model (28) and adapted TpLN61R to
effi-cient in vivo subcutaneous growth in C57BL/6 mice. These tumors were then chronically treated with trametinib at 5 mg/kg daily until MEKi-resistant tumors arose (Fig. 6A). We then dissociated a resistant tumor and cultured the tumor cells with trametinib in vitro (up to 0.1 μmol/L over three weeks). In vitro, this MEKi-resistant cell line, termed NILR2R (Nras, Ink4a, Lkb1, Resistant mouse 2 Right flank), displayed robust time-dependent induction of pERK lev-els by MEKi withdrawal, which was accelerated by BRAFi treatment (Fig. 6B). Consistent with robust pERK rebound levels, pH2AX was induced by MEKi withdrawal and fur-ther induced by BRAFi treatment during MEKi withdrawal (Fig. 6C). Importantly, PARPi treatment (at a low concentra-tion effective in augmenting cell killing among cell death– predominant R-lines, Fig. 3) during MEKi withdrawal and BRAFi treatment resulted in even greater pH2AX accumula-tion (Fig. 6C). Consistently, although BRAFi and/or PARPi had no appreciable effects on clonogenic growth or cell death levels of NILR2R in the presence of MEKi, BRAFi or PARPi treatment during MEKi withdrawal reduced clonogenic growth and increased the levels of cell death (Fig. 6D and E). Cotreatment of BRAFi and PARPi during MEKi withdrawal further reduced growth and increased death (Fig. 6D and E). Consistent with a cell death–predominant drug-addiction phenotype observed among MAPKi-resistant human mela-noma cell lines and PDX tumors, this MEKi-resistant murine melanoma cell line also displayed upregulation of PAR levels and nuclear localization of AIF during induction of the drug-addiction phenotype (Fig. 6F). Finally, we reimplanted NILR2R back into C57BL/6 mice treated with trametinib (5 mg/kg via daily gavage) and identified five groups of mice with closely matched tumor volumes (Fig. 6G). We then tested the individual tumor-shrinkage effect of BRAFi or the combined effect of BRAFi + PARPi treatments in vivo. As expected based on prior results, PARPi
intraperito-neal treatments had no significant effect on the growth of NILR2R tumors on continuous MEKi oral treatments. MEKi discontinuation alone led to transient tumor shrinkage. Importantly, BRAFi oral treatment beginning with MEKi dis-continuation prolonged the tumor-shrinkage effect of MEKi withdrawal (Fig. 6 G–I). PARPi + BRAFi cotreatment during MEKi withdrawal led to the most sustained tumor regression (Fig. 6G). Thus, pharmacologically augmenting ERK rebound and DNA damage to maximize regression of MEKi-resistant
NrasMUT melanoma tumors during MEKi withdrawal may be
feasible in an immune competent host.
DISCUSSION
Understanding the mechanisms underlying the cancer vulnerability of MAPKi addiction availed us with poten-tial therapeutic opportunities (Fig. 7). During a predomi-nantly tumor cell–death rather than cell-cycle deceleration response upon drug withdrawal, MAPKi-resistant mela-noma, regardless of the specific underlying driver(s) of resistance, displays a synthetic lethality between acute, suprabasal ERK hyperactivation and excessive DNA damage. Death by this synthetic lethality in the context of a robust pERK rebound is characterized by AIF-dependent but cas-pase-3–independent death. Impairing DNA-damage repair pharmacologically, on top of DNA damage already induced by strong pERK rebounds, further boosted AIF-dependent death of MAPKi-resistant melanoma cells. On the other hand, a weak MAPKi withdrawal–induced pERK rebound was sufficient to elicit only a cell-cycle slowdown, leading to persisters that will resume rapid proliferation. However, upon MAPKi withdrawal, an innately weak pERK rebound coupled with impairment of the DNA-damage repair machinery turned a predominantly slow-cycling response to a cell-death response that was caspase-3–dependent. Based on these findings, one would expect an even stronger synthetic lethality for drug-withdrawn, MAPKi-resistant melanoma harboring genetic loss of BRCA1/2 or display-ing BRCAness (ref. 29; either preexisting or acquired during MAPKi therapy). Thus, after emergence of MAPKi-resistant clones, targeting the DNA-damage repair pathways subse-quent to cessation of MAPKi dosing may specifically select against disease progression across the spectrum of MAPKi-addiction phenotypes.
In the particular contexts of MEKi-resistant NRASMUT
mel-anoma, type I RAF inhibitors such as vemurafenib further augmented ERK rebound (on top of what was induced by MEKi withdrawal) and cell death. Counter to the dogma that type I RAF inhibitor is contraindicated for NRASMUT
mela-noma, its ability to boost ERK levels in the context of MEKi
Figure 5. Excessive ERK and DNA damage induce regression of MEKi-resistant PDX tumors. A, Tumor volumes (mean ± SEM) of a NRASMUT PDX
transplanted in NSG mice in response to daily gavage with the vehicle (n= 3) or trametinib (5 mg/kg; n= 5). B, R1 trametinib-resistant NRASMUT PDX
tumors were grown in NSG mice for 55 days with daily trametinib (5 mg/kg) gavage until initiating indicated daily treatments or regimens (n= 4 in each group). Tumor volumes are shown as means ± SEM. P values, Student t test. MEKi, trametinib (5 mg/kg); BRAFi, vemurafenib (100 mg/kg). C, Pictures of tumors from three experimental groups in B on day 63. D, Tumor weights (means ± SEM; P value, unpaired t test) of three experimental groups in B. E, Levels of indicated proteins in representative tissue sections of tumors in C. Scale bars, 20 μm. F–J, As in A to E except experiments used a distinct PDX model harboring BRAFS365L and individual tumor growth curves were plotted separately in F. The MEKi-resistant tumor (R3) which arose first was
frag-mented, serially passaged, and used in G. K and L, R1 trametinib-resistant NRASMUT PDX tumors were serially passaged in NSG mice with daily trametinib
(5 mg/kg) gavage until segregation into seven groups (1, 2, 3, 5, n= 3 per group; 4, 6, 7, n= 5 per group). Tumor volumes and weights are shown as means
Figure 6. BRAF and PARP inhibitors augment MEKi addiction of NrasMUT murine melanoma in an immune competent host. A, Tumor volumes (mean ±
SEM) of TpLN61R murine melanoma cells transplanted in C57BL/6 mice in response to daily gavage with the vehicle (n= 6) or trametinib (5 mg/kg; n= 6).
One resistant tumor on day 36 was dissociated and cultured as a MEKi-resistant cell line (NILR2R). B, Western blot levels of pERK, ERK, and the loading control GAPDH in the MEKi-resistant NrasMUT SDR-line NILR2R, with indicated hours off MEKi/trametinib (0.1 μmol/L) treatment, with or without BRAFi/
vemurafenib (1 μmol/L) treatment. C, Analysis of NILR2R protein lysates by Western blots of pERK and pH2AX levels on or off MEKi, with or without BRAFi (1μmol/L) and/or PARPi (0.2 μmol/L) treatment for 3 days. D and E, Clonogenic growth (D; 8 days) and percentages of Annexin-V/PI-positive dead cells (E; 5 days) in NILR2R, on or off MEKi/trametinib (0.1 μmol/L), with or without BRAFi/vemurafenib (1 μmol/L) and/or PARPi (0.2 μmol/L) treat-ments. For D, cultures were seeded at 30K cells per well, except for the third row where cultures were seeded at 150K cells per well. F, Levels and/or subcellular localization of pH2AX, PAR, and AIF in NILR2R, on or off MEKi for 3 days, with or without BRAFi and/or PARPi treatment. Scale bars, 20 μm. G, Trametinib-resistant NILR2R cells were transplanted subcutaneously in C57BL/6 mice with daily trametinib (5 mg/kg) gavage until segregation into five groups (n= 6 per group). Tumor volumes are shown as means ± SEM. P values, Student t test. H, Pictures of tumors from the first four experimental groups (mice sacrificed due to tumor ulceration) in G on day 26. I, Tumor weights (means ± SEM; P value, unpaired two-way t test) of the first four experi-mental groups in G.
A
B
F
C
D
G
H
I
E
2,000Vehicle
DMSO BRAFi (1 µmol/L) PARPi (0.2 µmol/L) BRAFi + PARPi
48.9 38.8 69.9 1.28 1.45
MEKi 5 mg/kg 1,800
1,600 1,400 1,200
On
Off
1,000 800 600 400 200 0 0
−
+ −
− −+ + +− + − − + +− + − + + + + − − − −
+ − −
+ + +
− − −
− − +
− + −
− + + + − + − +
4
0 24 MEKi off (hr) pERK
MEKi BRAFi PARPi
pERK pH2AX GAPDH
DMSO
800
1 0.4
We
ight (g)
0.35 0.3 0.25 0.2 0.15 0.1 0.05 0
1 2 3 4 2
3 4
700 600 500 400
T
umor
vo
lume (mm
3)
300 200 100 0
0 7 13 16 18 Days
20 22 24 26 *
** **
Off
ERK
pH2AX
PA
R
AIF
D
API
D
API
D
API
Merge
Merge
Merge
GAPDH BRAFi (1 µmol/L)
MEKi BRAFi (1 µmol/L)
BRAFi (1 µmol/L)
PARPi (0.2 µmol/L)
BRAFi
+PARPi
PARPi (0.2 µmol/L)
7 15 17 19 21 23 25 Days
27 29 32 34 36
Off
On
addiction suggests a novel context-dependent application. Furthermore, MEKi-resistant melanoma with atypical
BRAFMUT mutations likely upregulated RAF dimer levels (as
a mechanism of resistance). This may explain the ability of vemurafenib to enhance pERK induction and tumor regres-sion during MEKi withdrawal. Given the potential liability of prolonged BRAFi treatment in these genetic contexts, further studies are required to define an optimal BRAFi treatment duration in the context of augmenting drug addiction.
This study highlights the potential utility of capitalizing on MAPKi-addiction mechanisms to control MAPKi-resistant subclones even before the development of clinically evident disease progression. Our recent study identified melanoma tumors, during MAPKi-induced regression, to be undergoing dynamic and stereotypic tumor cell and immune compart-mental adaptations (30). It will also be important to char-acterize the immune infiltration/composition and identify specific adaptive immune resistance mechanisms associated with tumor regression resulting from a pharmacologically augmented drug-addiction phenotype. Furthermore, MAPK inhibitors with ideal clinical pharmacokinetic properties (short half-lives, e.g., encorafenib, binimetinib) may be par-ticularly useful for implementation of strategies based on MAPKi addiction in human subjects. Finally, understanding in further detail how excessive ERK and DNA damage levels engage distinct programmed cell death pathways promises to guide the development of rotational therapies that adapt to evolving cancer vulnerabilities.
METHODS
Cell Culture, Subline Derivation, Constructs, and Inhibitors
All cell lines were routinely tested for Mycoplasma, and cell line and
sub-line identities have been ensured by the GenePrint 10 system (Promega) at routine intervals during the course of this study for banking and experi-mental studies. All cell lines were maintained in DMEM high glucose with 10% heat-inactivated FBS (Omega Scientific) and 2 mmol/L glutamine in
a humidified, 5% CO2 incubator. All M series cell lines were established
from patient-derived tumors at the University of California, Los Angeles
(UCLA). The TpLN61R cell line was derived at the University of North
Carolina and adapted to in vivo growth at UCLA in 2016. The NILR2R
cell line was established in vitro from a MEKi-resistant tumor at UCLA
in 2017. SKMEL28 was obtained from Dr. Alan Houghton (between 2008 and 2010). To derive resistant clones, parental melanoma cells
seeded at low density were treated with BRAFi + MEKi (vemurafenib +
selumetinib; BRAFMUT) or MEKi (trametinib; NRASMUT) every 2 to 3 days
for 6 to 12 weeks, and proliferative colonies were ring-isolated (except those designated “poly” for polyclonal where ring cloning was not
per-formed) and expanded. shH2AX, shFRA1, shJUNB, and vector (pLKO.1)
were obtained commercially (ThermoFisher). shBRCA1 and vector
(pGIPZ) were accessed through the Molecular Screening Shared Resource
at UCLA. BRAFV600E was subcloned into the doxycycline-repressible
len-tiviral vector pLVX-Tight-Puro ( ClontechLaboratories). Overexpression and knockdown constructs were packaged into lentiviral particles for
infection. Inhibitors were obtained from the following: vemurafenib in
vitro (Plexxikon); vemurafenib in vivo, selumetinib in vitro, trametinib
in vitro and in vivo (LC Laboratories); ERKi/SCH772984 (Merck); p38i/
SB203580, PARPi/Olaparib, ATMi/KU-55933, and caspasei/Z-VAD-FMK (Selleckchem).
Protein Detection
Cells were lysed in RIPA buffer (Sigma) with protease inhibitor (Roche) and phosphatase inhibitor (Santa Cruz Biotechnology) cocktails for Western blotting. For immunohistochemistry (IHC), tissues were fixed either in 4% paraformaldehyde (PFA) and sucrose cryoprotected in OCT or in formalin and embedded in paraffin (FFPE). For FFPE tissues, after deparaffinization and rehydration, tissue sections were subjected heat for antigen retrieval. PFA/OCT sections were not subjected to antigen retrieval. Both IHC and immunocytochemistry of cell lines were per-formed with Alexa Fluor–conjugated secondary antibodies (Life Tech-nologies) on 4% PFA-fixed cells. Nuclei were counterstained by DAPI. Fluorophore signals were captured with a Zeiss microscope (AXIO Imager A1) mounted with a charge-coupled device camera (Retiga EXi QImaging), and the images captured by Image-pro plus 6.0. Western blots and immunofluorescence assays were performed using the follow-ing antibodies: pERK1/2 (T202/Y204), p-c-FOS (S32), pFRA1 (S265), p-p38 MAPK (T180/Y182), p-HSP27 (S82), pHistone H2A.X (S139), total ERK1/2, c-FOS, FRA1, FOSB, p21, AIF, PARG, BRCA1, GAPDH (Cell Signaling Technology), TUBULIN (Sigma), PARP1, BRAF (Santa Cruz Biotechnology), PAR (Enzo), and Ki67 (EMD Millipore). Western blot quantification was performed using NIH ImageJ.
Cell Line–Based Assays
Clonogenic assays were performed by plating cells at single-cell density in six-well plates, and inhibitor/media replenished every 2 days for 7 days, unless noted otherwise. Colonies were fixed in 4% paraformaldehyde and stained with 0.05% crystal violet. Viable cell
Figure 7. Strategies to select against MAPKi-resistant melanoma. Schematic showing MAPKi-addiction phenotypes being driven by pERK rebound
levels and potential therapeutic strategies (enhancing pERK or impairing DNA-damage repair) that promote tumor cell death (apoptosis or parthanatos) or regression.
Genotype MAPKi
BRAFV600E/K/R
BRAFNon-V600E/K/R
NRASMUT
BRAFi + MEKi
MEKi
MEKi pERK
PARP1 H2AX
ATM BRCA1
PARP1 H2AX
ATM BRCA1
Parthanatos*
Parthanatos + pseudosenescence*
Apoptosis*
*Regression of MAPKi-resistant tumors Strategies to augment MAPKi addiction
Slow-cycling
pERK
counts were performed in triplicate wells (in six-well plates). Cell death assays were performed by plating indicated cell lines with or without MAPKi(s) for 6 days (unless otherwise indicated), and cells were stained with Annexin V–FITC and propidium iodide for 15 min-utes at room temperature before sample loading (LSR II Flow Cytom-etry, BD Bioscience). CFSE (Molecular Probes) dilution detected by flow cytometry was used to monitor cell division. Cells were loaded
with 3 μmol/L of CFSE and cultured for 6 days. Samples were
col-lected and fixed in 2% PFA and analyzed with LSRII. Flow cytometry data were analyzed by FlowJo. Senescence was assessed by a
Senes-cence Associated β-Galactosidase staining kit (Cell Signaling
Tech-nology) with MAPKi withdrawn for 6 days. For vital imaging, cells were plated onto gridded dishes (Sigma) and imaged at indicated time points at predesignated areas. Comet assays (Cell Biolabs, Inc.) were performed by plating cell lines in six-well plates in the presence or absence of MAPKi for 3 days. Stranded breaks were detected by following the manufacturer’s recommendations, imaged with a Zeiss microscope (AXIO Imager A1), and distance of tails measured with Image-pro plus 6.0. 3 activity was assessed using Caspase-Glo 3/7 kit (Promega) by plating cells in white-walled, 96-well plates in the presence or absence of indicated inhibitors for 3 or 6 days.
RNA-seq Analysis
RNA-seq data from cell lines were generated using 2 × 100 bp
paired-end sequencing using the Illumina HiSeq2000 platform. Paired-paired-end reads were mapped to the UCSC hg19 reference genome using Tophat2 (31). Normalized expression levels of genes were expressed in FPKM values as generated by cuffquant and cuffnorm. Both programs were run with the option “–frag-bias-correct” and “–multi-read-correct” to improve sensitivity. For differential gene expression calls, a gene was defined as differentially expressed when its expression increased or decreased by at least 2-fold. RNA-seq runs on multiple sequencing lanes were independently mapped, and the expression values of each gene (in FPKM) were averaged across multiple lanes. To overcome noise in differential expression values caused by extremely low FPKM levels, we added a pseudo-FPKM value of 0.1 to all expression values. RNA-seq data have been made available through the Gene Expression Omnibus (GEO) at the accession number GSE87326.
Transcription Factor Enrichment Analysis
We collected transcription factor (TF) binding motifs in the form of position weight matrices (PWM) from the JASPAR database (32). Instead of using a fixed PWM score cutoff(s) as done in other PWM matching programs, we estimated the significance of the PWM score in
a gene’s promoter, which is defined as −1,500 to +1,500 bp from
tran-scription start site (TSS), by comparing the score with a background distribution of the same PWM’s scores on nonpromoter regions from randomly selected genes. Specifically, we collected 10,000 random 3 KB intragenic regions (excluding the genes’ promoter regions) and, for each sequence, computed the best score of a PWM. These scores defined an empirical background distribution of the PWM, and we defined a sig-nificant match of the PWM if and only if (i) the PWM score was greater than or equal to the 95th percentile of the background PWM scores (i.e.,
P≤ 0.05) and (ii) a PWM score was at least 0.75. This approach avoided
applying the same absolute PWM score cutoff on PWMs with differing lengths and complexities. To estimate enrichment of a TF’s PWM W in a set of coregulated genes G, we compared the number of significant matches of W in the promoter regions in G (accounting for possible multiple TSS for each gene) and the number of matches against a set of randomly selected promoter regions of the same size. We repeated the
latter step 100,000 times to estimate the empirical enrichment P value
of the PWM. Finally, we corrected the PWM enrichment P values across
all tested PWMs for multiple hypothesis testing using the Benjamini– Hochberg (FDR) method. A TF’s PWM was defined as enriched in a set
of genes when its adjusted enrichment P value was ≤ 0.05.
Gene Set Enrichment Analysis
Paired gene set enrichment analyses between off- versus on-drug conditions or between two different cell lines were performed as described previously (1). We computed differential gene set enrich-ments of the gene sets in the C2 CGP, C6, and Hallmark subsets from the Molecular Signature Database of the Broad Institute using the
following steps: (i) We calculated log2 fold changes (log2 FC) of mRNA
expression of each gene in M249 DDR5 compared with SKMEL28 DDR1 at all three treatment conditions, i.e., on-drug 6 hours,
off-drug 6 and 24 hours; (ii) Based on the log2 FC values, we computed
the differential enrichment of each gene set between M249 DDR5 and SKMEL28 DDR1 in all three treatment conditions (cutoff for differ-ential enrichment, Wilcoxon rank-sum test between genes within the
gene set and the rest of the genes; P≤ 0.05; median of up-expression
across all genes in the gene set ≥ 25%, i.e., median log2 FC ≥ 0.322);
(iii) To exclude differential enrichment already present between on-drug condition, for each of the gene sets meeting the cutoffs in step 2,
we required that the difference between the median log2 FC in either
off-drug condition to be higher than the median log2 FC in the
on-drug condition by at least 0.322 (1.25-fold higher); and (iv) For visuali-zation, we computed the single sample enrichment GSVA scores (33)
of the selected gene sets from step 3 using log2 CPM values as input.
PDX Models and Murine Melanoma
Mouse experiments were approved by the Animal Research
Com-mittee at UCLA. Tumor fragments derived from a NRASQ61R and a
BRAFS365L metastatic melanoma (F0), which were obtained from
two distinct patients with approval by the local Institutional Review Board, were transplanted subcutaneously in sex-matched NSG mice (6–8 weeks old). Tumors were measured with a caliper every 2 days, and
tumor volumes were calculated using the formula (length × width2)/2.
Trametinib-resistant tumors were cut into fragments, which were serially transplanted. NILR2R cells were injected at 1 million cells per flank in C57BL/6 mice. Mice were treated with vehicle (0.5% HPMC–0.2% Tween 80, pH8), trametinib (5 mg/kg), or vemurafenib (100 mg/kg) by oral gavage daily, or olaparib (25 or 50 mg/kg) by daily i.p. injections.
Disclosure of Potential Conflicts of Interest
N.E. Sharpless has ownership interest (including patents) in G1 Therapeutics and is a consultant/advisory board member for the same. No potential conflicts of interest were disclosed by the other authors.
Authors’ Contributions
Conception and design: A. Hong, G. Moriceau, S. Lomeli, R.S. Lo
Development of methodology: A. Hong, G. Moriceau, S. Lomeli, R. Damoiseaux, W. Hugo, R.S. Lo
Acquisition of data (provided animals, acquired and managed patients, provided facilities, etc.): A. Hong, G. Moriceau, M. Piva, R. Damoiseaux, S.L. Holmen, N.E. Sharpless, R.S. Lo
Analysis and interpretation of data (e.g., statistical analysis, bio-statistics, computational analysis): A. Hong, G. Moriceau, L. Sun, S. Lomeli, M. Piva, N.E. Sharpless, W. Hugo, R.S. Lo
Writing, review, and/or revision of the manuscript: A. Hong, G. Moriceau, L. Sun, S. Lomeli, M. Piva, N.E. Sharpless, W. Hugo, R.S. Lo
Administrative, technical, or material support (i.e., reporting or organizing data, constructing databases): A. Hong, L. Sun, W. Hugo, R.S. Lo
Study supervision: R.S. Lo