CHILDREN’S SOCIAL COMPETENCE ACROSS THE TRANSTION TO KINDERGARTEN: A LATENT GROWTH CURVE ANALYSIS
Adam Holland
A dissertation submitted to the faculty of the University of North Carolina at Chapel Hill in partial fulfillment of the requirements for the degree of Doctor of Philosophy in the
School of Education.
Chapel Hill 2013
Approved by: Rebecca New Sharon Ritchie
Lynne Vernon-Feagans Jeffrey Greene
ABSTRACT
ADAM HOLLAND: Children’s Social Competence across the Transition to Kindergarten: A Latent Growth Curve Analysis
(Under the direction of Rebecca New)
This research examined children’s social competence trajectories across the transition to kindergarten for three racial groups using a sample of children in the National Center for Early Development and Learning’s Multi-State Study of Pre-Kindergarten. The analytic sample contained 939 children attending public kindergarten programs in six states, with data collected in both the children’s pre-kindergarten and pre-kindergarten years.
Children’s social competence was modeled as a function of an underlying
trajectory, defined by initial status at pre-kindergarten entry but not a linear or non-linear slope. Poverty status, gender, and math achievement were used to predict trajectory intercepts while classroom emotional climate, teacher race, and teacher experience were used to explain deviations from anticipated trajectories. Model parameters were
TABLE OF CONTENTS
LIST OF TABLES………vii
LIST OF FIGURES……….viii
Chapter I. STATEMENT OF THE PROBLEM………. ….…1
Purpose and Significance……….3
II. LITERATURE REVIEW………....5
Developmental Systems………...5
The Transition to Formal Schooling………....9
Social Competence………...11
Factors Relating to Social Competence………...13
Social Competence across the Transition to Kindergarten: Rationale and Benefits……….………..22
Study Hypotheses………...………23
III. METHODS………26
NCEDL Study………26
Instrumentation………...………...28
Analytic Method………32
Descriptive Statistics……….38
Longitudinal Invariance……….39
Unconditional Models………..…..40
Exploratory Model and Cross-Validation...………...41
Multiple Group Model………...……42
V. DISCUSSION………46
Social Competence Trajectories………47
Factors Associated with Children’s Social Competence Trajectories...49
Limitations………...…….56
Conclusion……….58
REFERENCES………..70
LIST OF TABLES
Table
LIST OF FIGURES
Figure
1. Unconditional linear model………..………65
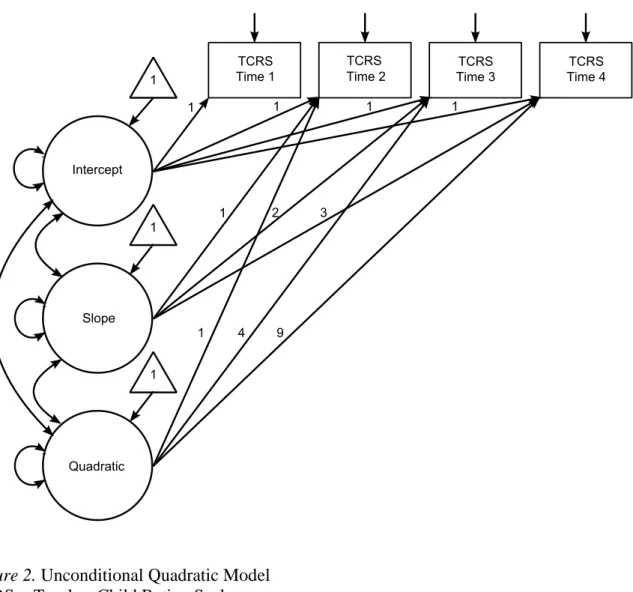
2. Unconditional quadratic model………66
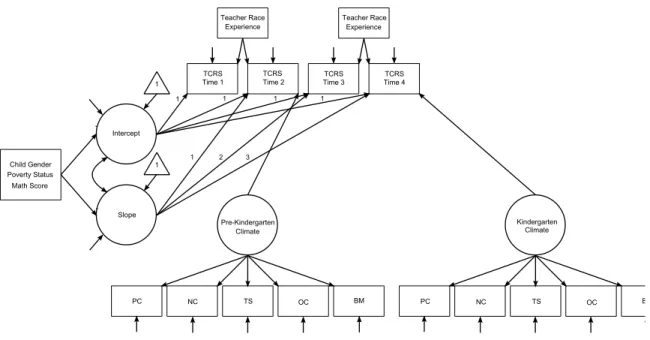
3. Conditional intercept-only model………67
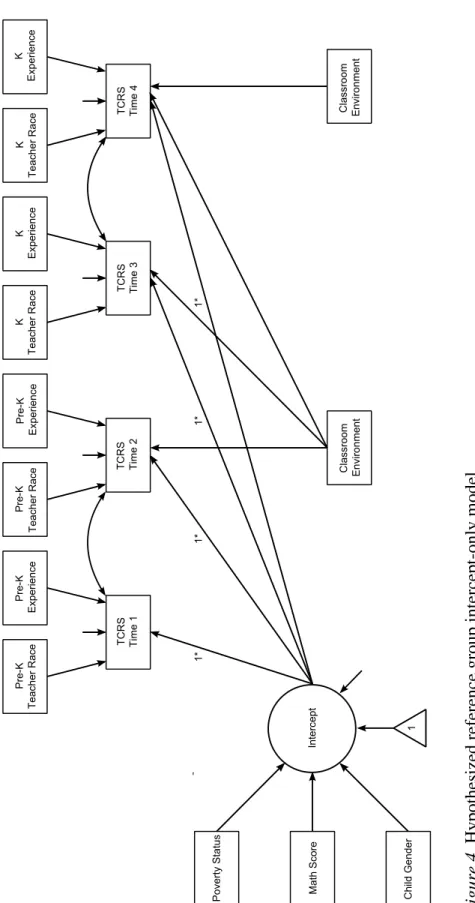
4. Hypothesized reference group intercept-only model………...68
Chapter One: Statement of the Problem
Since the Coleman report drew attention to racial differences in student academic outcomes in the United States, the achievement gap between white students and their minority counterparts has raised concerns from policy makers, educators, and researchers (Coleman et al., 1966; Lee, 2002; National Center for Educational Statistics, 1995). This achievement gap has been argued by many to have lifetime consequences, limiting opportunities for minority students as they seek employment, higher earnings, or to enroll in higher education (Lee, 2002; Murname & Levy, 1996; Ogbu, 1994). Although the gap has narrowed considerably between 1971 and 2007, there continues to be a wide
discrepancy between racial groups overall, with recent trends suggesting that progress on closing the gap has stalled or slowed (Lee, 2002; Hemphill, Vanneman, & Rahman, 2011; Vanneman, Hamilton, Anderson, & Rahman, 2009).
widening class gap that further threatens American ideals of social equity and mobility (Putnam, Frederick, & Snellman, 2012; Reardon, 2011).
Although researchers have sought for decades to better understand the
achievement gap, recent availability of large, nationally representative data sets and more sophisticated analytic techniques have allowed investigators to gain a more nuanced understanding of the factors that relate to it. In one such study, Phillips, Brooks-Gunn, Duncan, Klebanov, and Crane (1998) examined the gap by including in their analysis a number of correlates shown by past studies to relate to the achievement gap. They found that variables relating to family background and socioeconomic status (SES), in
combination, explain roughly two thirds of the achievement gap in young children, but still leaving a full third of the variance in scores unaccounted for. Building upon this and similar findings, subsequent studies (e.g., Krueger, Rothstein, and Turner; 2006) have suggested that much of the remaining variance may be explained by de facto segregation of schools, which causes black and Latino children to attend lower quality schools than their white counterparts.
poor social skills lead to increased aggressive behavior which often results in conflict with teachers; in turn leading to decreased engagement on the part of the child in academic tasks (Stipek & Miles, 2008). However, this explanation simplifies what is likely a more complex, reciprocal interaction between social skills and academic achievement, wherein low academic achievement may also negatively influence engagement, thereby leading to further increases in externalizing behaviors (Hinshaw, 1992). With recent research highlighting the critical nature of what is conceptualized as social competence in influencing children’s academic trajectories and schooling
experiences, any comprehensive understanding of the achievement gap also requires a better understanding of children’s social competence as it changes over time.
Purpose and Significance
In this study, I examined the concept of social competence during children’s transition to kindergarten. Social competence is poorly represented in the achievement gap literature in spite of the fact that the transition marks a time when children are being socialized to the demands and opportunities of formal schooling. Although many researchers have examined how children’s environments prior to the transition relate to children’s social skills (e.g., Mashburn et al., 2008), very little attention has been paid to the dynamic interactions between children and the unique classroom ecologies across the entire transition in relation to children’s social-emotional development and their teachers’
interpretations of their social competence. Without this knowledge, those working to reform children’s schooling experiences are working against the odds in their efforts to reduce the achievement gap. This study employs a contextual theory of child
Chapter Two: Literature Review
Developmental Systems Theory serves as the conceptual framework for this study on social competence and children’s successful transitions to and beyond kindergarten. Several bodies of scholarship inform this study, including developmental and educational research on transitions, particularly the transition to formal schooling, social competence, race and poverty, academic achievement, and the classroom emotional climate.
Developmental Systems
Developmental Systems Theory (Ford & Lerner, 1992; Sameroff, 1983; Sameroff, 2010) posits that a dynamic interplay between individuals and their situated context drives development across the lifespan. That is, it is not only children and their environments themselves but also how the two interact and influence one another that drives children’s development. This theory suggests that children will be differentially influenced by environments based on how their individual differences allow them to elicit and benefit from different things in their settings (Sameroff & Fiese, 2000). Synergies promoting positive development may be conferred to those children whose assets allow them to take greater advantage of environmental offerings while synergies restraining positive development may befall those whose assets leave them ill-equipped to benefit from positive environmental factors.
1996). Over time, such systems come to include structures and processes that work together, forming correlated constraints that place children on stable developmental trajectories (Magnusson & Cairns, 1996). When consisting largely of factors that
positively influence development, such correlated constraints may place children on more stable, adaptive developmental trajectories. On the other hand, when such a system consists largely of factors that negatively affect development; children are more likely to be placed on trajectories typified by problematic patterns of adjustment (Cairns & Cairns, 1994; Farmer & Farmer, 2001). Because correlated constraints tend to produce stable trajectories, altering children’s trajectories may require that a number of negative factors be improved upon in order to facilitate a lasting change in children’s adaptive behavior and cognitions. This poses a challenge to those seeking to intervene for the purpose of promoting children’s social competence, as multiple ecological factors may need to be altered in order to positively affect children’s developmental and academic trajectories.
disturbances in trajectories across a broad range of developmental domains
(Bronfenbrenner & Evans, 2001; Seidman, 1988). The disruption of a wide variety of factors within a child’s environments provides those interested in intervention an opportunity to radically change children’s developmental trajectories. As many
environmental factors change, children’s systems are re-organized, potentiating a positive deflection in their developmental trajectories (Cairns & Cairns, 1994).
In order to intervene, though, stakeholders must first understand the manner in which critical factors affect and relate to one another during these transition periods. Pianta, Rimm-Kaufman, and Cox (1999) note that as systems become re-organized, new competencies may emerge, creating qualitative change for the child. In some cases, competencies which served to help a child succeed in the old ecology become valueless in the new one. Other times, skills and perspectives that provided little value before a transition allow children to blossom in new situations. For example, a child who previously experienced significant gross motor development in the fourth year of life where he spent much of the day playing outside, may be constrained developmentally in this area when recess is limited to 30 minutes or less per day. That same child’s self-regulatory skills may develop significantly after the transition, as he is called to sit quietly in class for longer periods of time. Conversely, the child may resist or have difficulty adapting to the new, more sedentary environment. This example serves to highlight the nature of the environment in promoting or hindering children’s
competencies and in distinguishing between those competencies that are valued and those that are not. This fit (or lack of fit) between children’s abilities and those deemed
values particular to that ecology serve to privilege some students and their ways of behaving and learning over others. Such a concept is similar to goodness of fit issues explored by researchers concerned with attachment and temperament, constructs that serve as precursors to social competence (Thomas & Chess, 1977; Crockenberg, 1981). In this case, because the dominant white, middle class culture of U.S. schools is often at odds with the funds of knowledge that accompany increasingly diverse populations of children. As a result of narrow and ethnocentric interpretations of competence, minority children – and especially black and Latino children, may be at a disadvantage, with their own social capital, skills, and prior knowledge ignored or undervalued (Moll, Amanti, Neff, & Gonzalez, 1992; Valenzuela, 1999; Vernon-Feagans, 1996). Teachers’
interpretations of developmentally appropriate practice may be similarly out of sync with children’s home routines, thus setting up a cycle of failure for the child (Mallory & New, 1994) in spite of continued efforts to make the concept more inclusive of cultural and sub-cultural differences (Bredekamp & Copple, 1997; Copple & Bredekamp, 2009).
Given the exceptionally broad range of child-care arrangements currently utilized in the United States (Morissey, 2009), the transition to formal schooling is not the first educational transition for most children. However, it is significant as it marks children’s first entrance into an ecology which they will likely inhabit for the subsequent 11 to 13 years of their lives. The ecology of formal schooling, beginning in kindergarten, is markedly different from homes and pre-school settings due to its intentionality and focus on academic learning (Rimm-Kaufman & Pianta, 2000). As with most ecological
transitions, the transition to formal schooling requires children to rapidly adapt to
Dunning, & Dodge, 2011). Sometimes the abruptness of such transitions is further exacerbated by the radically different nature of classrooms on each side of the transition (Preschool Curriculum Evaluation Research Consortium, 2008). Children’s abilities to adapt to this change in priorities will influence their schooling careers, which will in turn affect their school achievement and its subsequent life-long consequences.
The Transition to Formal Schooling
For most of the 20th century, the kindergarten was where children were socialized for formal schooling, beginning in the first grade. However, kindergarten has become increasingly academic in its own right due to new understandings of children’s early learning potentials accompanied by a persistent curriculum pushdown (Bowman,
Donovan, & Burns, 2000; New, 2003). As of 2011, approximately 74% of four year-olds were enrolled in some form of pre-kindergarten, the highest percentage of any year to date (Barnett, Carolan, Fitzgerald, & Squires, 2011). Acknowledging the growing importance of pre-kindergarten as a site for children’s early learning and school readiness, the President, in his 2013 State of the Union Address, has advocated for universal preschool as it prepares children for formal schooling. Currently, then, the pre-kindergarten classroom has become the site for readiness activities and the transition demands have shifted to those associated with entering the kindergarten (Graue, 2011). A growing body of research highlights the importance of this ecological shift to
children’s subsequent school experiences.
Those children whose transitions to kindergarten are positive tend to excel
that accompany the shift to formal schooling, have better relationships with their peers and teachers, demonstrate greater academic achievement, and are happier with school in general. These early successes, in turn, provide children with the necessary tools to succeed in later years of schooling (Gutman, Sameroff, & Cole, 2003).
argument that children’s levels of development and competence at the transition often form the basis for the system’s subsequent stratification of children which, in turn, influences their long-term school trajectories.
Social Competence
Wherever it occurs, schooling is inherently a social activity, wherein children participate in groups within confined settings that include peers, guided by a central adult or adults. In the United States, the typical arrangement for young children includes a classroom setting designed for specific age-graded populations within larger contexts that are also age specific (e.g., infant/toddler centers, pre-schools, elementary schools). Thus, the concept of readiness is also age- or grade-level specific, such that toddlers are
increasingly expected to be toilet trained, preschoolers must be capable of an array of self-help skills, and kindergarten expectations include more than pre-academic skills. Research on children’s successful transitions to kindergarten, increasingly interpreted as the first year of elementary school, points to the critical importance of an array of social and emotional skills deemed necessary to succeed in a formal schooling environment (Duncan et al., 2007). Although expectations related to readiness were once largely contextualized by the local community and school (Graue, 1992), an increased focus on literacy and math outcomes at the national level has caused greater homogenization of school readiness expectations (Graue, 2011). Research on topics such as self-regulation and executive functioning has added to the expectations associated with children’s transitions to formal schooling (Blair & Diamond, 2008).
competence. Ladd, Birch, and Buhs (1999), on the other hand, have shown that there is significant variability in the socioemotional skill levels children bring with them as they transition to kindergarten. Because of the social nature of the educational system, children with more well-developed social and emotional skills possess a distinct
advantage as they transition over those whose social and emotional skills are less mature (McClelland, Acock, & Morrison, 2006; Raver & Knitzer, 2002). That is, children who are able to effectively regulate their emotions stand to experience more positive social relationships with their peers as they are able to inhibit negative emotional outbursts while more effectively recognizing and appropriately responding to the emotions of others (Blair, 2002). Possessing such characteristics makes students more desirable to their peers as playmates while lacking such skills leads students to be rejected.
more positive peer relationships, successful child-teacher relationships, and higher levels of achievement than their peers for whom social competence is rated lower. These assets lead to children benefiting more from their transactions with others in the environment, thereby facilitating greater success in school (Pianta & Stuhlman, 2004).
Factors Relating to Social Competence
Gender. Although biological development plays some independent role in dictating children’s social competence trajectories, its effects are also moderated and mediated by the ecology in which the child develops (Sameroff, 2010). In few instances is this premise as evident as when researchers examine the role of gender in social competence. Disentangling the effects of biological and sociological gender differences is nearly impossible, but it remains clear that sex affects children’s social competence beginning at an early age (Geary, Byrd-Craven, Hoard, Vigil, & Numtee, 2003).
Race and Poverty. In the context of the United States, black and Latino children experience the burden of poverty at a much higher rate than their white counterparts, putting them at risk for a wide variety of problems in school (McLoyd, 1990). Because of this, race and poverty are often conflated in research dealing with young children’s social competence. While much recent research continues to highlight their combined contributions, some is focused on disentangling the effects of one from another.
In general, research on children from poverty has documented lower levels of social competence in the classroom than their middle and upper class peers (Zill, Moore, Smith, Stief, & Coiro, 1991). Just as correlated constraints tend to limit the cognitive growth trajectories of these children, so too do they limit their social-emotional growth. Low maternal education, lack of adequate nutrition, exposure to dangerous
neighborhoods, familial instability, and variable parent status all predict social adjustment issues, particularly when such risk factors accumulate in high numbers concurrently (Ackerman, Kogos, Youngstrom, Schoff, & Izard, 1999).
Each of these risk factors point to processes that serve to inhibit healthy development. In some cases, these factors directly affect the child. For example, inadequate access to food can serve to inhibit healthy brain development (Monckeberg, 1992). In other cases, risk factors may affect individuals surrounding the child in negative ways, leading to behaviors on their part which serve to negatively affect the child’s development. For example, poverty and economic loss often lead to
With respect to poverty’s relationship with ratings of social competence, the direction of effects is confounded by other factors. Although poverty tends to be negatively associated with ratings of children’s social competence in the classroom, research conducted over the last decade suggests that its influence may be different for individuals of different races. Black families, for example, in addition to being more likely to face poverty, are also more likely to face racial discrimination while seeking employment, more extensive segregation into poorer neighborhoods, and lower access to both monetary and social capital (Duncan & Aber, 1997; McLoyd, 1990; Murry, Smith, & Hill, 2001; Spalter-Roth & Deitch, 1999; Wilson, Tienda, & Wu, 1995). These factors could serve to further increase the negative effects of poverty beyond those experienced by a white family. On the other hand, a number of studies suggest that families of color draw support from their cultural and ethnic communities in ways substantially different from how white families seek support when entrenched in poverty (Garcia Coll et al., 1996; McLoyd, 1998). Such support structures could moderate the effects of poverty on children’s social competence.
associated with decreased levels of positive parenting behavior which in turn predicted lower levels of children’s social competence. However, some of the individual paths within the model showed significant differences between groups. For example, although positive parenting behaviors predicted higher levels of social competence for all groups, the relationship was stronger for white families than for black or Hispanic families. Additionally, material hardship was more highly associated with increased parent stress in white and black families than in Hispanic families. Together, these differences suggest that race may serve as a protective factor, particularly for Hispanic children, as material hardship among Hispanic families carries a weaker association with stress and resulting reductions in positive parenting behavior have less of an association with decreased social competence.
Although Raver and colleagues (2007) found that being Hispanic or black may moderate the effects of poverty in a positive way with regard to social competence, other studies suggest that the opposite may be true. Shanahan, Davey, and Brooks (1998), for example, have found that Hispanic boys are particularly at risk for developing
internalizing and externalizing behaviors when they live in prolonged periods of poverty at an early age. Additionally, Kalil and DeLeire (2002) found that a father’s job loss was more negatively related to measures of school engagement and achievement among black youths than among white. Studies by Guttman and Eccles (1999) and Mistry and
nature of the relationship between poverty and race shifts for children as they develop from young children into adolescence. Also, the methodology utilized in these studies involves varying degrees of sophistication. Because the study by Raver and colleagues (2007) involves the use of a multivariate approach with a large, nationally representative sample, it may provide more accurate information than studies that rely on a large number of linear regressions with smaller samples.
Academic achievement. Academic achievement is known to correlate strongly with teacher ratings of social competence (Miles & Stipek, 2006; Ray & Elliott, 2006). The nature of the relationship between the two, however, is complicated. Largely,
studies utilize social competence as a predictor of academic achievement. However, other studies suggest that academic achievement may predict social competence. Very few studies have used an experimental design that would permit strong causal inferences. One study by Coie and Krehbiel (1984) provides some evidence of a causal effect. Specifically, improving students’ social skills served to improve their reading
comprehension. This study, though, had a small sample size and failed to control for the amount of time tutors spent with children, leaving some doubt as to the generalizability of the findings.
In more recent research, there is evidence for effects moving both ways, possibly suggesting a dynamic relationship between social competence and academic
poor relationships with school adults, which in turn leads to disengagement from academic work (Arnold, 1997; Chen, Rubin, & Li, 1997). Hinshaw (1992), reviewing work in the field, has found evidence to support this prediction, showing that aggressive behavior early in elementary school predicts poor literacy in later elementary or middle school. Studies focusing on work-related skills also point toward the possibility that this type of social skill influences early academic achievement by promoting children’s ability to profitably engage in self-regulated learning (Cooper & Farran, 1988; McClelland et al., 2000).
On the other hand, theories suggesting that academic achievement affects social competence posit that struggling in school leads to frustration, which in turn leads to lower pro-social behavior and increased aggression. Miles and Stipek (2006) examined associations between aggression, pro-social behavior, and literacy achievement in children over the course of their elementary school years in order to provide evidence regarding the direction of the relationship. They found significant concurrent
associations between aggression and literacy achievement as well as between social competence and literacy achievement at all time points when data were collected. The association between social competence and literacy achievement was strongest in children’s early years in school but waned later. Further comparison of competing models suggested that it was poor literacy achievement in early years that led to higher aggression rather than the opposite.
While the relationship between literacy achievement and social competence has a fairly strong research base, research examining the relationship between math
concerning older children as well as math achievement and related constructs such as work-related skills and self-regulation/executive function may inform an understanding of the relationship between social competence and math achievement. For example, a study by Welsh, Parke, Widaman, and O’Neil (2001) focusing on children in grades one through five suggested that a reciprocal relationship exists between academic
achievement as measured by both literacy and math scores and social competence. A study by McClelland, Acock, and Morrioson (2006) also showed that early learning-related skills were learning-related to children’s later math achievement trajectories. Finally, another study by McClelland and colleagues (2007) showed strong links between children’s behavioral regulation and math skills, suggesting that the constructs are even more related than behavioral regulation and literacy achievement. It is possible that there is a causal relationship between math and various aspects of social competence. It is also possible that there is a single construct underlying success in both these areas (e.g., executive functioning).
Collectively, the findings from these studies suggest that the relationship between social competence and academic achievement is neither uni-directional nor static. It appears that early social competence and lack of aggression predict later academic success while a lack of early academic success may lead to increased aggression later. There is also likely to be a reciprocal relationship between the two as Wentzel (1991) has implicated social competence in middle school as a predictor of later academic
scholarship converge on the premise that children’s social competence at school entry plays a critical role in contributing to children’s subsequent academic trajectories.
Classroom emotional climate. As the importance of social competence has become more recognized in the field, professionals and researchers have sought to improve children’s social competence through classroom practices. Unfortunately, positively affecting children’s social competence prior to the transition has proven more elusive than promoting their academic development. For example, the randomized Head Start Impact Study recently found that Head Start programs failed to impact children’s social skills and social competence (Administration for Children & Families, 2005). Classroom approaches to affecting children’s social competence often occur in one of two ways: through explicit interventions or through the classroom environment as a whole. There is mixed evidence with regard to both types of efforts to improve
children’s social competence prior to their enrollment in kindergarten. For example, the Stars program, an explicit intervention which focuses on behavioral and social behaviors during the summer prior to kindergarten, has been shown to significantly improve girls’ transitions to kindergarten as reported by their teachers but not boys’ (Berlin et al., 2011). The Getting Ready intervention, which focuses on working with parents among
Studies examining the effects of overall classroom environments on children’s social and emotional development show mixed results as well. Mashburn and colleagues (2008), using data from two NCEDL studies, found that a positive emotional climate in preschool predicted greater social competence for children but also an increased number of problem behaviors at the end of pre-kindergarten. Burchinal and colleagues (2008) found similar results when examining the effects of pre-kindergarten climates on
children’s attributes at the end of kindergarten. Peisner-Feinberg and colleagues (2001) found that children’s relationships with their preschool teachers predicted higher levels of sociability and fewer behavior problems over time with the effect tapering off as children grew older. Within that study, maternal education also appeared to moderate the
relationship such that behavior problems tended to decrease for children whose mothers had completed college, regardless of initial closeness scores, while the trajectory for behavior problems remained stable for children whose mothers had only completed high school. This finding suggests that, as previously posited, children from lower SES families carry higher risk for social difficulties, particularly when their relationships with teachers are poorer.
In elementary classrooms, Wilson, Pianta, and Stuhlman (2007) analyzed not only whether classroom climate affected children’s social competence but also which
classrooms did not appear to improve social competence more for children who were at risk for academic failure as the authors had predicted.
Examined together, these findings suggest that there is a small positive effect on children’s social competence when they are in an emotionally supportive environment. Effect sizes appear to be larger in preschool than in elementary school classrooms. However, in nearly all the studies examined, some children benefited from positive classroom environments more than others. The mixed findings in some of these studies show the clear need for more research in this area.
Social Competence across the Transition to Kindergarten: Rationale and Benefits Developmental Systems Theory (Ford & Lerner, 1992; Sameroff, 1983; Sameroff, 2010) provides a broad theoretical framework for this study of children’s social
competence trajectories in the pre-kindergarten and kindergarten years. Within this framework, transitions may prove especially advantageous times during which to alter children’s developmental trajectories (Cairns & Cairns, 1994; Seidman & French, 2004). While a majority of studies have focused on the contributions of child characteristics and classroom processes prior to the transition to children’s development following the move into formal schooling, there is ample support and need for more focused attention to schooling immediately following the transition as a potential influence on those same outcomes.
This exploratory study was motivated by the goal of gaining a better
achievement) relate to children’s changing social competence over time as well as how the time-variant factor of the classroom emotional climate perturbs such trajectories in both preschool and kindergarten. The multi-group analysis examined whether these trajectories remain the same and whether variables maintain similar relationships for children on each side of the achievement gap (i.e., black and Latino children versus white children).
Study Hypotheses
Based on the prior review of the literature, this study tests the following hypotheses.
Hypothesis 1. A synthesis of research on the dynamic and developmental natures of children’s social competence over time and in the diverse contexts in relation to
transitions, classroom environments, and academic achievement warrants the hypothesis that the final reference model will adequately fit the data in this sample. That is, the model will correctly specify all the important relationships within the data, thereby permitting confidence in the resulting parameters.
Hypothesis 2. Research concerning the moderating effects of race on the
associations between poverty and gender as well as between the starting points and trajectories.
Hypothesis 3. Far too much literature has confirmed the negative consequences of poverty on children’s early development and subsequent school achievement. This literature supports the hypothesis that lower income (i.e., greater poverty) in the households of children in this study will be negatively associated with both the initial status and rate of growth for children’s social competence trajectories.
Hypothesis 4. Research on the relationship between gender and social
competence (e.g., Geary et al., 2003) supports the hypothesis that males will be rated by their teachers as possessing lower initial status and less positive growth with regard to their social development trajectories when compared to females.
Hypothesis 5. Literature regarding the nature of the relationship between math achievement and social competence is less clear for children of this age. However, sufficient new research exists on the relationship between learning-related skills and math (e.g., McClelland, Acock, and Morrison; 2006) to support the hypothesis that math achievement will be positively associated with both children’s initial status and their social competence trajectories.
Chapter Three: Methods
Developmental Systems Theory posits that children develop along trajectories in multiple domains. In this dissertation, children’s social competence is framed as a process rather than merely as an incremental change from one time point to a second. Prior literature on children’s development suggests that multiple factors affect this process as it unfolds over time. Because of the nature of this analysis, a large, diverse sample is needed. Such a sample is available in the Multi-State Study of
Pre-Kindergarten (Early et al., 2005). NCEDL Study
Data for this dissertation come from a large-scale study on the characteristics of pre-kindergarten conducted by the National Center for Early Development and Learning (NCEDL) from 2001-2003. The NCEDL Multi-State Study of Pre-Kindergarten
examined the kindergarten experiences of children in publicly funded
Although the pre-kindergarten data from this study have been extensively examined and written about, the kindergarten data have received little attention in the literature.
In the original study, a multi-stage stratified random sampling procedure was used to recruit individuals. Prior to the fall of 2001, the researchers selected 40 sites at
random from each state using a list provided by each state’s department of education. In Georgia, Illinois, Kentucky, and Ohio, sites were selected from the entire state. In California and New York, due to the size of these states, specific regions were selected for participation. In California, 20 sites were selected from the greater Los Angeles area and 20 sites were selected from the Central Valley region. In New York, 20 sites were selected from the New York City area with the other 20 being selected from within a 50-mile radius of Albany.
Approximately 77% of eligible programs that were initially contacted agreed to participate in the study. When programs declined to participate, researchers replaced them with another randomly selected program when possible. In total, 238 sites
first classroom observation. In total, 939 children participated in the study during the initial year of data collection.
In addition to understanding children’s experiences in pre-kindergarten, researchers were also interested in how children participating in state-funded pre-kindergarten performed in pre-kindergarten. Therefore, this study also includes data collected on the same children during their kindergarten year. Due to attrition, 882 children nested in 747 kindergarten classrooms participated in this portion of the study. The demographic characteristics of the children and classrooms participating in the sample may be found in Tables 1 and 2, respectively. It should be noted that this sample is meant to generalize to students participating in publicly funded pre-kindergarten programs in the study states rather than all children. Demographic characteristics highlight differences between these two populations (e.g., a higher incidence of children living in poverty).
Instrumentation
kindergarten. Child assessments were conducted in the fall of the pre-kindergarten year. Classroom observations were conducted twice during the pre-kindergarten year and three times during the kindergarten year with scores being averaged across observations to formulate an individual classroom’s score.
Teacher-Child Rating Scale (TCRS). The TCRS (Hightower et al., 1986) provided scale scores of teachers’ perceptions of children’s social and behavioral problems. For this dissertation, only the Social Competence scale was of interest.
Employing Rose-Krasnor’s (1997) broad definition of social competence, the construct is defined as effectiveness in interaction with others resulting from a system of organized behaviors that serve to meet individuals’ short- and long-term needs. This scale included 20 items measuring assertiveness, frustration tolerance, task orientation, and peer social skills. For each of the items, teachers rated children on a scale from one to five,
indicating how well statements describe the child. Final scores on the scale consisted of the average of sub-scale scores. Internal consistency for the scale was high (α = .94 in the spring of pre-kindergarten). Data were collected using the TCRS in both the fall and the spring of each year. Scores from the fall and spring of both pre-kindergarten and kindergarten were used in this study. To address concerns of rater bias (c.f., Wigelsworth et al., 2010), teacher race and experience were included in the model as control variables.
students whose primary language is English may be of interest, the sample size did not permit such groups to be formed while maintaining enough power to detect meaningful differences between the groups.
Parents reported family income as belonging within one of a number of ordered categories. The original study researchers then converted this information to a binary variable indicating whether a family’s income fell above or below 150% of the Federal poverty line at the time of the study. This binary variable was used in this study to indicate children’s poverty status.
Finally, child gender was also reported by the parents at the beginning of the study. Each of these variables, including poverty, was treated as time-invariant. Preliminary analyses suggested that, for families in this data set, poverty status was largely stable. Using it as a time-invariant variable allows for an analysis of the degree to which time moderates its effects over the transition to kindergarten.
Woodcock-Johnson III Tests of Achievement: Applied Problems Subtest. In the NCEDL study, a number of instruments were used as measures of student
achievement. For this study, I selected the applied problems subtest from the Woodcock-Johnson III Tests of Achievement (Woodcock, McGrew, & Mather, 2001). The applied problems subtest is part of a battery of measures, administered by trained data collectors, that examines the child’s ability to analyze and solve math problems. The full battery took between 45 minutes and an hour to administer and took place during the school day outside the classroom. In order to ensure that the battery was correctly administered, data collectors submitted tapes of themselves conducting the assessments to a study
should be noted that only students deemed proficient in English by their scores on the PreLAS completed this assessment. Although Spanish-speaking students also completed a Spanish version of the measure, the scores were not deemed valid by original study authors (D. Early, personal communication, October, 2012).
I selected this measure over other, similar measures in the study for a two reasons. First, the measure itself has been thoroughly examined by experts to establish that the scores it provides are valid and reliable for making inferences regarding student achievement. Second, scores on this measure are standardized and, unlike scores on some other measures administered through this project, approximate a normal distribution in this sample.
Classroom Assessment Scoring System (CLASS). The emotional climate of the classroom was measured using the CLASS (La Paro, Pianta, Hamre, & Stuhlman, 2002), an observational measure that focuses on interactions. Data collectors using this
instrument were trained during the summer prior to the beginning of the study using both videos and live classroom visits. Inter-rater agreement for the CLASS was derived by comparing data collectors’ coding of video tapes with gold standard coders’ results. CLASS data collectors were initially tested prior to the pkindergarten year and re-certified prior to collection in kindergarten classes. During the re-certification phase, data collectors’ mean weighted kappa was .60 (SD = .06) on their final test. On average, 86% of data collector responses were exactly the same or within one point of matching gold-standard collectors’ responses.
only on the five dimensions measuring the emotional climate factor: positive climate, negative climate, teacher sensitivity, overcontrol, and behavior management. Positive Climate examines the enthusiasm and enjoyment teachers communicate to students about learning as well as the respect shown to children. Negative Climate reflects the degree to which a classroom has negative socioemotional tone and is indicated by aggression, frustration, harshness, and displays of anger. Teacher Sensitivity focuses on teachers’ provision of reassurance, encouragement, and comfort to students. Overcontrol focuses on the degree to which teachers infringe upon students’ autonomy in the classroom. Finally, behavior management concerns the degree to which teachers set clear, reasonable expectations for their students’ behavior and consistently enforce those standards.
Negative climate and overcontrol were reverse scored. Coefficient alphas for all dimensions were fairly high (positive climate α = .77; negative climate α = .80; teacher sensitivity α = .78; overcontrol α = .90; behavior management α = .78). Overall domain internal consistency was also high (α = .84).
An average of the scores on these five dimensions across all observations in pre-kindergarten and pre-kindergarten were used to define two latent variables in accordance with the CLASS’s structure at the time of the study: pre-kindergarten emotional climate and kindergarten emotional climate. Because the same measure was used to define the latent variable at two different time points, I tested the CLASS for longitudinal invariance prior to fitting the latent curve model.
Analytic Method
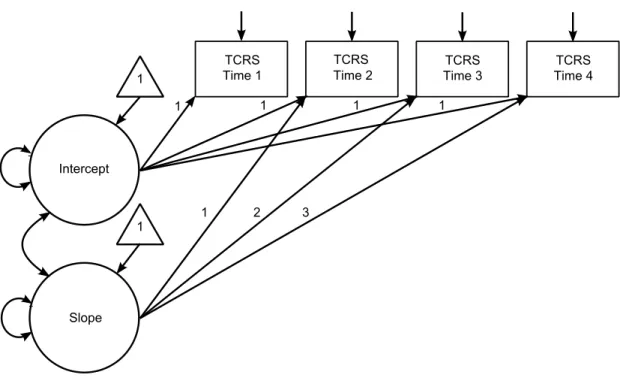
social competence scores as a trajectory over time, incorporate both latent and manifest variables, and to test the equivalence of models across groups (Curran & Hussong, 2003). Using LCM, the patterns of scores across the sample allow an underlying pattern of change may be inferred. Since this pattern is unobserved, it is a latent trajectory. This latent trajectory is described by multiple latent variables. The intercept factor represents the starting point for the trajectory while the slope factor represents the direction as well as the rate at which change occurs across time points. An additional quadratic factor may also be added should a curvilinear trajectory exist. Individuals’ social competence
trajectories are modeled as a function of the average intercept and slope for the sample plus a residual which represents that individuals’ deviation from the average trajectory. The variance of individual differences in trajectories is of interest as it indicates the degree to which individuals differ with regard to their development.
Assumptions and issues. Like all statistical analyses, LCM produces valid results only when researchers make certain assumptions regarding the data they use. For example, default SEM procedures assume that manifest variables follow normal
distributions (Bowen & Guo, 2012). In order to assess the degree to which this
assumption holds true, all manifest variables were visually inspected using histograms. Additionally, Bollen (1989) recommends examining data for influential outliers prior to conducting analyses. Such cases may lead to inadmissible solutions (Chen, Bollen, Paxton, Curran, & Kirby, 2001) or cause other issues with regard to estimation and interpretation. Therefore, stem and leaf plots of univariate distributions and scatterplots of bivariate distributions were also visually inspected. Outliers were handled on a case-by-case basis. All descriptive statistics were calculated using SAS Version 9.2 (Sas Institute, Cary, NC).
Default SEM procedures also assume independence of residuals. However, because children are clustered in classrooms, particularly in the pre-kindergarten year, these data violate this assumption. In order to account for the effects of this violation, though, I used robust standard errors that allow for correct inferences, accounting for the dependency in the data.
estimation (FIML), allow researchers to more accurately model data while maintaining optimal type I error rates (Enders & Bandalos, 2001). Although the possibility exists that some of the data in this study are MNAR, adapting the model to account for this
possibility would involve adding significant complexity to an already complex model. In order to maintain parsimony, I proceeded on the assumption that a majority of the data were MAR, allowing for the use of FIML to estimate the models using all available information in the data matrix.
Because teacher race and experience introduce known bias into the scores on the TCRS, it is important to control for these variables in the analysis. Teachers disclosed their race and experience as part of a questionnaire administered at the beginning of the pre-kindergarten and kindergarten years. In order to maintain parsimony, the race variable was converted to one with three values: black, white, and other.
invariance was tested by fixing factor loadings and item intercepts to be equal across groups. Each model was compared to one in which both groups’ models are freely estimated using the Satorra-Bentler scaled chi-square difference test statistic (Satorra & Bentler, 2001). Partial strong factorial invariance, a situation in which some loadings and intercepts were required to be equivalent while others were freely estimated, was also considered. For all models, the factor loading and intercept for the Positive Climate
indicator were fixed to zero and one, respectively, for the purpose of model identification. The next step in the analysis was to fit unconditional models to the reference group data in order to determine the shape of the growth curve. In this study, the
reference group consisted of white children as this group contained the largest portion of the sample. Figure 1 shows the hypothesized unconditional linear model while Figure 2 shows the hypothesized unconditional quadratic model. A simpler, intercept-only model was also tested. Because these models are nested and estimated using robust maximum likelihood, Satorra-Bentler scaled chi square difference testing was used to compare the simpler intercept-only model to the more complex linear and quadratic models (Satorra & Bentler, 2001). Results of this test were used to aid in my decision regarding whether or not to retain the linear and quadratic terms.
cross-validated using the remainder of the reference sample. This model describes the relationships between the time-invariant and time-variant covariates and children’s social competence trajectories for children in the reference group.
The final step was to fit the cross-validated conditional model from step three to the other two groups as well. In order to do this, all parameters within the model (variances, covariances, and means) with the exception of the residuals of the social competence measure were forced to be equal between the groups. This model was then compared to a less parsimonious model in which terms were not constrained to equality. Satorra-Bentler chi-square difference testing allowed for conclusions to be drawn
regarding the similarity or differences between the groups with regard to children’s social competence and how it relates to other variables within the model. All covariance
structure modeling was conducted using Mplus Version 6.1 (Muthén & Muthén, 2007). Reports of model fit follow guidelines outlined by MacCallum and Austin (2000) and Hu and Bentler (1999) while effect sizes for path coefficients are reported as partial
Chapter Four: Results
This chapter presents the results of this study in six sections based upon the plan of analysis: descriptive statistics, establishing longitudinal invariance, fitting
unconditional models for the reference group, exploratory modeling with a smaller sample and cross-validation of the exploratory model, and comparing multi-group models.
Descriptive Statistics
full information maximum likelihood estimation, this should not be a concern (Yuan & Bentler, 2000). Stem and leaf plots confirmed the non-normal nature of these four
variables but also suggested that there were no severe outliers on the continuous variables in this sample. Bivariate plots showed some small outliers but none major enough to warrant removal of a data point.
Examination of descriptive statistics suggests that, overall, children in this sample’s social competence scores were slightly above average at all four time points. Scores on the Woodcock Johnson Applied Problems subtest were below the national average for both black and Latino children but very slightly above the national average for white children. The difference between CLASS scores for white, Latino, and black children’s classrooms were quite small but white children’s kindergarten classroom CLASS scores were nearly two points higher than black children’s and one point higher than Latino children’s. Black children’s teachers had, on average, two more years of teaching experience than did the teachers of white children’s and approximately 1.5 years of additional experience when compared to Latino children’s teachers. White and black children’s kindergarten teachers possessed comparable amounts of experience but the kindergarten teachers of Latino students had almost three years less experience. Longitudinal Invariance
Climate and Negative Climate and errors for Overcontrol to correlate with errors for Negative Climate and Behavior Management. Model fit was significantly improved, χ2
(1) = 0.131, p < .718, CFI = 1.00, SRMR = .001, RMSEA C. I. = .000 - .044. The results from the test of weak factorial invariance suggested that weak invariance was supported, scaled χ2
diff(5) = 2.60, p = .761. Strong factorial invariance,
however, was not supported, scaled χ2
diff(9) = 98.42, p < .001. Examination of
modification indices suggests two main areas of misfit in the model. Specifically, the constrained factor loadings and intercepts of the Behavior Management and Positive Climate indicators were leading to model misfit. In order to test partial strong factorial invariance, the factor loadings and intercepts for the Behavior Management indicator were allowed to be freely estimated for both time points while the factor loadings and intercepts for the Positive Climate indicator remained fixed to identify the model. Partial strong factorial invariance was not supported as the remaining restrictions continued to cause a significant decrement in model fit, scaled χ2
diff(7) = 41.03, p < .001. Because
partial strong factorial invariance was not supported, sum scores from the indicators were used to represent emotional climate. Although SEM explicitly models error correlations, this is not possible with sum scores. Due to the fact that high correlations between indicators’ errors may suggest that they are providing redundant information (Wainer & Thissen, 2009), Negative Climate was not included in the sum scores so that they might provide a more accurate approximation of a classroom’s underlying emotional climate score.
The three unconditional models tested included a flat trajectory defined only by initial status (intercept-only), one defined by initial status and a linear slope, and one including a component of acceleration or deceleration (quadratic). Originally,
covariances among latent growth terms were freely estimated while error terms for each social competence score were freely estimated and assumed to be uncorrelated with one another. However, initial intercept-only and linear slope models fit with these guidelines fit quite poorly (e.g., intercept-only: χ2(8) = 176.88, p < .001, CFI = .621, SRMR = .137, RMSEA C. I. = .197 - .254). Modification indices suggested that errors for scores within
each year (e.g., pre-kindergarten fall and prekindergarten spring) were correlated with one another. Because this correlation would be theoretically supported by the contextual nature of the social competence variable, scores were allowed to correlate with one another within each year. Comparison of the models after adjustment suggested that the fit of the intercept-only model, χ2(6) = 27.09, p < .001, CFI = .953, SRMR = .058,
RMSEA C. I. = .058 - .128, was not significantly different than that of the linear model,
scaled χ2diff(3) = 4.46, p = .216, while also maintaining greater parsimony. Addition of the correlated error terms did not permit the estimation of the originally planned
quadratic growth model as doing so would have required more degrees of freedom than were available. Unconditional modeling with the other two racial groups suggested similar trajectory shapes.
Exploratory Model and Cross-Validation
Hypothesis 1. Results supported the hypothesis that the model would accurately describe the important relationships in the data. After fitting the proposed model to a small portion of the reference group sample, I then cross-validated the model by fitting it to the remaining members of the sample (N = 197). Model fit was quite good, χ2(29) = 33.04, p = .28, CFI = .987, SRMR = .045, RMSEA C. I. = 0 - .051. Because the model fit well in the entire sample, it appeared to be accurately portraying the relationships within the data.
Multiple Group Model
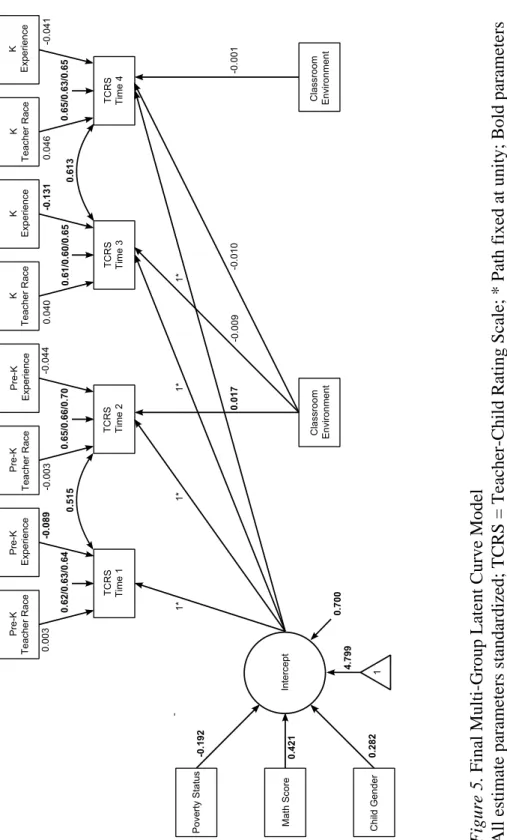
Hypothesis 2. Results did not support the second hypothesis, which predicted that models fit to white children would not fit adequately for black and Latino children. In order to compare models across groups, the model configuration shown in Figure 4 was fit to the data for all three groups (Reference N = 300; Latino N = 94; Black N = 159), allowing parameters to be freely estimated for all three models. Then a more restrictive model, in which all parameters, with the exception of residuals on the social competence measures, were forced to equality across the groups, was estimated. (Because the residual variance terms for the repeated measures were not of substantive interest in this study, they were allowed to remain free.) The fit between the models was not significantly different, scaled χ2diff(17) = 48.02, p = .13. Therefore, the hypothesis of equivalence between groups cannot be rejected. This suggests that the model as
as well. Final model fit, as with the reference group model, was quite good, χ2(119) = 128.75, p = .26, CFI = .989, SRMR = .074, RMSEA C. I. = 0 - .04.
Hypothesis 3. The hypothesized negative relationship between poverty and students’ latent intercepts was supported. Specifically, expected social competence scores for children in poverty were 0.17 points lower than their counterparts in families whose incomes were above 150% of the poverty line. Because the model does not contain a slope term, this influence persists across all time points. The partial correlation between poverty status and children’s intercepts was -.192.
Hypothesis 4. This hypothesis, which predicted that male status would be negatively associated with students’ latent intercepts, was also supported. Males’ social competence scores were predicted to 0.255 points lower than girls. As with poverty, this influence persists across the entire transition. The partial correlation between gender and children’s social competence intercepts was .282.
Hypothesis 5. Results of this study also confirmed Hypothesis 5, such that math problem solving would be positively related to children’s social competence intercepts, was supported. A one standard deviation increase in a student’s Woodcock-Johnson Applied Problems subtest predicted a .42 standard deviation increase in their scores on the TCRS. The partial correlation between math scores and social competence intercepts was .421, making it the strongest predictor of children’s social competence.
relationship with students’ social competence scores at the end of pre-kindergarten after accounting for their existing trajectory. However, kindergarten emotional climate scores were not a significant predictor of students’ social competence scores at the end of kindergarten after accounting for their trajectories. That said, a one standard deviation increase in emotional climate scores in pre-kindergarten only predicted a 0.02 standard deviation perturbation in social competence scores. While this is statistically significant in this sample, it does not represent a substantively significant association.
Pre-kindergarten emotional climate scores were not significantly associated with children’s social competence scores in fall and spring of kindergarten.
Other results. In addition to the results pertaining to specific hypotheses, this study also contained a number of other substantively meaningful parameter estimates relevant to the understanding of children’s social competence across the transition to kindergarten. I outline some of the parameters and discuss their statistical significance as well as effect sizes in the following discussion.
The mean of the latent intercept was estimated as 2.107, p < .001, and may be interpreted as the expected value for a boy from a home with income at or below 150% of the poverty line who scored a 0 on the Woodcock-Johnson Applied Problems subtest. Although mean centering the Woodcock-Johnson scores may have eased interpretation of this parameter, doing so caused model mis-specification issues, necessitating the use of the traditional standardized scores. There was also significant variance of individuals’ intercepts, suggesting a heterogeneous group with regard to social competence levels.
significant predictor of students’ social competence scores after accounting for their latent trajectories at any time point. Teacher experience, on the other hand, was a significant predictor of student social competence score perturbations in the fall of pre-kindergarten and the fall of pre-kindergarten. In both cases, greater experience predicted lower scores. In the fall of pre-kindergarten, each year of teaching experience predicted a score reduction of .007, p = .03, while in the fall of kindergarten, each year of teaching experience predicted a score reduction of .009, p = .007. These associations are
substantively meaningful, particularly in kindergarten, where a teacher with 30 years of experience would be predicted to rate a child almost a half of a standard deviation lower than a first year teacher. Teacher experience was not, however, associated significantly with students’ scores in the spring of either year after accounting for their latent
trajectories.
Chapter Five: Discussion
Through the lens of Developmental Systems Theory (Ford & Lerner, 1992; Sameroff, 1983; Sameroff, 2010), this study capitalized on the potentials of a multiple group latent growth curve modeling approach to examine children’s social competence trajectories across the transition to kindergarten as well as a number of factors that contemporary research has suggested are associated with this construct. More
specifically, this study has improved upon past research methodologically in three key areas. First, as opposed to a mean difference model, I modeled children’s social competence scores over time as representing a trajectory, with variables either
influencing the trajectory itself or perturbing scores off that trajectory at specific time points. Second, I have focused on factors across the entire transition rather than simply examining the influence of events that occur before on outcomes after children begin kindergarten. Third, I used SEM techniques to examine whether or not model differences exist between three racial groups.
This study also provides a number of substantive contributions to understandings of children’s social competence and their transitions to kindergarten, many of which have implications for classroom practice and policy. In this study, classroom emotional
pre-kindergarten or pre-kindergarten. Child race was also not a significant contributor to social competence trajectories nor did race moderate the relationships between other factors and children’s social competence. Variables that did matter point to new directions for research and classroom practices. Specifically, boys from low-income households were more likely to be rated as socially less-competent by their teachers; and this relationship persisted over time. Math problem solving achievement at the beginning of
pre-kindergarten, on the other hand, was strongly and positively associated with children’s social competence trajectories. In this chapter, I will discuss these key findings, noting their implications for practice and future research. I will conclude by noting the
limitations of this study.
Social Competence Trajectories
Given the dearth of literature on children’s social competence trajectories during the time frame under consideration in this study, an exploratory approach was used to fit trajectories for the reference group in this sample (white children). Out of the
unrestricted models fit to this sample, the intercept-only model provided the best fit, such that children’s social competence trajectories were flat rather than growing or declining. In non-statistical terms, this means that teachers’ ratings of children’s social
competencies did not change over time. Given that similar trajectories for elementary students between kindergarten and second grade contained positive slopes (Peisner-Feinberg et al., 2001), this was surprising. I will explore two possible explanations for this key finding.
normalize results by making those comparisons of students in their classes to one another. One outcome of such a practice would be that, although individuals might make progress from year to year with regards to their social competence, their relative standing to their peers may remain unchanged. If their scores on the TCRS represent such a comparison, scores would remain largely stable from year to year.
Another intriguing explanation for stable scores over time concerns the nature of social competence as a contextual variable. That is, social competence is defined as much by the environment in which the child develops as it is defined by characteristics internal to the child. Should the environment increase expectations of children’s social competence at the same rate children develop the competencies and skills that underlie the construct, scores would also remain stable. For example, as children’s brains develop, their increasing facility with behavioral self-regulation permits them to remain still and attentive for longer in whole group settings (Blair, 2002). In a stable
environment, this would result in increased scores on the TCRS. If, however, the amount of time children were asked to sit still was also increased at a pace consonant with their ability to self-regulate, scores would remain stable.
expectations of the new environment. The implication of such a finding is that the
transition from pre-kindergarten to kindergarten with regard to expectations for children’s self-regulation is abrupt. In order to create a smoother transition, kindergarten teachers should be mindful of the expectations they have for children’s self-regulation as current kindergartens more closely resemble third grade classrooms than the pre-kindergartens from which children come (Holland, Ritchie, & Oertwig, 2013).
Further research is necessary to substantiate this explanation for the results in this study. An experimental or quasi-experimental design in which classroom activity
settings (e.g., the length of time children are asked to spend in whole group) are manipulated would provide support for the causal nature of the environment’s role in suppressing children’s social competence scores. A study with a longer time frame would also rule out the possibility that every new year in school brings a drop in social competence scores as children enter new environments with new expectations. An increased number of data points within each year may also elucidate how children
develop social competence within each individual classroom year. Better determining the classroom environment’s role in dictating children’s social competence trajectories remains an area ripe for future research.
Factors Associated with Children’s Social Competence Trajectories
poverty, and gender have differing relationships in different racial groups. For example, Raver, Gershoff, and Aber (2007) examined the relationship between poverty and social-emotional readiness using the ECLS-K data set, finding a number of differences between racial groups including the relationships between parenting, material hardship, and social-emotional readiness for children in elementary school. In that sample, race served as a protective factor, buffering children from the negative effects of poverty. Other research by Shanahan, Davey, and Brooks (1998), has suggested that being Latino places students at greater risk of developing internalizing and externalizing issues when coupled with poverty.
The findings in this sample, however, suggest that for children making the transition to kindergarten, significant differences do not exist between poverty, math achievement, or gender’s relationship to social competence across groups of white, black, and Latino children. Nor does classroom emotional climate appear to be differentially related to children’s social competence. It is possible that such differences emerge later in children’s schooling careers as the aforementioned studies examined older children. Specifically, factors that emerge later as risk or protective factors for children may not have time to significantly affect children’s classroom social competence at this young age. Another possibility is that the transition is similarly challenging for all children, such that factors which buffer or exacerbate difficulties during typical periods of
understanding of which factors lead to these similar models during this period of development.
Poverty and gender. The hypothesis that poverty status would be negatively associated with children’s social competence trajectories was supported by the final model. This finding expands on findings in other research by a number of researchers (Ackerman et al., 1991; Zill et al., 1991), who have found that children from poverty in elementary school possess lower scores on measures of social competence than their peers who do not come from poverty, by suggesting that a similar relationship exists between poverty and social competence across the pre-kindergarten and kindergarten years.
The findings with regard to gender were similar. Prior research has suggested that significant differences exist for social competence between boys and girls before children arrive in school (Geary et al., 2003) and after (Winsler & Wallace, 2002). This study replicates those results for children in pre-kindergarten and kindergarten. As with those studies, boys were predicted to possess scores that were lower than girls’ scores at all time points.