INDUSTRIALLY SCALABLE HUMAN LIVER ORGANOIDS
Bryant Tai Wu
A thesis submitted to the faculty of the University of North Carolina at Chapel Hill in partial fulfillment of the requirements for the degree of
Master of Philosophy in the Department of Biomedical Engineering
Chapel Hill 2015
iii
ABSTRACTBryant Tai Wu; Industrially Scalable Liver Organoids (Under the direction of Lola M. Reid)
iv
ACKNOWLEDGEMENTS
v
TABLE OF CONTENTS
ABSTRACT ... iii
ACKNOWLEDGEMENTS ... iv
TABLE OF CONTENTS ...v
LIST OF TABLES ... viii
LIST OF FIGURES ... ix
LIST OF ABBREVIATIONS ... xiv
CHAPTER I ... 1
BACKGROUND ... 1
Need for Ex Vivo Human Cell Cultures as Models ... 1
Development of ex vivo Cultures ... 2
Organoid Cultures ... 4
The Liver and its Maturational Lineages ... 9
Key Phenotypic Traits of Distinct Maturational Lineage Stages of Cells ... 11
Extracellular Matrix Composition ... 13
Organization of the Liver Extracellular Matrix ... 16
Extracellular Matrix Gradients in Fetal versus Adult Livers ... 18
Tissue-specific Extracellular Matrix Extracts ... 19
CHAPTER II ... 23
MOTIVATION FOR STUDIES ON IMAGING TECHNIQUES ... 23
vi
FUNCTIONAL ULTRASOUND IMAGING FOR ASSESSMENT OF BIOMATRIX
SCAFFOLDS USED FOR LIVER ORGANOID FORMATION ... 25
Synopsis ... 25
Introduction ... 26
Material and Methods ... 28
Results ... 33
Discussion ... 38
Conclusions ... 44
Figures and Tables ... 45
Online Supplement ... 53
Supplemental Figures and Tables ... 62
CHAPTER IV ... 65
MOTIVATION FOR ORGANOID STUDIES ... 65
CHAPTER V ... 67
STEM-CELL DERIVED, FUNCTIONAL HUMAN HEPATIC ORGANOIDS IN HYALURONAN HYDROGELS CONTAINING PULVERIZED LIVER BIOMATRIX SCAFFOLDS ... 67
Synopsis ... 67
Introduction ... 68
Materials and Methods ... 70
Results ... 76
Discussion ... 84
Figures and Tables ... 91
Supplemental Figures and Tables ... 102
CHAPTER VI ... 106
CONCLUSIONS ... 106
vii
Ex vivo Maintenance Concerns including 2D vs 3D and Culture Media ... 107
Importance of Extracellular Matrix and Maturational Gradients ... 108
Rationale Behind Decellularization Processes and Strategy Comparison ... 109
Non-invasive Ultrasound Techniques for Evaluation of Matrix Substrata ... 110
Organoid Cultures ... 111
Current Status of Ex Vivo Model Development ... 112
Current Major Challenges in the Development of in vitro Models ... 113
Future Directions of Our Studies ... 113
Future Applications of Ex vivo Models ... 114
viii
LIST OF TABLES
ix
LIST OF FIGURES
Figure 1: Clonal LGR5-derived Organoids ... 4
Figure 2: iPSCs-derived Liver Buds Co-cultured with HUVECs and MSCs ... 4
Figure 3: Hydrogel Fibers of Rat Hepatocytes Co-Cultured with Swiss 3T3 Cells ... 6
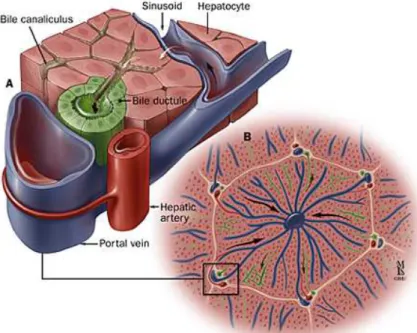
Figure 4: Structural Organization of the Liver ... 9
Figure 5: Fibrillar Collagens. The 3 amino chains can be identical (homotrimers) or distinct (heterotrimers). Each of the more than 20 fibrillar collagen types has a unique amino acid sequence. The fibrillar collagens offer greater mechanical support than network collagens and primarily in the orientation of the fiber ... 14
Figure 6: Network collagens. 7S domain is the site to which laminin is bound. These collagens form a single collagen molecular layer adjacent to cells and offer flexibility in all directions ... 15
Figure 7: Families of attachment proteins: fibronectins (a) and laminins (b). Both families of proteins have cell binding domains and sites at which other matrix molecules can attach. The attachment proteins have various signals (e.g. EGF) hardwired” into their amino acid sequence. Therefore, dissolution of these proteins releases the signals into the local microenvironment ... 15
Figure 8: The various matrix molecules aggregate to form an insoluble complex adjacent to cells ... 16
Figure 9: Matrix scaffolds prepared by delipidation followed by distilled water rinses. The procedure isolates the cross-linked collagens and factors bound to them. Most of the attachment proteins and the proteoglycans are missing making it difficult to get cells to attach during the recellularization process and requiring weeks to achieve differentiation of the cells. However, the vascular channels are patent ... 21
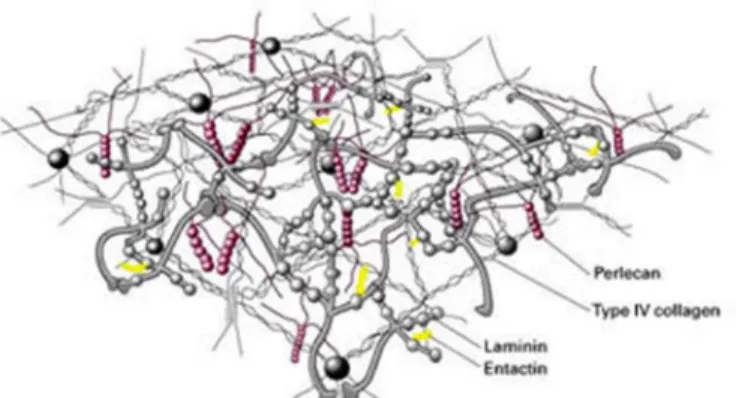
Figure 10: Biomatrix scaffolds prepared by gentle delipidation and high salt buffer washes. The matrix extract contains essentially all of the collagens (>98% of both cross-linked and non-cross-cross-linked or nascent collagens) and all factors bound to them (fibronectins, laminins, nidogen, proteoglycans, etc.). Notice the complexity of the matrix and the diverse types of matrix components present. The vascular channels are patent. Cells attach within minutes and differentiate within a few days ... 22
x
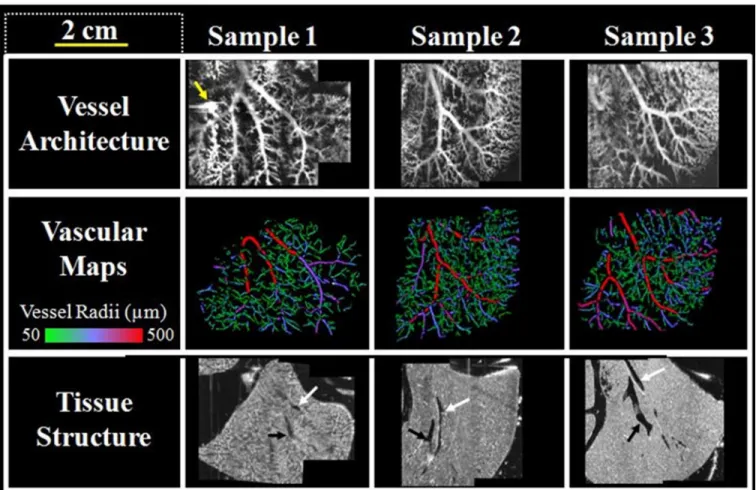
Figure 12. The orientation of the biomatrix scaffold sample as viewed from above with the following visible lobes labeled: a) left lateral lobe (LLL), inferior right lobe (IRL), anterior caudate lobe (ACL), posterior caudate lobe (PCL), superior right lobe (SRL), and median lobe (ML). The LLL was the lobe imaged in this study. Lobes were identified in this figure via an available surgical guide. b) Orientation of the imaging sub-volumes relative to the tissue sample. XY dimensions were lateral and axial axes within the ultrasound coordinate space, with the Z-axis being the elevational scan direction. c) Schematic explaining the registration of multiple 3D volumes from three distinct ultrasound imaging approaches into the final composite volume ... 46 Figure 13. A compilation of image data acquired of the three biomatrix scaffold samples.
Yellow arrow indicates location of sample #1, which was perforated and thus leaking microbubbles. Each row was acquired with the following imaging modes (from top to bottom): Acoustic angiography, semi-automated segmentations from acoustic angiography data, and b-mode. White and black arrows on the b-mode images indicate vessels identified as part of either the portal or hepatic circuits,
Respectively ... 47 Figure 14, Panel 1. a-c) 3D renderings of the biomatrix acoustic angiography data. Color
is defined as either inside (green) or outside (purple) of the manually defined tissue border. d) Quantitative assessments of vascular network volume, length, and
vascularity ratio. Data are normalized to sample #1 ... 48 Figure 14, Panel 2. Perfusion comparisons between the three liver scaffolds evaluated
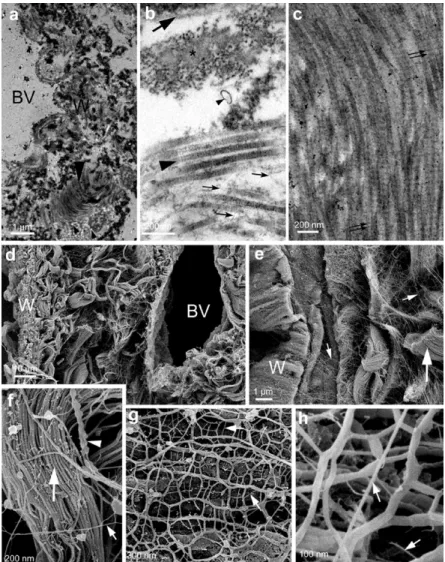
from the flash-replenishment imaging. (Top) Area normalized vessel size histograms computed from the vessel segmentations. (Bottom) Area normalized perfusion rate Histograms ... 49 Figure 15, Panel 1. Scanning Electron Microscopy (SEM)
a) Normal adult rat liver fixed with 4% paraformaldehyde and subjected to SEM. b) Normal rat liver biomatrix scaffold. The major and minor vascular channels are evident in both the liver and in the scaffold. Empty spaces are visible where
parenchymal cells previously resided (thin arrow). Major vascular channels are also visible (thick arrow).
c) Low magnification image of rat liver biomatrix scaffold reseeded with Hep3b cells. Large numbers of cells are found bound to the matrix throughout the scaffolds. This attachment occurs within minutes of seeding the cells and results in near 100% engraftment by the end of the seeding process.
d) Higher magnification image of rat liver biomatrix scaffold showing Hep3b cells that have attached, spread and are forming classic cellular extensions and connections with each other. They engage (thick white arrow) the lumen of the vessel wall and perhaps pass through the fenestrae (thin white arrow) that remain following
decellularization ... 50 Figure 15, Panel 2. a) Hematoxylin and eosin stained sections revealed a cell distribution
xi
elsewhere on the matrix. By contrast, EpCAM expression was quite strong in the cells bound in these regions but weak or negligible if in matrix regions associated with zones 2 and 3 (EpCAM=green, DAPI=blue). This is surprising, given that the test cells are a cell line and yet they apparently still have the capacity to show some degree of zonation of functions if bound to specific regions of the biomatrix scaffolds ... 51
Figure 16. Measurements of albumin and urea secretion by Hep3B cells seeded in
biomatrix scaffolds (n=3) and cultured over a 14-day period. Levels are normalized to the number of initial number of cells seeded into the scaffold. Symbols indicate media collection over 24 hours ($), 48 hours (x), 72 hours (*), and 96 hours (+). Statistical analyses were unable to be performed, and, therefore, raw data are presented ... 52 Figure 17. Decellularization process. Top: Flushing liver with a serum-free basal medium
(e.g. DME/F12) to remove blood. Middle: Delipidating with phospholipase A2 (PLA2) and then with PLA2 combined with deoxycholate; rinsing with serum-free DME/F12; perfusing with 3.4 M high salt buffer (salt concentration dictated by collagen types in the tissue), with soybean trypsin inhibitor, with all kept at a pH of 7.5-8.0; rinsing to remove salt. Bottom: Treating with nucleases to remove residual nucleic acids and then rinsing with serum-free basal medium and stored at 4° C. The liver’s collagen types include types I, III, IV, V, VI, and XVIII ... 62 Figure 18. Data illustrating the stability of the normalized perfusion area (NPA) and
normalized perfusion speed (NPS) before and after modifying the contrast injection protocol. Images A and B represent data before syringe mixing, while C and D show after syringe mixing. Note the improvement in consistency (i.e. the reduction in
percent standard deviation) for both parameters after implementing syringe mixing ... 63 Figure 19. The matrix scaffold was housed in a bioreactor containing 200 ml of medium.
A) The hepatoblast-like cells, Hep3bs, were introduced into the matrix scaffold by perfusion through the portal vein via a peristaltic pump. B) Photograph of a reseeded matrix scaffold housed in the bioreactor ... 64 Figure 20: Schematics of the decellularization of liver and preparation of grinding vials ... 91 Figure 21: Collagen analysis and growth factor array of decellularized tissue compared to
fresh liver tissue. All data reported as mean ± 1 standard deviation ... 92 Figure 22: Schematics of the pulverization process and preparation of LBM-HA culture
Materials ... 93 Figure 23: Schematics of the preparation of pulverized liver biomatrix scaffolds and
hyaluronan cultures ... 94 Figure 24: Phase contrast imaging of hHpSC colonies in pLBM-HA cultures. Day 1 (A)
and Day 5 (B) of culture in 0 mg/ml of pulverized liver biomatrix and 20 mg/ml of hyaluronan. Day 1 (C) and Day 5 (D) of culture in 50 mg/ml of pulverized liver biomatrix and 20 mg/ml of hyaluronan. Day 1 (E) and Day 5 (F) of culture in 100 mg/ml of pulverized liver biomatrix and 20 mg/ml of hyaluronan. Some colonies could be seen to have formed attachments to the culture surface after 5 days
xii
Figure 25: Functional assays of hepatic functions over time to compare hHpSCs when cultured at various concentrations of pulverized biomatrix hyaluronan mixed with hyaluronans. AFP and Albumin secretion are reported as fold change normalized to initial target levels 24h after seeding. (A) Change in AFP secretion measured over time. (B) Change in Albumin secretion measured over time. Significance levels for secretion rates of hepatic factors (p-value: * < 0.05, ** < 0.01, *** < 0.001) are reported with respect to secretion rates 24h after seeding for each pulverized biomatrix concentration (two-tailed Student’s t¬-test). All data reported as mean ± 1 standard error... 96 Figure 26: Gene Expression levels for differentiation markers in hHpSCs cultured in
hormonally defined medium (HDM) tailored for liver and in hyaluronans and various concentrations of pulverized biomatrix after 5 days by qRT-PCR. Target mRNA expression levels are normalized to GAPDH expression and fold changes are normalized to initial target mRNA expression levels in hHpSCs . Significance levels for secretion rates of hepatic factors (p-value: * < 0.05, ** < 0.01, *** < 0.001) are reported with respect to expression levels of hHpSCs isolated the same day the cultures were started (two-tailed Student’s t¬-test). All data reported as mean ± 1
standard deviation ... 97 Figure 27: Gene Expression levels for differentiation markers in hHpSCs cultured in HDM
for liver and in hyaluronans combined with various concentrations of pulverized biomatrix scaffolds after 7 days by qRT-PCR. Target mRNA expression levels are normalized to GAPDH expression and fold changes are normalized to initial target mRNA expression levels in hHpSCs. Significance levels for secretion rates of hepatic factors (p-value: * < 0.05, ** < 0.01, *** < 0.001) are reported with respect to expression levels of hHpSCs isolated the same day the cultures were started (two-tailed Student’s t¬-test). Target mRNA expression levels of samples at the
concentration of 100 mg/ml are also compared to the samples at 0 mg/ml for
significance (blue). All data reported as mean ± 1 standard deviation ... 98 Figure 28: Gene Expression levels for the mature hepatocyte marker transferrin in
hHpSCs cultured in HDM for liver and in hyaluronans with various concentrations of pulverized biomatrix after 5 and 7 days by qRT-PCR. Target mRNA expression levels are normalized to GAPDH expression and fold changes are normalized to initial target mRNA expression levels in hHpSCs. Significance levels for secretion rates of hepatic factors (p-value: * < 0.05, ** < 0.01, *** < 0.001) are reported with respect to expression levels of hHpSCs isolated the same day the cultures were started (two-tailed Student’s t¬-test). All data reported as mean ± 1 standard
Deviation ... 99 Figure 29: Comparison of differentiation marker gene expression levels between mature
xiii
Figure 30: Comparison of differentiation marker gene expression levels between mature hepatocytes and hHpSCs cultured in HDM for liver and in hyaluronans with various concentrations of pulverized biomatrix after 7 days by qRT-PCR. Target mRNA expression levels are normalized to GAPDH expression and fold changes are normalized to initial target mRNA expression levels in hHpSCs. All data reported as mean ± 1 standard deviation ... 102 Figure 31: Gene Expression levels for stem cell markers in hHpSCs cultured in HDM for
liver and in hyaluronans and various concentrations of pulverized biomatrix scaffolds after 5 days by qRT-PCR. Target mRNA expression levels are normalized to GAPDH expression and fold changes are normalized to initial target mRNA expression levels in hHpSCs. All data reported as mean ± 1 standard deviation ... 103 Figure 32: Functional assays of hepatic functions over time to compare hHpSCs cultured
in Kubota’s Medium to hHpSCs cultured in HDM for liver. Cultures consisted of hyaluronans with various concentrations of pulverized biomatrix scaffolds. AFP and Albumin secretion are reported as fold change normalized to initial target levels 24h after seeding. (A) Change in AFP secretion measured over time. (B) Change in Albumin secretion measured over time. All data reported as mean ± standard
error ... 104 Figure 33: Gene Expression levels for differentiation markers to compare hHpSCs
cultured in Kubota’s Medium to hHpSCs cultured in HDM for liver and in
hyaluronans with various concentrations of pulverized biomatrix scaffolds after 5 days by qRT-PCR. Target mRNA expression levels are normalized to GAPDH expression and fold changes are normalized to initial target mRNA expression
xiv
LIST OF ABBREVIATIONS
Acronyms for cell populations or tissues are preceded by a small letter to indicate the species: r= rat; h=human.
AFP: α-fetoprotein ALB: albumin
CD: common determinant CD44: hyaluronan receptor CD133: prominin
CFTR: cystic fibrosis transmembrane conductance regulator CK: cytokeratin protein
CS-PG: chondroitin sulfate proteoglycan
CXCR4: C-X-C chemokine receptor type 4 (CXCR-4) also known as fusin or CD184 DS-PG: dermatan sulfate proteoglycan
ECM: extracellular matrix EGF: epidermal growth factor
EpCAM: epithelial cell adhesion molecule FBS: fetal bovine serum
FGF: fibroblast growth factor FN: fibronectin
xv
HDM: hormonally defined media- serum-free medium with constituents optimizing differentiation for a specific cell type such as liver (HDM-L)
HGF: hepatocyte growth factor HP-PG: heparin proteoglycan HpSCs: hepatic stem cells
HS-PG: heparan sulfate proteoglycan
HUVECs:human umbilical vein endothelial cells Hyp: hydroxyproline
ICAM1: intercellular adhesion molecule-1 iPSCs: induced pluripotent stem cells
iPSC-LB: induced pluripotent stem cell liver buds
KM: Kubota’s Medium (a serum-free medium designed for endodermal stem/progenitors) KRT: cytokeratin gene
LA: laminin
LGR5: Leucine-rich repeat-containing G-protein coupled receptor 5 that binds to R-spondin MSCs: mesenchymal stem cells
NCAM: neural cell adhesion molecule PLA2: phospholipase A2
PEG: polyethylene glycol
pLBM-HA: hydrogels containing pulverized liver biomatrix scaffolds and hyaluronans SDC: sodium deoxycholate
SDS: sodium dodecyl sulfate
SEM: scanning electron microscopy SDC: sodium deoxycholate
1
CHAPTER IBackground
Need for Ex Vivo Human Cell Cultures as Models for Experimental Studies
Various limitations exist in the use of human and animal models in research ranging from a lack in availability of test subjects to the practicality of experimental protocols to handle large amounts of samples and even to ethical issues concerning the test subjects during experimentation. Additionally, the correlation between animal models and humans is often not sufficient to accurately model the clinical efficacy of certain treatments. Human tissues are obviously the ideal candidates for studies relevant to clinical programs, but the paucity of human tissues and the added costs and complications involved in experiments with these tissues results in severe limitations in accommodating the necessary experiments. The need for human model systems is great especially since there are factors associated with individual donors, such as certain genetic disorders and diseases that might be influential to experimental results. All of these issues and more lead to the necessity for human model systems that are
standardized, reliable and industrially scalable.
These needs have driven the development of in vitro human models for preclinical drug development, for disease mechanism research, as well as for studies on drug efficacy,
2
efficient as compared to models involving primary cultures of donor tissues and the less reliable animal models, while enabling the possibility of evaluating many different experimental
conditions at the same time.
Development of Ex Vivo Cultures
Monolayer cultures have been the most commonly used models for the study of hepatic cells because of the ease of handling and of assaying the cultures along with the clarity of observing the growth and morphological changes of the cells. However, when hepatocytes are isolated from their natural environment in the liver and cultured in vitro on plastic, the
hepatocytes lose their differentiated functions within less than a week (11, 12). A variety of media have been used in these systems, which began with media supplemented with serum. Serum supplemented media, used for decades, are being replaced increasingly by
supplementation with mixtures of defined and purified hormones and growth factors that form a serum-free, hormonally defined medium (HDM) tailored to the cell type, the maturational lineage stage of interest or the biological goal(s) of the experiment. The HDM have greatly improved cell functions in cultures, since serum is present in vivo only when there is a wound and contains factors driving tissues towards scar tissue formation and, therefore, fibrotic reactions (13). The differentiated cells require serum-free conditions to express their tissue-specific functions (11).
The HDM can be optimized for cell growth, for selection of specific cell types or maturational lineage stages, and can be optimized for tissue-specific gene expression. The primary cultures of selected cell populations can be sustained in culture for up to a week in serum-free HDM (11).
3
biomedical engineers have set up lab chips or microfluidics devices with co-culture systems resulting in parenchymal cells that are far more differentiated and last in culture for weeks (19). These are useful in microscale experiments for toxicological or pharmacological studies, but the cell numbers are too small to accommodate most biochemical studies.
In addition to co-cultures with non-parenchymal cells, in vitro culture systems of liver have been developed that utilize specific, purified components from the extracellular matrix, such as collagens or fibronectin, or attempt to mimic the native microenvironment through the use of other biomaterials (e.g. synthesized polymers). The use of purified extracellular matrix components in combination with serum-free HDM can enable the cells to be functionally stable for 1-2 weeks (11, 20-23). Other methods include the use of substrata consisting of extracellular matrix proteins to coat culture surfaces or fabrication of “sandwich cultures” in which the
parenchymal cells are placed in between two layers of matrix components (24-28). All of these variations of the use of matrix components are helpful to achieve greater levels of differentiation. The phenotypic traits of the mature cells are dependent, in part, on certain matrix components found in the native microenvironment of these cells (24, 29-34). The extracellular matrix
components, and factors bound to them, regulate the gene expression of these cells as well as their growth and morphology.
4
Organoid CulturesIn recent years there has been a return to organoid cultures, aggregates of epithelia and their mesenchymal partners that form units of ~1000 cells/unit. These cultures survive for weeks and remain functional, albeit at muted functional levels
(~5%) relative to in vivo functions. First utilized decades ago particularly with respect to cultures of embryonic tissues, the organoid culture systems were abandoned for decades because of the desire to have cultures derived entirely from a cloned cell population and to have the advantages of visualizing the cells in
monolayers. Many investigators are now returning to organoid culture systems due to the increasing recognition of the importance of the epithelial-mesenchymal interactions and their paracrine signals that serve to stabilize the cells and their functions (46). Studies have shown that these types of cultures facilitate the formation of cell configurations and polarities that are closer to those found in the native tissue (47).
Formation of organoids comprised of aggregates of parenchymal cells, endothelial and stellate cells, have been observed also to improve hepatocyte survival and functions (48-53). These categories of cells have been shown to co-exist in vivo and to participate in important cell-cell signaling necessary for proper liver functions that include homeostasis and regeneration (54-59). Interactions between endothelial cells and hepatocytes have been found to be important in the formation of vascular structures that lead to the morphogenesis of the liver (56, 60-62). Hepatic stellate cells have also been shown to participate in extracellular matrix synthesis and to direct signaling with
Figure 1: Clonal LGR5-derived Organoids (6)
5
cholangiocytes and with secondary effects on hepatocytes resulting in the promotion of the formation of various hepatic ultrastructures including desmosomes, bile canaliculi, and tight junctions (49-51). These cellular interactions are essential in regulating cell behavior and in maintaining the proper parenchymal phenotype.
Various investigators have utilized these cellular interactions to form organoids with improved hepatic functions. Huch et al. cultured LGR5-positive hepatic stem cells isolated from fetal livers and biliary ducts of mice in a 3D system consisting of Matrigel with a culture medium that included the Wnt agonist RSPO1, the ligand of LGR5 that promotes hepatocyte and bile duct generation in vivo (6). They were able to culture these organoids for up to 8 months. After 1-2 months, these organoids were found to express multiple hepatic-lineage and bile duct markers. These organoids, embedded in Matrigel, were able to attain expression of mature hepatocytic markers after induction with a differentiation medium that included FGF, EGF, and HGF. After these organoids were cultured in this medium for 13 days, the organoids achieved levels of functions that were about 5% of those in mature hepatocytes (e.g. albumin secretion). Thus, the organoids offered 3D cultures that are stable long-term and do preserve some degree of the functions albeit highly muted relative to that in vivo.
6
within 48 hours. The hepatic cells within the liver buds proliferated at a high rate in vivo and were observed to form hepatic cord-like structures after 2 months. Significant levels of albumin secretion were observed 10 days after transplantation with albumin being secreted at an extremely high rate after 45 days. Gene expression analyses verified these results on the explanted liver bud after 60 days. The functional levels of the iPSC-derived liver buds were high relative to the starting points of the experiments and secreted almost double the albumin
secreted by hepatocytes cultured in vitro but remained less than those functions of liver buds derived from fetal livers of 22-40 weeks old.
Soto-Gutierrez et al. co-cultured primary mouse hepatocytes with human
non-parenchymal cells in Matrigel (62). The non-non-parenchymal cells included endothelial and stellate cell populations acquired from a variety of sources. They were found to form tube-like
structures. The co-cultured hepatocytes were found to migrate to the tubes and remain attached while the hepatocytes that were cultured without these additional cell types formed independent organoids without any connection between them suggesting that these hepatocytes have tendencies to form structures similar to the sinusoids found in the native liver. When comparing hepatic functions, the organoids that were formed from the co-culture of the various cell types were found to have significantly increased albumin secretion after 4 days as compared to the cultures of primary hepatocytes alone. This significant increase was maintained even after 7 days with the spheroids of hepatocytes significantly decreasing in albumin secretion after 5 days. After a week of culture, the organoids were seen to maintain their high level of function.
Yamada et al. co-cultured primary rat hepatocytes sandwiched with 3T3 feeder cells in Ba-alginate hydrogel microfibers that allowed the formation of heterotypic micro-organoids in order to mimic the structure of the hepatic cords found in the native liver (4). The organoids remained viable after a Figure 3: Hydrogel Fibers of
Rat Hepatocytes Co-Cultured with Swiss 3T3 Cells (4)
CK18
7
month of culture and hepatic functions were found to be significantly increased as compared to traditional cultures. When compared to hepatocytes cultured on a layer of type I collagen and microfiber cultures with only hepatocytes, albumin secretion was significantly improved with the 3T3-hepatocyte co-culture organoids gradually increasing in secretion levels out to 20 days and maintain this level for at least 50 days. The organoids were found to still be secreting albumin after 90 days. These results were consistent in the gene expression analysis of the organoids.
Lu et al. utilized a hollow fiber reactor with a polysulphone-g-poly (ethylene glycol) (PSf-g-PEG) membrane to culture primary rat hepatocytes that self-assembled into organoids along the hollow fibers (63). When compared to monolayer and sandwich culture, these organoids were found to have significantly increased albumin secretion and remained functional for at least 2 weeks. These findings were also verified by gene expression analysis.
Au et al. was able to fabricate arrays of hepatic organoids from the co-culturing of a cell line, HepG2, transformed hepatocytic committed progenitors, and with NIH-3T3 cells
embedded in 3D hydrogel matrices consisting of type I collagen (64). These organoids were cultured for up to 4 days at which point the majority of the cells remained viable. No difference in albumin secretion was found in the first 3 days of culture, but a significant difference was found on day 4 with the cultures containing both cell types secreting much more albumin than the cultures of HepG2 cells alone. This confirmed the importance of the interactions between the epithelial and mesenchymal cells for hepatic functions.
However, organoids are constrained to be miniscale models since large numbers cannot be sustained given the absence of vascular support. Novel forms of organoids that incorporate extracellular matrix chemistry may yield improved and a more stable differentiation of
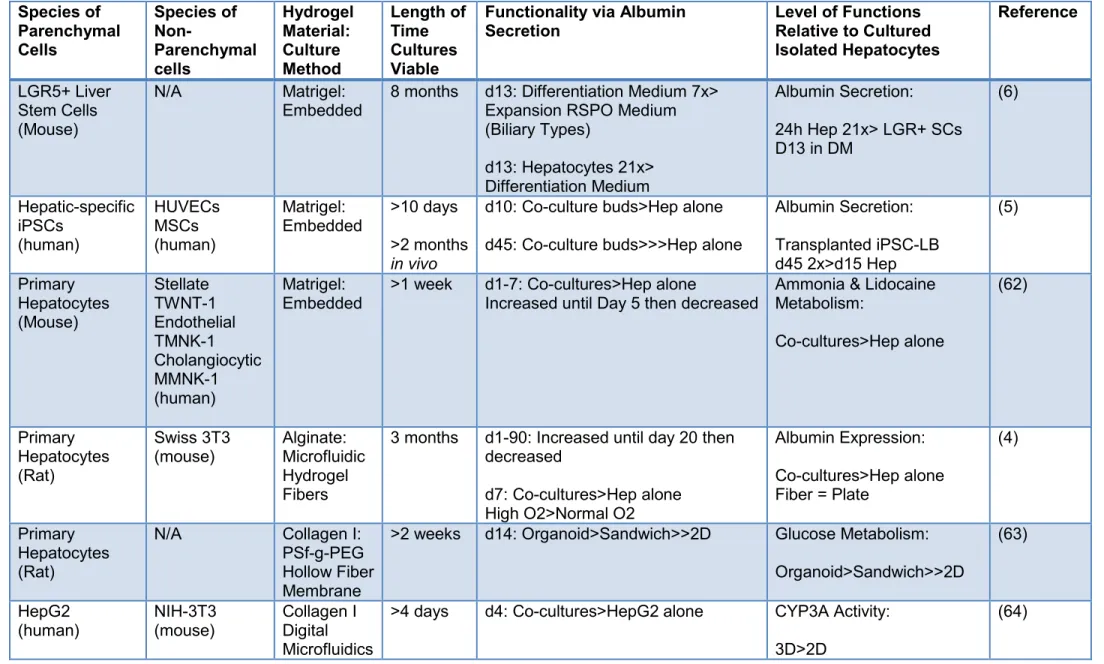
Table 1. Comparison between Current Organoid Culture Methods Species of Parenchymal Cells Species of Non-Parenchymal cells Hydrogel Material: Culture Method Length of Time Cultures Viable
Functionality via Albumin Secretion
Level of Functions Relative to Cultured Isolated Hepatocytes
Reference
LGR5+ Liver Stem Cells (Mouse)
N/A Matrigel:
Embedded
8 months d13: Differentiation Medium 7x> Expansion RSPO Medium (Biliary Types)
d13: Hepatocytes 21x> Differentiation Medium
Albumin Secretion:
24h Hep 21x> LGR+ SCs D13 in DM
(6) Hepatic-specific iPSCs (human) HUVECs MSCs (human) Matrigel: Embedded >10 days >2 months in vivo
d10: Co-culture buds>Hep alone
d45: Co-culture buds>>>Hep alone
Albumin Secretion:
Transplanted iPSC-LB d45 2x>d15 Hep
(5) Primary Hepatocytes (Mouse) Stellate TWNT-1 Endothelial TMNK-1 Cholangiocytic MMNK-1 (human) Matrigel: Embedded
>1 week d1-7: Co-cultures>Hep alone
Increased until Day 5 then decreased
Ammonia & Lidocaine Metabolism: Co-cultures>Hep alone (62) Primary Hepatocytes (Rat) Swiss 3T3
(mouse) Alginate: Microfluidic Hydrogel Fibers
3 months d1-90: Increased until day 20 then decreased
d7: Co-cultures>Hep alone High O2>Normal O2
Albumin Expression:
Co-cultures>Hep alone Fiber = Plate
(4)
Primary Hepatocytes (Rat)
N/A Collagen I:
PSf-g-PEG Hollow Fiber Membrane
>2 weeks d14: Organoid>Sandwich>>2D Glucose Metabolism:
Organoid>Sandwich>>2D (63) HepG2 (human) NIH-3T3 (mouse) Collagen I Digital Microfluidics
>4 days d4: Co-cultures>HepG2 alone CYP3A Activity:
3D>2D
(64)
9
In summary, 3D liver organoid cultures are now the dominant culture system under
consideration for industry. The long-term viability and maintenance of diverse differentiated functions of these cells show the importance of paracrine signaling between parenchymal cells, endothelia and stellate cells. Some limitations include that they can only be used, due to the lack of vascularization, at a micro- to miniscale basis, and that the differentiated functions are a fraction of those in vivo. Although all of them make use of a matrix component(s) or a crude matrix extract such as Matrigel, there has been no systematic exploration of the effects of tissue-specific matrix components or extracts.
The Liver and its Maturational Lineages of Parenchymal and Mesenchymal Cells
The liver is organized into acini, with each acinus being hexagonal and demarcated by 6 sets of portal triads at the vertices; plates of liver cells extend from the portal triads to a central vein. The phenotypic traits of the cells are distinct in different regions of the liver acinus. The pattern of these traits constitute a
maturational lineage of cells extending from the portal triads (zone 1), through the mid-acinar region (zone 2), and ending at the central vein (zone 3). The zonation of functions correlates with the maturational lineages of the cells, beginning with hepatic stem cells,
located in special small channels termed “canals of Hering”, next to each of the portal triads in zone 1 (65-68). These
10
differentiate into diploid adult hepatocytes in zone 1, into mature hepatocytes in the mid-acinar zone (zone 2), and into terminally differentiated and apoptotic cells in zone 3. Zone 3 is also the site that is replete with macrophages, found to facilitate aspects of the apoptotic process.
The maturational lineage stages have been defined in more detail in recent years resulting in recognition of at least 10 intrahepatic lineage stages (69, 70). Hepatic stem cells (HpSCs), which are multipotent cells, are known as intrahepatic lineage stage 1 in this classification system and are located within canals of Hering. They give rise to bipotent
hepatoblasts (HBs, stage 2) that in turn produce committed hepatocytic and biliary progenitors (stage 3). The diploid subpopulations of the cholangiocytic and hepatocytic lineages (stage 4) are also in zone 1, the primary site for gluconeogenesis. The mid-acinus (zone 2) contains lineage stages 5-7 that can be diploid in humans (but are polyploid in old age) and are always tetraploid in 4-5 week old rats and tetraploid or octaploid in 3-4 week old mice; the mid-acinar hepatocytes are fully mature and able to regulate most tissue-specific genes (e.g. albumin, transferrin, tyrosine aminotransferase) both transcriptionally and posttranscriptionally. The pericentral zone (zone 3) contains terminally differentiated cells that are in lineage stages 8 and 9, and apoptotic cells (lineage stage 10). Humans have terminally differentiated cells that are tetraploid; rats have hepatocytes that are a mix of tetraploid and octaploid; and mice have zone 3 hepatocytes that are 16N to 32N. Zone 3 is the peak site for lipid metabolism and for
detoxification enzymes (e.g. P450s). In summary, the plates of liver cells are comprised of different maturational lineage stages each one being defined by a unique set of phenotypic traits that include morphology, cell size, types of mitrochondria, gene expression, and ability to
regulate a given gene transcriptionally or post-transcriptionally.
The lineages of parenchymal cells are paralleled by lineages of partner mesenchymal cells. Angioblasts are associated with hepatic stem cells and give rise to endothelial cell
11
associated with the biliary cells (71, 72). The paracrine signaling between the epithelia and the mesenchymal cells forms a gradient of factors that are lineage-stage specific.
Key Phenotypic Traits of the Distinct Lineage Stages of Cells
The different lineage stages are recognizable by specific biochemical or antigenic biomarkers (67, 73). The hepatic stem cells (HpSCs) express epithelial cell adhesion molecule (EpCAM) throughout the cells and neural cell adhesion molecule (NCAM), enabling their isolation by immunoselection for cells expressing both markers. They also express cytokeratins 8, 18 and 19, a number of endodermal transcription factors (SOX9, SOX17, HES1) and low levels of pluripotency genes (OCT4, NANOG, KLF4). The angioblasts in association with the HpSCs express c-kit, CD133 (prominin), the vascular endothelial growth factor receptor (VEGF-r) and Von Willebrand factor (8, 65-67, 74). The HpSCs account for ~0.5-2% of the parenchymal cells in livers of all donor ages (65).
12
Hepatoblasts can be isolated via dual immunoselection for cells that are positive for EpCAM and ICAM-1 (8).
Lineage stage 3 consists of the committed progenitors, cells that are unipotent for either the hepatocytic or biliary lineage. They no longer express the endodermal transcription factors or the pluripotency genes but instead have hepatocytic or biliary marker expression intermediate between that found in hepatoblasts versus adult parenchymal cells. Although present in
significant numbers in fetal livers, they are uncommon in normal adult livers although they can achieve significant numbers in livers of donors with chronic liver diseases (78-80).
The biliary committed progenitors give rise to small cholangiocytes (lineage stage 4) that express muscarinic acetylcholine receptor M3, histamine H1 receptor, and cystic fibrosis transmembrane conductance regulator (CFTR). They do not express anion exchanger 1 (Band 3), receptors for secretin or somatostatin, nor any hepatocytic genes. Large cholangiocytes have more rough endoplasmic reticulum as compared to small cholangiocytes (80). These cells line the interlobular ducts in the portal triads and the larger intrahepatic ducts. Like small
cholangiocytes, they express CFTR but they also express anion exchanger 1 (Band 3) and receptors for secretin and somatostatin. (80, 81).
Lineage stage 4 hepatocytes, called small hepatocytes (17-21 µm) are all diploid and are bound together on their lateral borders enabling them to form plates or cords of cells (82-84) recognizable by the glucogenesis dominant in this region and for particular connexins (connexin 28). By zone 2 (lineage stages 5-7 cells), the plates of liver cells are distinctive in their
13
factors associated with the regulation of the protein (88, 89). These hepatocytes have the highest activities in gluconeogenesis, urea synthesis, glutathione peroxidase, and the metabolism of amino acids and ammonia (90).
Hepatocytes in lineage stages 8-9 are located pericentrally (zone 3) and are in
association entirely and only with fenestrated endothelial cells. They can synthesize DNA but do not undergo cytokinesis and so become polyploid, of which a subset are undergoing apoptosis (91, 92). The pericentral hepatocytes express albumin, transferrin, tyrosine aminotransferase, glutathione transferases, heparin proteoglycans and the late P450s (93). Kupffer cells are found in high abundance pericentrally and are in association with the apoptotic cells (92).
Extracellular Matrix Composition
The extracellular matrix (ECM) is an insoluble complex of components secreted by all cells and is located outside of the cells; the ECM forms the chemical scaffolding for the cells in a tissue or organ. These components are important for intracellular communication via cell-cell connections, induce the polarization of cells (94) and provide signals dictating gene expression and differentiation (95).
14
molecules such as growth factors and cytokines that dictate which receptor(s) these signals bind and/or influence facets of the signal transduction process. Also present are specialty molecules such as fibrillin. They are components of microfibrils to which are bound elastin, a key component in a tissue’s elasticity, and nidogen (also called entactin), a sulfated glycoprotein bound tightly to laminin (98-100).
The collagens are molecules consisting of 3 amino acid chains woven together in a braid-like structure in the regions comprised of glycine-proline-X. These form a triple-helical region that is very stable with globular domains at the ends of the collagen molecules and with amino acid sequences that are distinct for each collagen type. The
molecules are synthesized and subsequently
modified by posttranslational processing mechanisms
to have one or both globular domains eliminated, and with various other modifications that guide fibrollogenesis into collagen fibers. The different types of collagen fibers are the result of multiple collagen molecules organized in fibrillar
structures. The collagens, especially the fibrillar collagens, provide mechanical stability and tensile strength to the ECM particularly in the direction and orientation of the fibers (99, 101).
Exceptions occur for the network collagens (e.g. collagen types IV and VI) that keep both
Gly-Pro-X Region
Figure 5: Fibrillar Collagens. The 3 amino chains can be identical (homotrimers) or distinct (heterotrimers). Each of the more than 20 fibrillar collagen types has a unique amino acid sequence. The fibrillar collagens offer greater mechanical support than network network collagens and primarily in the
orientation of the fiber (2).
15
globular domains and then form a single molecular layer of a net-like structure that connects to cells via specific attachment proteins such as one of the 15 known forms of laminin. Type I collagen has 5 molecules per fibril and confers the greatest tensile strength; it is found in sites requiring stability and mechanical strength. Type III collagen is chemically very similar to type I collagen but has fewer molecules per fibril and forms delicate fibers (also known as reticulin) that provide a “nesting” framework for cells. This molecule is present throughout the liver plates. Type V collagen is found in sites of active growth and is often in complexes with type I. Type IV and VI collagen form single molecular layers that are present in the basal lamina. Type XVIII combines properties of collagens and proteoglycans and has bound heparan sulfate chains; it is associated with basement membranes of endothelia.
The attachment proteins include multiple classes, but two of the most common are laminin, for which there are at least 15 known isoforms, and fibronectins, which are also found in multiple isoforms. Two of the major ones are tissue fibronectin, which have cell binding
domains, and plasma fibronectin, devoid of cell binding domains and found in blood and lymph.
These various components of the ECM bind cells to specific cell receptors (e.g.
integrins). Elastin and fibrillin are part of the microfibrils that are also responsible for many of the mechanical properties of tissues and bind to other ECM molecules, including some collagens and proteoglycans. Fibronectin is secreted by cells and is central to the stability of the ECM.
Figure 7: Families of attachment proteins: fibronectins (a) and laminins (b). Both have cell binding domains and sites at which other matrix molecules can attach. The attachment proteins have various signals (e.g. EGF) hardwired” into their aminoacid sequence. Therefore, dissolution of these proteins releases the signals into the local microenvironment (9, 10)
16
This adhesion molecule is also important in the cell growth and contractility that is dependent on cellular adhesion (102-104). The fibrils of fibronectin are formed by the polymerization and deposition of this molecule, which control the deposition of collagen I and III (102-104).Organization of the Liver ECM in Chemical Gradients Correlated with Liver Histology The Glisson’s capsule around the liver and periportal regions have a basement membrane that consists of collagens IV and VI, laminin, nidogen, and perlecan. The portal space interstitium contains types I, III, IV, V collagen, and fibronectin (97). These molecules have specifically been seen to localize around areas that include the basement membranes beneath the endothelial lines of hepatic arteries, portal veins, around bile ducts, lymphatic vessels and nerve axons (105). Collagen IV has also been found to be around the central vein and in the Space of Disse (105). Fibronectin is absent around the lymphatic vessels and bile ducts but is found throughout the liver plates (106). Elastin can be found in the vasculature and the Glisson’s capsule (106). Collagen IV and fibronectin are the only matrix molecules found across all the acini between the liver cell plates and the endothelial lining but also around the central vein in the sinusoidal lining (105).
Fibrillar structures with type I, III, and V collagen have specifically been seen to localize around the portal triads, ductal plates, hepatic cords, framework of the sinusoids, Glisson’s capsule, and the canals of Hering (106). Collagen IV, laminin, and nidogen have been seen in the basement membrane and around the portal triads (106). The space of Disse located between the sinusoidal endothelial cells and the hepatocytes lacks the continuous laminin, perlecan, and entactin/nidogen found in the majority of basement membranes whereas type III
17
and IV collagen along with fibronectin are abundant (105, 107). A continuous network of collagen I fibers connect the lobular areas to the adjacent portal tracts (97). Collagen VI fibers are found primarily in the portal spaces and form continuous layers in the sinusoids while collagen XVIII is also found in the basement membranes (97, 107).
The liver ECM in the canals of Hering is comprised of hyaluronans (HA), non-sulfated or minimally sulfated glycosaminoglycans (GAGs), primarily chondroitin sulfates, along with minimally sulfated forms of proteoglycans (PGs). Outside of these niches, the proteoglycans have sulfated GAGs that include heparan sulfates (HS) and heparins (HPs), which are polymers of glucuronic acid and glucosamine, as well as chondroitin sulfates (CS) and dermatan sulfates (DS), which are polymers of glucuronic acid and galactosamine (108, 109). Although these are all found throughout the liver, the HS-PGs and HP-PGs are dominant with respect to the hepatocytes and with the extent of sulfation increasing with proximity to the central vein. The CS-PGs and DS-PGs become more dominant with respect to the biliary lineages. CS-PGs and DS-PGs are secreted by lipocytes, while HS-PGs and HP-PGs are secreted by both
hepatocytes and lipocytes. These PGs are localized predominantly in the Space of Disse between the hepatocytes and the endothelia, and are important for inducing cell polarity, facilitating communication via gap junctions, and in regulating tissue-specific gene expression (83, 110). The HS-PGs/HP-PGs specific to the liver include perlecan, syndecans, glypicans, and fibroglycan. Perlecan is not in contact with the plasma membrane of the cells but is known to be a reservoir of various signals that are bound to its GAGs; localized secretion of particular
enzymes result in the release of signals to the microenvironment. This molecule is known to affect cell migration, proliferation, and differentiation by facilitating cell signaling that is mediated with the activation of various growth factors (101). Syndecans are proteoglycans that have core proteins that are transmembrane; glypicans are bound to the plasma membrane via
18
influencing facets of the signal transduction processes that regulate cell growth and
differentiation (101). Fibroglycan is also localized in the basement membrane and has also been seen to have a role in the development of the liver (110).
Extracellular Matrix Gradients in Fetal versus Adult Livers
The liver is an incredibly dynamic organ that changes throughout fetal development and there are variations in the proportions of matrix molecules in the fetal liver as compared to a mature liver. The fetal liver can be characterized as labile and is predominantly comprised of type III, IV, and V collagens as well as laminins, hyaluronans and minimally sulfated
proteoglycans. Mature livers are much more stable and have a distinct matrix molecule composition that consist of type I, III, IV, V, VI and XVIII collagens as well as fibronectins, laminins, and the proteoglycans. The matrix chemistry in the stem cell niche is only partially defined but include hyaluronans, type III collagen, fetal forms of laminins (e.g. laminin 5) and minimally sulfated CS-PGs. The cells that are immediately outside of the stem cell niche (e.g. hepatoblasts) are associated with hyaluronans, type IV and V collagens, fetal laminins and minimally sulfated forms of HS-PGs. With progression across the acinar plates, there is an increase in more sulfated HS-PGs that qualify as HP-PGs at sites near the central vein. Such gradients in the matrix appear in the second and third months of gestation in humans (106, 111, 112).
19
Tissue-specific Extracellular Matrix Extracts Generated by Decellularization Methods Organs and tissues can be decellularized to provide a matrix extract that reproduces the tissue-specific ex vivo environments used in directing and maintaining the differentiation of both mature and stem/progenitor hepatic phenotypes in vitro (8, 116-118). Isolated extracellular matrices, prepared by the decellularization of organs, provide important sets of these regulatory signals to the cells and act as a more native substratum than tissue culture plastic, purified individual matrix components (e.g. collagen or fibronectin), and even mixtures of matrix components (119-121). The importance of the interactions between the complexity of the extracellular matrix and cells has been confirmed and further investigated in a variety of tissues and organs (122-126). However, further studies need to be performed to determine how this decellularized matrix can be best utilized to support the ex vivo maintenance of these cells. Liver scaffolds generated by a variety of decellularization procedures have been recellularized with hepatocytes in hopes of culturing the cells in an environment that mimics the native liver as close as possible (127-130).
The use of decellularized tissue in the culture of cells allows for a more natural
representation of the various biological, chemical, and mechanical properties found in the native liver. The process of decellularization maintains the structural integrity of the organ while
preserving the necessary molecular components important in maintaining cell viability and function in an acellular scaffold (7, 131-134). Success of these decellularization procedures has implications in the use of these scaffolds not only in the culture of cells but also in the future for organ transplantation of liver lobes prepared by using a human liver scaffolds recellularized with human cells and perhaps even autologous cells (135).
20
exonucleases. Chemical procedures used have included acidic or alkaline solutions as well as ionic, non-ionic, and zwitterionic detergents among others. These procedures each result in a scaffold with distinct sets of matrix molecules at varying concentrations (134). Procedures that utilize alkaline and acidic solutions typically remove the majority of the cellular components while preserving the structural integrity and the collagens but eliminate important molecules such as the GAGs (136-138). The use of non-ionic solutions such as Triton X-100 has been shown to remove all the GAGs in certain tissue types (139). Decellularization with this solution has also led to the loss of laminin and fibronectin, cellular material remaining after treatment, and the alteration of certain mechanical properties (139). Ionic detergents such as SDS also often lead to mechanical deformation and the removal of the GAGs while preserving the collagens (140) but the SDS binds tightly to the matrix extract and can be toxic. Another ionic detergent utilized is sodium deoxycholate (SDC), a bile salt that at low concentrations is
reasonably gentle (141, 142). CHAPS, a zwitterionic solution, changes the mechanical integrity of the scaffold (143).
The procedures that have seen the most success in the decellularization of organs generally utilize a combination of these solutions. Uygun et al. and Ott et al. have utilized a combination of SDS, Triton X-100, and water to fully decellularize the heart and liver tissue respectively (127, 144). The decellularized heart retained most of the cross-linked type I and III collagens, laminin, fibronectin, and GAGs but the non-crosslinked collagens and nascent (newly synthesized) collagens and factors bound to them are lost. Additionally, some (but not all) of the structural properties were preserved.
Decellularization of the liver with these solutions resulted in a scaffold that retained most of the cross-linked type I and IV collagens and fibronectin (127). However, only 50% of the GAGs remained and the majority of the laminin was lost. Baptista et al. utilized a combination of Triton X-100 with ammonium hydroxide and long washes with distilled water to fully
21
collagen and some of the cross-linkedtype I, III, and IV collagen, laminin, and fibronectin. In summary, all of these procedures retain subsets of the matrix components, primarily those that can survive low ionic strength buffers or distilled water.
The most successful procedures have been a protocol derivative of the methods of Ted Miller (145, 146), a collagen chemist at the University of Alabama and who made use of buffers with specific salt concentrations to keep
collagens insoluble. He prepared extracts with high salt buffers keeping all the collagens insoluble and then used a stepwise dilution of the buffers to isolate specific collagen types in solution. This strategy was used with great success to isolate specific collagen types. Rojkind et al. utilized a protocol derived from these methods to isolate matrix extracts that could be used for cell culture (147). This sequential solubilization of the tissue resulted in a scaffold that retained >85% of the native collagens including the cross-linked and uncross-linked collagens plus some of the nascent collagens. Frozen sections of the matrix extracts, called “biomatrices”, were used as substrata for the culture of liver cells and were able to keep the cells viable and functional for more than a year in culture. The cells did not grow unless the biomatrices were prepared from regenerating liver (148).
22
This protocol was furtherimproved by modifications
reported by Wang et al. who used a very gentle delipidation step that combined dilute sodium
deoxycholate (a bile salt) in combination with phospholipase A2. Delipidation was achieved in 10-20 minutes, which was then followed by a sodium chloride buffer with a concentration ranging from 3.4-3.5M needed to keep all of the collagens in the liver insoluble (8). The resulting enriched matrix extract, termed biomatrix scaffolds, retained >98% of the collagens (of all known collagen types in the liver and including the cross-linked, non-crosslinked, and nascent forms) as
well as all of the known adhesion molecules (fibronectin, laminin, nidogen). Also retained was elastin and all of the known proteoglycans. Although GAGs not bound to PGS were lost, those associated with the PGS were retained resulting in the ability to preserve physiological levels of all known cytokines and growth factors (including more than 60). Moreover, the location of the various factors correlated with the histology of the tissue.
23
CHAPTER IIMotivation for Studies on Imaging Techniques
Tissue engineering research is a multidisciplinary effort that incorporates the use of resources from various fields to address specific problems more efficiently and effectively. This approach has enabled the research in this field to become more rigorous and has accelerated the progression of these technologies from in vitro and animal studies to quickly becoming realized in clinical applications. As these technologies are developed and improved, the fabrication or isolation of the biomaterials used in these studies becomes increasingly
complicated and requires more sophisticated tools of evaluation. To properly develop advanced tissue engineering constructs, versatile imaging methods are needed that allow the evaluation and monitoring of morphological changes in the construct while acquiring functional and molecular information. Many current studies still utilize the traditional tools of imaging that include the typical histological techniques. However, these methods are limited in the
information they can provide particularly when utilized in preclinical studies. The visualization of these matrix extracts with the traditional methods is done typically with an endpoint assay (e.g. histology, immunohistochemistry, electron microscopy) and necessitates the destruction of the sample. This severely limits the ability for researchers to gather information during
24
such novel ultrasound technologies – ones that are non-invasive and non-destructive in the evaluation of biomatrix scaffolds.
The biomatrix scaffolds that were produced by the protocols from Wang et al, 2011 were subjected to imaging using novel ultrasound imaging technologies developed in Dr. Paul
Dayton’s laboratory at UNC. Biomatrix scaffolds preserve the most matrix components of any known scaffold preparation and are unique in preserving the components in accurate
25
CHAPTER IIIFunctional Ultrasound Imaging for Assessment of Biomatrix Scaffolds Used for Liver Organoid Formation1
Synopsis
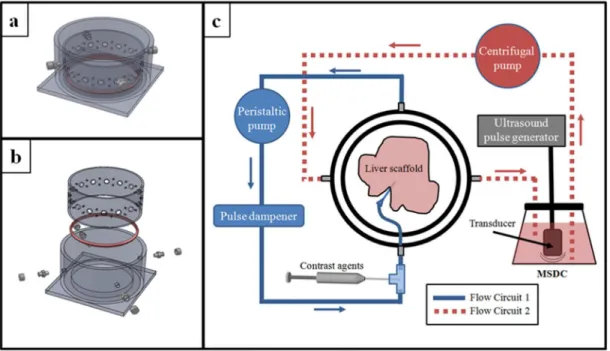
A novel form of 3D functional ultrasound imaging has been developed to enable non-destructive assessment of extracellular matrix scaffolds that have been prepared by decellularization protocols and are intended for recellularization to create organoids. A major challenge in organ decellularization is retaining patent microvascular structures crucial for nutrient access and functionality of organoids. The imaging method described here provides statistical distributions of flow rates throughout the tissue volumes; 3D vessel network
architecture visualization; characterization of microvessel volumes and sizes; and delineation of cells from portal circuits. The imaging protocol was tested on biomatrix scaffolds that are tissue-specific, but not species-tissue-specific, matrix extracts, prepared by a process that preserved >98% of the collagens, collagen-associated matrix components, and matrix-bound growth factors and cytokines. Image-derived data are discussed with respect to assessment of scaffolds followed
26
by proof-of-concept studies in organoid establishment using Hep3B, human hepatoblast-like cells. Histology showed that the cells attached to scaffolds with patent vasculature within
minutes; achieved engraftment at near 100%; expressed liver-specific functions within 24 hours; and yielded evidence of proliferation and increasing differentiation of cells throughout the two weeks of culture studies. This imaging method should prove valuable in analyses of such matrix scaffolds.
Introduction
Liver transplantation is the primary treatment for end-stage liver disease (149). Currently, more than 16,000 adults and children are on the national list for liver transplants. Unfortunately, the number of livers available for transplantation are approximately 5-6,000/year (150). An alternative to organ transplantation is to support patients using an extracorporeal liver assist device (LAD). A LAD is a bioreactor comprised of liver cells isolated from donor livers and incorporated into a network of hollow dialysis fibers that mimic blood vessels, which is able to connect to the patient and thus able to serve as a bioartificial liver (151, 152). Such bioartificial liver devices provide temporary relief for one to two weeks or until an organ is available for transplantation. They cannot be used longer, since liver cells seeded into all extant forms of bioreactors attach and deposit extracellular matrix and other cellular components onto the hollow fibers, causing “fouling” or clogging of the fibers’ pores, limiting the life span of the device (153).
A more robust alternative is to develop human liver organoids that can be incorporated into a LAD to enable hemodialysis; this provides a more stable and fully functional bioartificial liver in which vascular channels are provided by the native extracellular matrix components lined by endothelia. The organoids can be formed by preparing matrix scaffolds from
27
first, the vascular channels are recellularized with endothelia through which medium and then blood can be perfused; and second, the rest of the matrix is recellularized with a combination of hepatic and mesenchymal stem cell populations that will mature into fully functional liver
parenchymal cells along with their mesenchymal cell partners. Current efforts are making use of human hepatic cell lines for human liver organoid formation to establish optimal
recellularization protocols. Successful protocols will then be used with freshly isolated human hepatic and mesenchymal stem cell populations and endothelia.
For recellularized scaffolds to yield a human liver organoid able to support patients as a bioartificial liver, cell functions must be comparable to those of normal human livers. Since cell seeding and organoid functionality are directly related to the patency and structure of
microvascular matrix remnants in the scaffold, there is a crucial need for non-destructive assessment of the structural characteristics of the scaffold, particularly its vascular matrix. Without adequate perfusion, the process of reseeding biomatrix scaffolds with new cells cannot be accomplished, since this process relies on fluid transport through the matrix remnants of the vascular bed for the delivery of the cells. Also, after cells have been engrafted throughout the scaffolds, their continued functions depend on a long-term delivery of nutrients and oxygen. For this reason, a method to image both the anatomy and flow within the sample in a
non-destructive manner is highly desirable.
28
modalities have the best field of view, although they require expensive hardware (particularly MR imaging). MR can also require long image acquisition times. On the other hand, CT suffers from poor soft tissue contrast and can cause radiation damage to cells. Ultrasound has many benefits over MR and CT in that it is real-time, relatively inexpensive, non-invasive, does not use ionizing radiation, and has excellent soft-tissue contrast. In addition, ultrasound is able to assess multiple different qualities of a tissue volume (applicable to both in vivo volumes and in vitro biomatrix scaffolds), including tissue structure with standard b-mode (159), mechanical stiffness (160), microvascular perfusion architecture (161), and parametric perfusion rate (162). One possible challenge hindering ultrasound’s utility for scaffold perfusion assessment to date has likely been the modality’s limited field of view, allowing for freehand visualization of different 2D slices, or small 3D sub-volumes, but traditionally not visualization or quantitation of a large field of view. Our objective in this study was to explore the application of ultrasound to perform 3D visualization and quantification of perfusion throughout a biomatrix scaffold.
In these studies, we have developed a protocol to enable detailed assessment of vascular structural and functional characteristics within scaffolds in a non-destructive manner. We have had two objectives: the first has been to explore the application of ultrasound to perform 3D visualization and quantification of perfusion throughout an extracellular matrix scaffold, here being biomatrix scaffolds; the second has been to demonstrate using of an hepatic cell line, Hep3B, that the imaging assessments can identify scaffolds that will be successful for cell seeding and nutrient delivery to create human liver organoids.
Materials and Methods
Decellularization of Rat Livers
29
experiments. All experimental work was approved by and performed in accordance with the UNC Institutional Animal Use and Care Committee guidelines.
The protocol for decellularizing livers to produce biomatrix scaffolds has been described previously (8). Images of tissue in the process of decellularization are given in the online
supplement Figure S1, and results using this protocol are compared to results using other decellularization protocols (Table S1). Male rats were anesthetized with Ketamine-Xylazine, and their abdominal cavity opened. The portal vein was cannulated with a 20-gauge catheter to provide a perfusion inlet to the vasculature of the liver, and the vena cava was transected to provide an outlet for perfusion. The liver was removed from the abdominal cavity and placed in a perfusion bioreactor. The blood was removed by flushing the liver with 300 ml of serum-free DMEM/F12 (Gibco, Grand Island, NY). A delipidation buffer, comprised of 36 U/L of
phospholipase A2 in 1% sodium deoxycholate (Fisher, Pittsburgh, PA) was used to remove plasma and nuclear membranes, and was perfused through the liver for ~30 minutes (up to an hour) or until the tissue became transparent.
30
bioreactor into the sample imaging chamber (Figure 1). When in the sample imaging chamber, perfusion was maintained at 4 ml/min through the matrix scaffold remnant of the portal vein via the same peristaltic pump.
Contrast Imaging
An overview of the image data processing workflow is provided (Figure 2). Flash replenishment imaging was performed using an Acuson Sequoia 512 equipped with a 15L8 transducer (Siemens Medical Solutions USA Inc, Mountain View, CA). The “CPS Capture” software algorithm was used to measure perfusion time. The 3D images of the liver biomatrix scaffold were acquired by scanning the transducer in the elevational direction using a linear stage and motion controller (UTS150PP and ESP300, Newport, Irvine, CA) interfaced through LabVIEW (National Instruments, Austin, TX) as described by Feingold et al (162). Perfusion images were parametrically mapped to contrast arrival times between 1 and 10 seconds. These images were stored in DICOM format with JPEG compression and analyzed offline in MATLAB (Mathworks, Natick, MA). Perfusion times within the regions of interest were assessed.
Acoustic angiography was performed on a prototype dual frequency probe (163) with imaging parameters previously described (161). The imaging system was a VisualSonics Vevo770 (Toronto, ON, Canada), with pulses emitted at 4 MHz at 1.23 MPa, and echoes received on a 30 MHz transducer with 100% bandwidth after being passed through a 15 MHz high pass filter to remove non-contrast signal. Three-dimensional images were acquired with the VisualSonics 1D linear motion stage with inter-frame distance of 100 µm to yield nearly isotropic voxels. Images were acquired with a frame rate of 2 Hz, with 5 frames averaged at each
31
magnetic resonance angiography images, as previously demonstrated by our group (161). These segmentations yielded XYZ points with subvoxel spacing along vessel centerlines, with estimates of vessel radii at each location. These segmentations were used to assess vessel network architecture.
All three scaffold samples imaged required the registration of multiple sub-volumes for holistic visualization. Perfusion rate information required two sub-volumes for all samples, while the anatomical information and acoustic angiography data required three sub-volumes for sample #1, and two for samples #2 and #3. Once completed, the acoustic angiography data was displayed via maximum intensity projections (MIPs) (Figure 3). Anatomical b-mode data cannot be displayed in this fashion, so XZ slices through the merged volumes were displayed.
Imaging the Biomatrix Scaffolds
Image acquisition for each sample (Figure 4, Panels 1 and 2) required approximately 50 minutes total, due to the small step sizes used in each case to obtain high resolution images (800 µm steps for the anatomical and perfusion images, and 100 µm steps for the acoustic angiography). Standard grayscale ultrasound images provided reference for the scaffold “anatomy” but provided no functional information. Acoustic angiography provided high-resolution images of the branching microvasculature structure, with no tissue background. Perfusion imaging provided spatial distributions of local flow rates (images not shown). All image sets were co-registered using major anatomical landmarks. Total field of view for the regions of interest acquired was approximately 4 x 4 x 3 cm (axial x lateral x elevation) for the anatomical and perfusion images, and approximately 4 x 3 x 1.4 cm for the acoustic
32
Scanning Electron Microscopy (SEM)Samples of normal rat liver versus rat liver biomatrix scaffolds were fixed with 4%
buffered formaldehyde and examined by SEM at high vacuum (Quanta 200 Field Emission Gun, FEI™, Hillsborough, OR) at the Chapel Hill Analytical and Nanofabrication Laboratory on the UNC campus.
Recellularization of Biomatrix Scaffolds
Biomatrix scaffolds with intact vasculature were seeded with human hepatoblast-like cells, Hep3B cells (ATCC® HB-8064™). These cells were introduced by perfusion through the
matrix remnants of the portal vein via a peristaltic pump (Masterflex, Cole-Parmer, Vernon Hills, IL) (see Figure S3) and cultured in Hep3B medium (DMEM + 10% Fetal Bovine Serum). Approximately 130 x106 cells were perfused into a scaffold in steps with 20 minutes intervals. During each interval, 30 x106 cells were perfused at 15 ml/min for 10 minutes, followed by 10 minutes of rest (0 ml/min). This was repeated 4 times. Once all of the cells were introduced into a biomatrix scaffold, the flow rate was lowered to 1.3 ml/min and the scaffolds were perfused with the culture medium. The medium was changed after 24 hours and again every 3 days.