How Streets Adapt to New Generation Transportation?
–––
Analysis of Ridesourcing Pick-up and Drop-off Hot-spots and
Street Improvement Design based on Trajectory Data
Chenqi Zhu
Abstract
Urban mobility is rapidly evolving in recent years with the flourish of ridesourcing. This new generation transportation offers more convenient options for point to point trips but at the same time generates more conflicts between pedestrians, cyclists, transit and other vehicles. This study discussed how streets adapt to new generation transportation based on 3,128,027 ridesourcing trips in Xi’an, China. I first identified ridesourcing’s pick-up and drop-off hot-spots in Xi’an using DBSCAN and Getis-Ord Gi statistics, and then analyzed hot-spot locations from the street scale. I found hot-spots in Xi’an mainly located on the city’s main axis and Ring Roads surrounding by five different land use types. Finally, a ridesourcing pick-up and drop-off design in highly mixed land use area was showcased.
Key Words
Table of Contents
Abstract ... 2
Key Words ... 2
1. Introduction ... 4
2. Literature Review... 6
2.1 Applications of Trajectory Data in City Studies ...6
2.2 Influence of Ridesourcing on Urban Transportation ...7
3. Data and Proposed methodology ... 8
3.1 Study Area ...8
3.2 Data ...9
3.3 Methodology ...9
4. DBSCAN and Hot-spots Results ... 11
4.1 Temporal Distribution ... 11
4.2 Spatial Distribution... 11
5. Street Scale Analysis... 13
5.1 Type 1 – Highly Mixed Land Use Area ... 14
5.2 Type 2 –University City ... 17
5.3 Type 3 – Hospital ... 18
5.4 Type 4 – Xi’an Railway Station and Intercity Bus Station ... 18
5.5 Type 5 – Tourist Attraction ... 19
5.6 Showcase ... 20
6. Conclusion ... 22
1. Introduction
Since 2010, a number of private companies have entered the transportation services market by offering new travel options that use digital technology to provide an on-demand and highly automated private ride service. This kind of company was first defined in 2013 by the California Public Utilities Commission as Transportation network company (TNC). To better convey the information of TNC’s technology – a platform used to “source” rides from a driver pool, the term of ridesourcing is more frequently used in the academic field (Shaheen S, et al, 2017). But industry field often uses “ride-hailing” to describe the service offered by TNCs. In this paper, I refer to Didi Chuxing as TNC and use ridesourcing for Didi Express and premier drivers’ service.
TNCs have expanded rapidly in cities worldwide. The most well-known of the transportation network companies, may be Uber and Lyft in the United States, and Didi Chuxing in China. Actually, TNCs’ history isn’t that long. Uber first came onto the scene in 2009 launched by Garrett Camp. By the summer of 2012, UberX was introduced, allowing people to drive for Uber using their own vehicles, subject to meeting certain vehicle standards. After beta testing in the SF bay area, Uber launched UberPOOL – an option to carpool with the same app – in the summer of 2014. Later that year, Uber launched UberEats to deliver food to consumers (Movmi, 2018).
DiDi Chuxing – now the second largest transportation network company in the world – was founded in June of 2012, an app for consumers to request taxis for immediate pick up and later allowing consumers to reserve taxis for the next day. Today Didi is one of the major taxi apps in China, with over 100 million users in more than 300 cities. In 2017, there are 7.43 billion mobile travel services provided by Didi in China, which is equivalent to an average 5 times using Didi service per people per day.
lower costs. On the other hand, it also reduces transportation efficiency when it competes with public transit during rush hours in high-density areas (Scarlett T. 2019).
This paper focuses on ridesourcing’s pick-up and drop-off locations (PUDOs). I first used Didi’s trajectory data to find out hot-spots of PUDOs because transportation in these places is more likely affected by TNCs' service, and then picked seven hot-spots and categorized them into five types based on their surrounding facilities. Finally, from a street-level scale, I did a more detailed analysis based on street view images, and satellite images including land use, road sections, parking space, traffic flow.
I believe that this study has three major contributions. First the TNC services have dramatically increased in China in the last four years. It significantly changed the traditional travel pattern for China, especially in big cities like Xi’an. However, most cities have not prepared for such changes either politically or physically. This study will offer recommendations for Xi’an TNC services to mitigate the potential issues for future transportation. Second, the recommendations for Xi’an are summarized into guidelines to offer more generalizable advice for other cities facing the challenges of increasing TNC services. Third, I believe the study is an initial example of the new era urban street transition of adapting the new technologies.
2. Literature Review
2.1 Applications of Trajectory Data in City Studies
Trajectory data discovers and visualizes available structure in movement patterns of mobile objects and has numerous potential applications in traffic control and urban planning. Therefore, scholars have been utilizing trajectories data to do research in various fields.
Based on GPS trajectories, Zheng Y(2015) introduces applications in human activity recognition, driving, and location-based social network. Zheng Y (2011) also detects flawed urban planning using the GPS trajectories of taxicabs traveling in urban areas. The results evaluate the effectiveness of the carried out planning, such as a newly built road and subway lines in a city. Yang (2018) constructs a trajectory network based on GPS to analyze Xi’an taxi trip, reveals urban resident activities’ spatial characteristics, movement rules and the mutual influence of urban functions’ spatial layout and resident activities. Wang Z (2013) presents an interactive system for visual analysis of urban traffic congestion based on GPS trajectories. Yang L (2017) presents the space-time trajectory cube as a framework for
dividing and organizing the trajectory space in terms of three dimensions (origin, destination, and time).
Other research focuses on trajectories data processing and managing. Moein G (2014) propose a method for achieving anonymity in a trajectory database while preserving the information to support effective passenger flow analysis. Zahedeh Izakian (2016) proposes an automated technique for clustering trajectory data using a Particle Swarm Optimization (PSO) approach. Su H (2015) pioneers a systematic approach to trajectory calibration that is a process to transform a heterogeneous trajectory dataset to one with (almost) unified sampling strategies. Khaing Phyo Wai (2017) proposes a method to measure trajectory similarity based on both geographical features and semantic features of motion. And the proposed methods are practically evaluated by using real trajectory dataset. Liu Y (2012) constructs a model that integrates both the geographical heterogeneity and distance decay effect, to interpret the observed patterns. Wang Zuchao (2014) presents a visual analysis system to explore sparse traffic trajectory data recorded by transportation cells. The system checks how traffic congestion on one cell is correlated with traffic flows on neighboring links, and with route selection in its neighborhood.
potential for trajectory data manipulation. Therefore, I choose to use big trajectory data to detect Xi’an potential traffic hot-spots and analyze data with different methods to make the result more convincing.
2.2 Influence of Ridesourcing on Urban Transportation
As an integral part of the new emerging transportation, what kind of impacts does ridesourcing have on urban transportation? Many researchers focus on equity and urban transportation efficiency (Scarlett T. Jin, et al, 2019). In terms of urban equity, some research showed Uber offered cheaper and faster services than taxis in low-income neighborhoods in Los Angeles (Smart et al, 2015), but others think TNCs’ require of user’s credit card excludes the financially underserved population (National Academies of Sciences, Engineering, and Medicine, 2016). Some studies conclude that younger, better-educated people are more likely to use ridesourcing (Clewlow & Mishra, 2017; McGrath, 2015; Rayle et al., 2016; and A. Smith, 2016). Uber and Lyft are also criticized for their gender and racial discrimination (Ge, Knittel, MacKenzie, et al. 2016). But some data shows they extend reliable car access than taxi (Brown, Anne E, 2018)
For ridesourcing’s impacts on urban efficiency, Henao and Marshall (2018) argued hailing leads to approximately 83.5% more VMT than would have been driven had ride-hailing not existed, but ride-ride-hailing passengers tended to have lower car ownerships rates than average. Zhengtian X (2017) investigated the idea of providing parking spaces for those vacant e-hailing vehicles, allowing them to park while waiting for online dispatches. They conclude a time-varying optimal parking provision can balance between reduction of cruising for ridesourcing vehicles and capacity drop of the road system. Qida S and David Z (2018) investigate the morning commute problem with bottleneck congestion and parking space constraints in the presence of ridesourcing service. They also explore the optimal supply of parking spaces and ridesourcing services to manage the commute traffic best.
Although lots of studies have analyzed ridesourcing’s impacts on urban
3. Data and Proposed methodology
3.1 Study Area
Due to the availability of data from Didi, I choose Xi’an as my study area. Xi’an is the largest city in northwest China. It is one of the oldest cities in China and the oldest of the Four Great Ancient Capitals, having held the position under several of the most important dynasties in Chinese history, including Western Zhou, Qin, Western Han, Sui, and Tang. Because of the long history, Xi’an’s road network still maintains the grid pattern as it was in Sui and Tang dynasties. Today’s Xi’an has re-emerged as an important cultural, industrial and educational center of the central-northwest region.
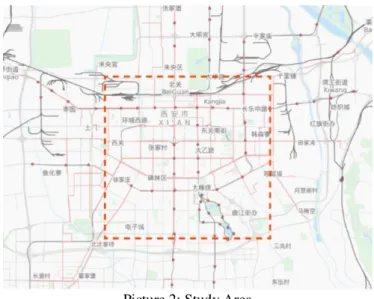
Xi’an has eleven districts and two counties (see picture 1). My study area is within the Second Ring Road of Xi’an, as shown in red dashed line in picture 2. It is the center of the city containing the whole Beilin district and part of Xincheng, Lianhu and Yanta districts. The area is 100 square kilometers with high density of population (see Table 1). Four subway lines run through the area. There are ten universities within this area, including famous Xi’an Jiaotong University.
Picture 2: Study Area
Table 1: Population and Density by district in 2011
District Total Population Percentage Population Density (Persons/km2)
Xincheng 589,739 6.96 19,574.51
Beiling 614,710 7.26 26,298.54
Lianhu 698,513 8.25 18,226.61
Yanta 1,178,529 13.92 7,782.38
(Source: National Bureau of Statistics of People's Republic of China on Major Figures of the 2010 Population Census)
3.2 Data
Trajectory data is from DiDi Express and DiDi Premier drivers within the Second Ring Road of Xi'an City. The data range is from October 1st to October 30th, 2016. The geospatial coordinates of the four corners of bounding box are [108.92309, 34.279936], [109.008833, 34.278608], [109.009348, 34.207309], [108.921859, 34.204946]. The measurement interval of the track points is approximately 2-4 seconds. The track points were bound to physical roads so that the trajectory data and the actual road information are matched. The following table shows the data structure:
Table 2: Cleaned Raw Data provided by Didi
Field Type Sample Comment
Driver ID String glox.jrrlltBMvCh8nxqktdr2dtopmlH Anonymized
Order ID String jkkt8kxniovIFuns9qrrlvst@iqnpkwz Anonymized
Time Stamp String 1501584540 Unix timestamp, in seconds
Longitude String 104.04392 GCJ-02 Coordinate System
Latitude String 104.04392 GCJ-02 Coordinate System
After cleaning the 700 million data, there are 3,128,027 trips. Variables include driver ID, order ID, start latitude, start longitude, start time, end latitude, end longitude, and end time.
Because transportation in hot-spots of PUDO locations is more likely affected by ridesourcing service, I use two different methods to identify these hot-spots – Density-Based Spatial Clustering of Applications with Noise (DBSCAN) and Getis-Ord Gi* Statistic
Analysis tool. Both methods have their own advantages. The Getis-Ord Gi* Statistic Analysis tool is better to identify “point” type cluster that the points is accumulated at a very small spatial spot location, while the DBSCAN is a method better to identify non-point shape cluster which would be line or cross shape along the street and intersection.
3.3.1 Density-Based Spatial Clustering of Applications with Noise
Density-Based Spatial Clustering of Applications with Noise is a data clustering algorithm proposed by Martin Ester, Hans-Peter Kriegel, Jörg Sander and Xiaowei Xu. It is a density-based clustering algorithm: given a set of points in some space, it groups together points that are closely packed together (points with many nearby neighbors), marking as outliers points that lie alone in low-density regions.
3.3.2 Getis-Ord Gi* Statistic Analysis
The analysis tool calculates the Getis-Ord Gi* statistic for each feature in a dataset. This tool works by looking at each feature within the context of neighboring features. A feature with a high value is interesting, but may not be a statistically significant hot spot. To be a statistically significant hot-spot, a feature will have a high value and be surrounded by other features with high values as well. The local sum for a feature and its neighbors is compared proportionally to the sum of all features; when the local sum is much different from the expected local sum, and that difference is too large to be the result of random chance, a statistically significant Z score results.
4. DBSCAN and Hot-spots Results
4.1 Temporal Distribution
During National Day’s holiday (October 1st to 7th), trip volume maintains at a high level, more than 110,000 trips every day. After the holiday, there is a steep decline in demand. Weekends have more trip volume than weekdays (Figure 1). Monday has the lowest trips (Figure 2).
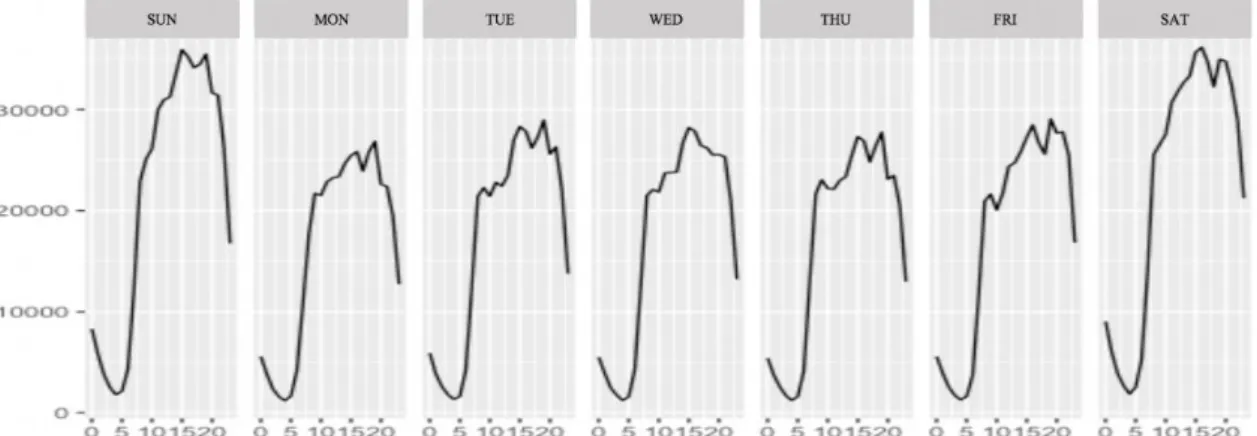
From average hourly trip volume graphs (Figure 3 and 4), we can clearly see two peaks in a day – 15:00 and 19:00. In the morning, there is a minor peak at around 8:00. The evening also has a minor peak at 21:00. Considering Xi’an’s highly mixed-use land feature, it is very unlikely to predict trip purpose based on origin and destination locations. Therefore, from trips’ temporal distributions, peaks at 8:00, 15:00, 19:00 and 21:00 might indicate people use risesourcing service mainly for commute and recreation.
Figure 1:Daily Trip Volume 10.1-10.30 Figure 2:Average Trip Volume for a Week Figure 3:Average Hourly Trip Volume
Figure 4: Hourly Trip Volume by Day (with hours of each day on the bottom)
4.2 Spatial Distribution
city wall. The second is at the Changle Park subway station, and the third one is at the intersection of Kechuang Road and Rongxin Road, which is located in the same area as the highest pick-up location.
Figure 5: Pick-ups DBSCAN Result Figure 6: Drop-offs DBSCAN Result
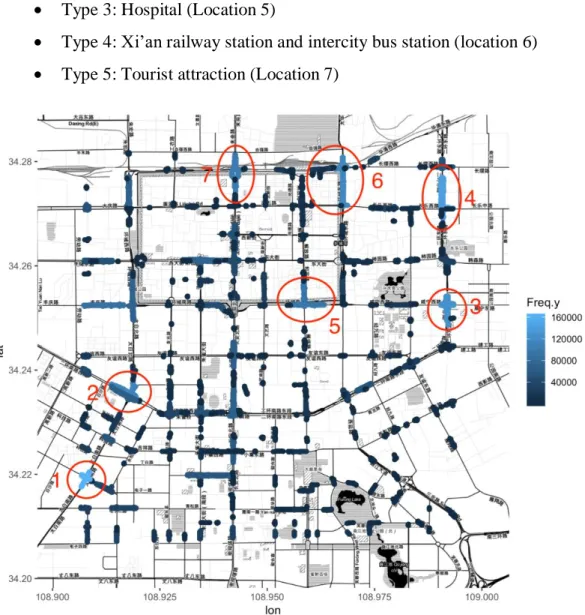
Getis-Ord Gi* statistic results show the location with clustered pick-up and drop-off points (Figure 7). Figure 8 shows the total PUDOs’ spatial distribution. Combining these two graphs, I found that significant hot-spots are located on the city’s main axis, Ring Roads and tourism areas such as the drum tower and city wall.
Figure 7: Total PUDOs Hot-spots Figure 8: PUDOs DBSCAN Result
5. Street Scale Analysis
Most streets in Xi’an are not designed for TNC pick-up and drop-off. The most common solution now is using the bike lane or rightmost lane as a temporary place for picking up and dropping off passengers. In Xi’an, most streets still have an independent bike lane, some even have green belt to separate it from car lanes. However, allowing vehicles into the bike lanes creates risks for cyclist and pedestrians. For those streets don’t have a bike lane, pulling vehicles over to the rightmost lane will cause congestion and create risks for vehicles in-motion.
To do a more detailed street-level analysis, I picked seven PUDO locations (red circles in Figure 9) according to DBSCAN and Hot-spots results, and divided these locations into five types based on their surrounding facilities.
• Type 1: Highly mixed land use area (Location 1, 2 and 4)
• Type 2: University city (location 3)
• Type 3: Hospital (Location 5)
• Type 4: Xi’an railway station and intercity bus station (location 6)
• Type 5: Tourist attraction (Location 7)
5.1 Type 1 – Highly Mixed Land Use Area
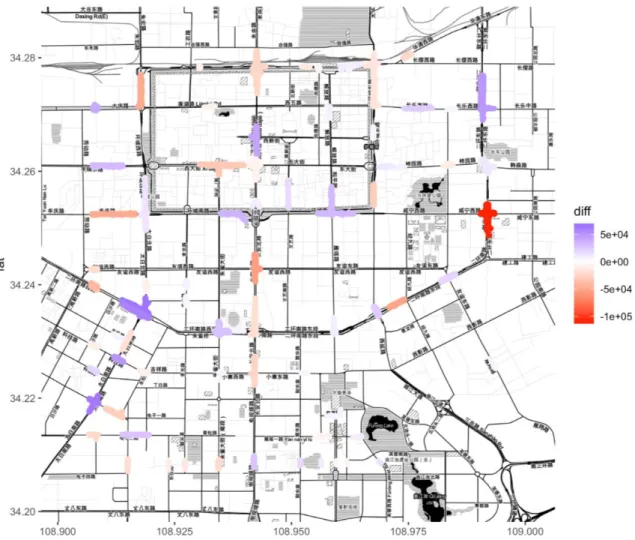
In type 1, three locations are all highly mixed land use. Location 1 is at the intersection of Taibai Road and Keji Road. North of the intersection is office and commercial buildings. South of the intersection is a pedestrian mall. West and east are colleges and dormitories (Table 3 land use). Figure 10 shows the difference between pick-ups and drop-offs. Red represents drop-offs are more than pick-ups, while purple means pick-ups are more than drop-offs. Usually, pick-up will cause more congestion than drop-off because drivers need to pull over for several minutes to wait for passengers to reach the location and find the car. Location 1 is a hot-spot with the highest frequency of PUDOs and more pick-ups. Therefore, it needs a design for TNC drop-off and pick-up.
Because PUDOs are clustered around the intersection, I choose to focus on street sections close to the intersection (Table 3 road sections). Taibai road has two bus stops and total of 20 bus routes. There are shared bus and bike lanes on the road. With nine bus routes sharing the same bus stop, buses have difficulty pulling over, which sometimes causes congestion even without TNC’s service. Therefore, Taibai road is not suitable for creating temporary street parking for ridesourcing. However, east of Taibai road is an underground pedestrian mall with large ground parking. I would suggest utilizing plaza and ground parking to design an area for TNC pick-up and drop-off. This TNC PUDO area could be multifunctional. For example, if designed with a shelter, not only passengers who are waiting for pick-up would benefit from it, people shopping in the mall will also be attracted to this area to take a rest. Adding open seating areas and public art will make this PUDO area become an activity focal point and brings livability and vibrancy to the pedestrian mall.
The aforementioned design method can be used to the north of the intersection as well because this office/commercial mixed-use building also has a plaza and parking space. Keji Road has street parking and bike lane separated from car lanes with a green belt. For the street side that next to the university and dormitories, I recommend to harness street parking space and set signage for temporary picking up and dropping off passengers. We can use the same method of location
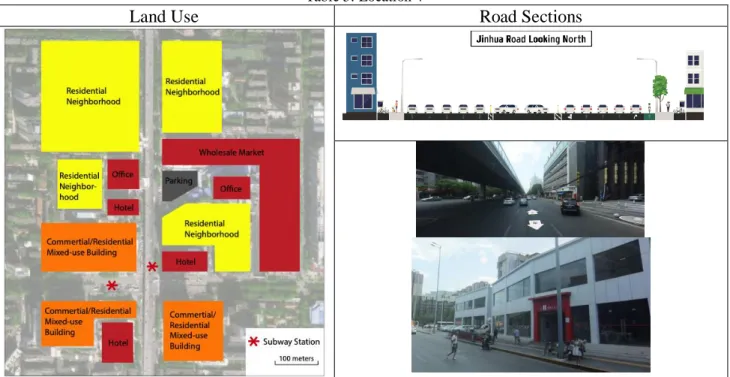
Changle Road (Table 5). Different from hot-spots where PUDO clustered at the intersection like location 1 and 2, this hot-spot is more belt shaped along Jinhua Road. There are office buildings, residential neighborhoods, commercial/residential buildings, wholesale market and hotels around this hot-spot. There is also a subway station at the intersection. Location 2 and 4 are both areas that pick-ups more than drop-offs (Figure 10). When setting PUDO areas in location 2 and 4, it is the same with location 1 by utilizing street parking, commercial plaza and ground parking.
One special area in location 4 is a subway station with two entrances and exits. From the picture, we clearly see a bike-sharing station in front of the entrance/exit. Thus, designing a PUDO location beside a subway station helps ridesourcing better connect with other modes and encourages the ridership of public transit.
Table 3: Location 1
Land Use Road Sections
Table 4: Location 2
Table 5: Location 4
Land Use Road Sections
5.2 Type 2 –University City
Location 3 is a university city. The intersection is surrounded by Xi’an Jiaotong University and Xi’an University of Technology (Table 6). It also has a subway station. This location is different from the locations in type 1 because drop-offs in this area are much more than pick-ups (Figure 10), about one hundred thousand. The total PUDOs in location 3 is one hundred and twenty thousand. Therefore, this location is the main drop-off destination rather than a pick-up area. Considering this, creating specific ridesourcing pick-up locations is not necessary. But the city can set new signs to guide ridesourcing drivers to slow down before they enter the university area and use the right shared lane which is separated from main lanes by green belt when they are close to passengers’ drop-off locations.
Table 6: Location 3
5.3 Type 3 – Hospital
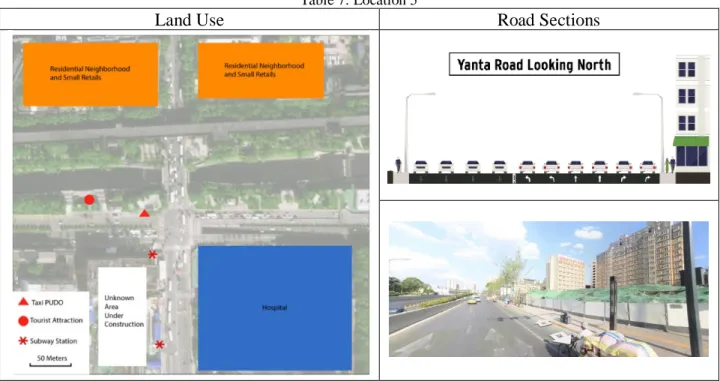
Location 5 is at the intersection of Heping Road and First Ring Road. South-east of the intersection is a hospital (Table 7). A subway station is located at this hot-spot. North-east of the intersection is a tourist attraction. This is a busy intersection with large traffic volumes, and both Heping Road and First Ring Road have eight lanes. The aim here is to reduce ridesourcing’s conflicts with other vehicles and pedestrians whose destination is the hospital, and make sure passengers who go to or leave tourist destination to get off/on ridesourcing as quick as possible. For the tourist attraction, ridesourcing can share an existing PUDO area designed for taxies. For the hospital, the street design needs to consider huge morning peak flow for people going to outpatient and inpatient. Therefore, some temporary parking space and waiting line need to be planned near the entrance of the hospital.
Table 7: Location 5
Land Use Road Sections
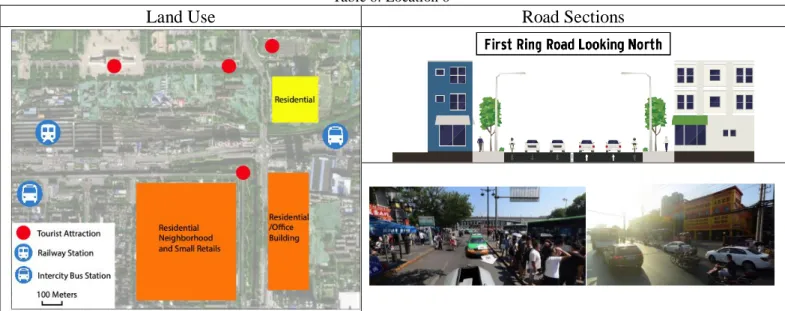
5.4 Type 4 – Xi’an Railway Station and Intercity Bus Station
for ridesourcing. Traffic is chaotic in front of wo intercity bus stations, and even taxi floe and parking are out of control. To solve problems in these areas, I think organizing traffic flows is more important. If the railway station already had a clear route guide for private vehicles’ PUDO, then it only needs to open a zone for ridesourcing vehicles’ PUDO.
Table 8: Location 6
Land Use Road Sections
5.5 Type 5 – Tourist Attraction
Table 9: Location 7
Land Use Road Sections
5.6 Showcase
In order to show how a hot spot area might change after considering ridesourcing’s pick-up and drop-off, I redesigned location 2 in type 1 – highly mixed land use. From previous street scale analysis, we have already known that there is a shopping mall next to the Taibai Road and the design of ridesourcing PUDO zone can combine with commercial plaza and ground parking.
Taibai shopping mall is a redeveloped project finished in 2018. The total construction area of the project is 125,540 square meters, and the commercial floor is B1-L5 with a total of 1373 parking. Taibai shopping mall also provides recreation, leisure and food service, which makes it a popular destination for residents. Looking at picture 3, traffic flow in this area is quite complex. There are a one-way road and an elevated highway around the commercial plaza. The plaza provides open space for activities and ground parking. Underground parking entrance/exit are located at the two sides of the plaza. A bus stop on Taibai Road is near the underground parking entrance. Except for a pedestrian bridge directly accessed to the mall’s second floor, there are two main entrances for pedestrian – one between underground parking entrance and pedestrian bridge and the other near the underground parking exit. Therefore, ridesourcing drivers always pick up and drop off passengers at these two entrances. At the first entrance, ridesoucing affects buses pulling over and vehicles going to underground parking. At the second entrance, ridesourcing’s PUDO generates congestion on the one-way road and conflicts with vehicles going out from the underground parking.
to rest while waiting for ridesourcing service (see picture 5). The shelter also contains an elevator to the underground floor. The color and the shape should make the PUDO shelter easy to find. After reorganizing circulations of ridesourcing vehicles and other traffic (see picture 4). The impact of ridesourcing PUDO will be minimized.
Picture 4: PUDO zone and Circulations
6. Conclusion
In viewing of hot-spots temporal and spatial distribution, there are some features of TNC Trips I found: 1) within a whole weekday, there is a small morning peak compared with general transportation; 2) if exclude morning commute. Potential trip purposes are home-based none work trip and none home-based trip; 3) TNC data has a potential bias to reflect the whole sample of trips; 4) PUDO Hot-spots in Xi’an are located on city’s main axis, Ring Roads and tourism areas.
In Xi’an, lots of PUDOs located at the intersections where surrounding areas are highly mixed land use. Because young people are more likely to use ridesourcing, University City is the largest drop-off hot-spot. The other three hot-spots are hospital, Xi’an railway station and intercity bus station, and tourist attraction. Seven hot-spots have different problems based on their street sections and land use type. Accordingly, following suggestions of street design and regulatory policy are made for each type of TNC PUDOs.
• Highly mixed land use areas are the most attractive destination for passengers. Large shopping malls or office buildings with ground parking or plaza are always located in these areas. Therefore, designing a ridesouring PUDO zone with plaza or parking and guiding the ridesourcing flow separate from main streets flow is applicable. In addition, cities and TNCs could work with real estate developers together for PUDO zone’s design by showing them an attractive design will bring livability and thus create more profits. For those areas without plaza and ground parking, cities can use street parking space and set signage for temporary picking up and dropping off passengers.
• Traffic calming is suitable for University City since no specific pick-up locations need to be designed. Cities can set signs such as to guide ridesourcing drivers to slow down before they enter the university area and use the lane which is separated from main lanes by green belt when they are close to passengers’ drop-off locations.
• For the hospital, the street design needs to consider huge morning peak flow for people going to outpatient and inpatient. Therefore, some temporary parking space and waiting line need to be planned near the entrance of the hospital.
• A clear route guide for private vehicles’ PUDO and a zone for ridesourcing vehicles’ PUDO is recommended for the railway station and intercity bus station.
Reference
Alemi, F., Circella, G., Mokhtarian, P., & Handy, S. (2018). Exploring the latent constructs behind the use of ridehailing in California. Journal of Choice Modelling, 29(August), 47–62. https://doi.org/10.1016/j.jocm.2018.08.003
Brown, A. E. (2018). Ridehail revolution: Ridehail travel and equity in Los Angeles (Doctoral dissertation, UCLA).
California Public Utilities Commission. (2013). Decision Adopting Rules and Regulations to Protect Public Safety while Allowing New Entrants to The Transportation Industry. Chan, N. and Shaheen, S. (2012). Ridesharing in North America: Past, Present, and
Future. Transport Reviews, Vol. 32, No. 1, pp. 93-112.
Chen, L., Lv, M., Ye, Q., Chen, G., & Woodward, J. (2011). A personal route prediction system based on trajectory data mining. Information Sciences, 181(7), 1264–1284. https://doi.org/10.1016/j.ins.2010.11.035
Clewlow, R. R., & Mishra, G. S. (2017). Disruptive transportation: The adoption, utilization, and impacts of ride-hailing in the United States. Report. Davis: Institute of
Transportation Studies, University of California (UCD-ITS-RR-17-07). Corcoran, P. (2016). Topological path planning in GPS trajectory data. Sensors
(Switzerland), 16(12). https://doi.org/10.3390/s16122203
Dewey, O. F and L. Rayle. (2016). How Ridesourcing Went from ‘Rogue’ to Mainstream in San Francisco, Harvard University Graduate School of Design, 41 pages. Available at http://research.gsd.harvard.edu/tut/files/2016/06/San-Francisco-Case-2016.pdf
Ewing, R., & Dumbaugh, E. (2009). The Built Environment and Traffic Safety: A Review of Empirical Evidence. Journal of Planning Literature, 23(4), 347–367.
https://doi.org/10.1177/0885412209335553
Ge, Y., Knittel, C. R., MacKenzie, D., et al. (2016). Racial and gender discrimination in transportation network companies. Working paper no. 22776, October.
http://www.nber.org/papers/w22776.
Ghasemzadeh, M., Fung, B. C. M., Chen, R., & Awasthi, A. (2014). Anonymizing trajectory data for passenger flow analysis. Transportation Research Part C: Emerging
Technologies, 39, 63–79. https://doi.org/10.1016/j.trc.2013.12.003
Henao, A., & Marshall, W. E. (2018). The impact of ride - hailing on vehicle miles traveled.
Transportation, (0123456789). https://doi.org/10.1007/s11116-018-9923-2
Henderson, J. (2013). Street Fight: The Politics of Mobility in San Francisco. University of Massachusetts Press, Amherst.
Li, R., Ruan, S., Bao, J., & Zheng, Y. (2017). A Cloud-Based Trajectory Data Management System. Sigspaial, 3–6. https://doi.org/10.1145/3139958.3139990
Liu, Y., Kang, C., Gao, S., & Xiao, Y. (2012). Understanding intra-urban trip patterns from taxi trajectory data, 463–483. https://doi.org/10.1007/s10109-012-0166-z
McGrath, F. (2015). The demographics of Uber's US users. In: GlobalWebIndex. https://www.globalwebindex.net/blog/the-demographics-of-Ubers-us-users.
Movmi. (2018). The Ridehailing Trend: Past, Present, and Future Overview of Ridehailing. Retrieved from: http://movmi.net/ridehailing-trend-overview/
Najaf, P., Thill, J. C., Zhang, W., & Fields, M. G. (2018). City-level urban form and traffic safety: A structural equation modeling analysis of direct and indirect effects. Journal of Transport Geography, 69(May), 257–270.
https://doi.org/10.1016/j.jtrangeo.2018.05.003
National Academies of Sciences, Engineering, and Medicine (2016). Between public and private mobility: Examining the rise of technology-enabled transportation services. Washington, DC: The National Academies Presshttp://dx.doi.org/10.17226/21875. Nyc, C., & Ross, C. L. (2017). New potential for multimodal connection: exploring the
relationship between taxi and transit in New York. Transportation. https://doi.org/10.1007/s11116-017-9787-x
Rayle, L., Dai, D., Chan, N., Cervero, R., and Shaheen, S. (2016). Just a Better Taxi? A Survey-Based Comparison of Taxis, Transit, and Ridesourcing Services in San Francisco. Transport Policy, Vol. 45, pp. 168-178.
Rayle, L., Dai, D., Chan, N., et al. (2016). Just a better taxi? A survey-based comparison of taxis, transit, and ridesourcing services in San Francisco. Transport Policy, 45, 168–178.
http://dx.doi.org/10.1016/j.tranpol.2015.10.004.
Rosenfeld, A. (1978). Clusters in digital pictures. Information and Control, 39(1), 19–34. https://doi.org/10.1016/S0019-9958(78)91027-6
Scarlett T. Jin (2019). How Ridesourcing Is Impacting Our Cities. Retrieved from: https://sciencetrends.com/how-ridesourcing-is-impacting-our-cities/
Seidl, D. E., Jankowski, P., & Tsou, M. H. (2016). Privacy and spatial pattern preservation in masked GPS trajectory data. International Journal of Geographical Information
Science, 30(4), 785–800. https://doi.org/10.1080/13658816.2015.1101767 Shaheen, S., Cohen, A., and Zohdy, I. (2016). Shared Mobility: Current Practices and
Guiding Principles. Report No. FHWA-HOP-16-022, Federal Highway Administration, US Department of Transportation, April 2016.
Smart, R., Rowe, B., Hawken, A., et al. (2015). Faster and cheaper: How ridesourcing fills a gap in low-income Los Angeles neighborhoods. Report, BOTEC Analysis Corporation, July. http://botecanalysis.com/wpcontent/uploads/2015/07/LATS-Final-Report.pdf Smith, A. (2016). Shared, collaborative and on demand: The new digital economy. In:Pew
Research Center. http://www.pewinternet.org/2016/05/19/thenewdigital-economy/. Su, H., Zheng, K., Huang, J., Wang, H., & Zhou, X. (2015). Calibrating trajectory data for
spatio-temporal similarity analysis. VLDB Journal, 24(1), 93–116. https://doi.org/10.1007/s00778-014-0365-y
Su, Q., & Wang, D. Z. W. (2019). Morning commute problem with supply management considering parking and ridesourcing. Transportation Research Part C, (November 2018), 1–22. https://doi.org/10.1016/j.trc.2018.12.015
Wai, K. P., & New, N. (2017). Measuring the distance of moving objects from big trajectory data. Proceedings - 16th IEEE/ACIS International Conference on Computer and Information Science, ICIS 2017, 5(2), 137–142.
https://doi.org/10.1109/ICIS.2017.7959983
Wang, Z., Lu, M., Yuan, X., Zhang, J., & Wetering, H. Van De. (2013). Visual Traffic Jam Analysis Based on Trajectory Data a b c e d, 19(12), 2159–2168.
Wang, Z., Ye, T., Lu, M., Yuan, X., Qu, H., Yuan, J., & Wu, Q. (2014). Visual Exploration of Sparse Traffic Trajectory Data, 20(1), 1813–1822.
Xie, J., (Marco) Nie, Y., & Liu, X. (2017). Testing the proportionality condition with taxi trajectory data. Transportation Research Part B: Methodological, 104, 583–601. https://doi.org/10.1016/j.trb.2017.05.003
Xu, Z., Yin, Y., & Zha, L. (2017). Optimal parking provision for ridesourcing services.
Transportation Research Part B, 105, 559–578. https://doi.org/10.1016/j.trb.2017.10.003
Yang, L., Kwan, M. P., Pan, X., Wan, B., & Zhou, S. (2017). Scalable space-time trajectory cube for path-finding: A study using big taxi trajectory data. Transportation Research Part B: Methodological, 101, 1–27. https://doi.org/10.1016/j.trb.2017.03.010
Yang, Y., He, Z., Song, Z., Fu, X., & Wang, J. (2018). Investigation on structural and spatial characteristics of taxi trip trajectory network in Xi’an, China. Physica A: Statistical Mechanics and Its Applications, 506, 755–766.
https://doi.org/10.1016/j.physa.2018.04.096
Yuan, N. J., Zheng, Y., & Xie, X. (2012). Segmentation of Urban Areas Using Road Networks, 2–6. Retrieved from http://ofuturescholar.com/paperpage?docid=737984 Zhao, W. X., Zhou, N., Zhang, W., Wen, J.-R., Wang, S., & Chang, E. Y. (2016). A
Zheng Y., Zhou X. Computing with Spatial Trajectories.
Zheng, Y. (2015). Trajectory Data Mining: An Overview. ACM Trans. On Intelligent Systems and Technology, 6(3), 1–41. https://doi.org/10.1145/2743025