S PHASE-COUPLED E2F1 DESTRUCTION ENSURES HOMEOSTASIS IN PROLIFERATING TISSUES
Jean Marie Davidson
A dissertation submitted to the faculty of the University of North Carolina at Chapel Hill in partial fulfillment of the requirements for the degree of Doctor of Philosophy in the
Department of Biology.
Chapel Hill 2012
ABSTRACT
Jean Marie Davidson: S PHASE-COUPLED E2F1 DESTRUCTION ENSURES HOMEOSTASIS IN DEVELOPING TISSUES
(Under the direction of Robert J. Duronio)
A fundamental question in biology seeks to understand the balance acheieved by rapid proliferation and careful regulation of genomic integrity that is essential for generating and maintaining complex multi-cellular organisms. Cells require the ability to divide
incredibly quickly, especially during early development, to achieve the appropriate size in a short amount of time. However, rapid proliferation is dangerous. Defects may arise when cells duplicate rapidly and if these defective cells are not recognized there may be serious consequences for the health of the organism. Therefore the cell has in place many
checkpoints and strategies to balance proliferation with careful regulation. Here we present a novel mechanism to address this issue. The transcription factor E2f1 is a potent activator of cell cycle progression and critical for normal G1-S transitions. It is carefully regulated prior
to the transition by Rbf1 and many upstream effectors. Recently, the mechanism of its destruction during S phase has been described. We describe the consequences of blocking this normal destruction. Surprisingly, the programmed cell death that arises from
ACKNOWLEDGEMENTS
A million thanks to everyone who helped me get here today. It is a long journey and takes the support of people who think you can do it, even when you don’t. Thanks to all the members of Duronio lab, past and present, for being a lovely community of scientists who taught me so much. Special thanks to Deirdre Tatomer, my collaborator, friend, cheerleader, and favorite person to talk science with. My time here was greatly enriched because of her friendship and I feel extremely fortunate to have shared this experience with her. A huge thank you to my mentor Bob Duronio. He taught me so much, challenged me to be my best, and gave me incredible opportunities to learn, grow, and become a member of the scientific community. It is a tricky relationship to navigate, but I feel very fortunate to call him my friend.
My family has always supported me with unfaltering dedication and I thank them for teaching me I could do anything I set my mind to and to follow my dreams. From my 7th grade quantum mechanics presentations, to my very own microscope in my room, to getting me cow brains to dissect, to long hikes hearing me babble on about ferns, they have always encourgaged me. It is hugely empowering to be so supported.
TABLE OF CONTENTS
LIST OF FIGURES ... ix
LIST OF ABBREVIATIONS ... xi
Chapter I. INTRODUCTION ...1
The regulation of the G1-to-S transition ...2
The regulatory mechanisms of mammalian and Drosophila E2Fs ...4
Ubiquitin Mediated Proteolysis ...7
Drosophila Embryos as an Experimental Model for Studying E2F1 Regulation ...10
Drosophila Imaginal Discs as an Experimental Model for Studying Tissue Homeostasis...12
Imaginal Wing Discs ...13
Imaginal Eye Discs ...14
Cell Competition, Apoptosis, and Compensatory Proliferation in Development and Cancer ...15
Dissertation Goals ...17
References ...18
II. IN-VIVO ASSAY OF S PHASE-COUPLED DESTRUCTION ...24
Preface ...24
Introduction ...25
Materials ...28
Methods...30
Flow Cytometric Analysis of S2 Cells ...37
Data Analysis ...39
Flow Cytometric Analysis of Imaginal Discs ...42
Discussion ...44
Acknowledgements ...45
References ...46
III. BIOLOGICAL CONSEQUENCES OF E2F1 STABILIZATION ...48
Preface ...48
Abstract ...48
Introduction ...49
Materials and Methods ...52
Molecular Biology ...52
Cell Culture and Transfection ...52
Flow Cytometry ...53
qRT-PCR ...53
Drosophila Genetics and Cytology ...54
Co-immunoprecipitations and Western blotting ...55
Results ...56
E2F1 Destruction Does Not Require DNA
Binding or Interaction with Rbf1 ...62
Rbf1 Binding but not DNA Binding is Required for S Phase-Stabilized E2f1 Induced Apoptosis ...62
E2f1Stable Causes Defects in the First Cell Cycle After Induction of its Expression ...65
E2f1Stable Induces Apoptosis in Two Ways in Eye Discs ...70
Apoptosis Requires Full Legnth E2f1Stable ...71
E2f1Stable Induces Hypertrophy When Cells Are Prevented From Executing Apoptosis ...75
Discussion ...78
S Phase-Coupled E2f1 Destruction Helps Balance Cell Proliferation with Apoptosis During Tissue Growth ...78
An S Phase Sensor of E2f1-Induced Proliferative Stress ...80
Conservation of E2f1 Regulation Via Different Molecular Mechanisms ...82
Supplemental Figures ...83
Acknowledgements ...87
References ...88
IV. ATYPICAL CELL CYCLES IN NORMAL DEVELOPMENT ...93
Preface ...93
Abstract ...93
Endoreplication Biology, Conservation, and Significance ...94
Transition into Endoreplication ...107
Acknowledgements ...129
References ...130
V. DISCUSSION AND FUTURE DIRECTIONS ...145
Regulation of Onset of S Phase-Coupled Destruction ...146
E2f1 Stabilization induced DNA Damage ...147
The Mechanism of hid Expression ...148
The Global Consequences of E2f1 Mis-regulation ...150
Concluding Remarks ...151
LIST OF FIGURES
Figure
1.1 Roles and Regulations of Drosophila E2f1 ...3
1.2 PIP Degron Interacts with Chromatin Associated PCNA ...10
1.3 Drosophila Embryonic Cell Cycles and E2f1 Destruction ...12
1.4 Drosophila Larval Imaginal Structures ...13
2.1 A Model of CRL4Cdt2 Mediated Destruction of E2f1 ...28
2.2 Gating Protocol for Generating A Cell Cycle Profile of Drosophila S2 Cells and Measuring GFP Intensity ...38
2.3 ModFit LT Analysis ...40
2.4 Representations of Flow Cytometric Data ...42
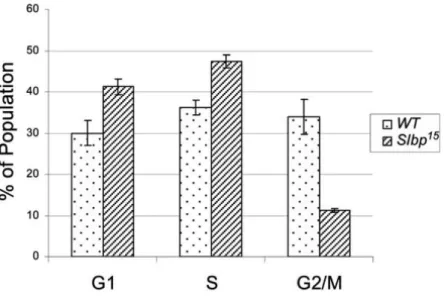
2.5 FACS Analysis of wt and slbp15 Mutant Wing Discs ...44
3.1 Domain Mutations Disrupt Critical E2f1 Functions ...60
3.2 E2f1Stable-induced Apoptosis Requires Rbf1 Binding but not DNA Binding ...64
3.3 E2f1Stable Acts Acutely to Trigger Apoptosis ...67
3.4 E2f1Stable Causes DNA Damage ...69
3.5 Induction of Apoptosis Requires Full Length E2f1Stable ...72
3.6 Stabilizing E2f1 during S Phase Induces hid expression ...74
4.1 Endoreplication ...94
4.2 Examples of Endocycling Tissues ...97
4.3 Common Uses of the Endocycle During Normal And Cancer Development ...105
4.4 Regulation of the Endocycle ...109
5.1 E2f1 is Stabilized following UV Radiation ...147
LIST OF ABBREVIATIONS
APC/C Anaphase Promoting Complex/Cyclosome BrdU Bromodeoxyuridine
Cdc25 Cell division cycle 25 CDK Cyclin-Dependent Kinase cDNA complementary DNA
Cdt1 Chromatin licensing and DNA replication factor 1 Cdt2 Denticleless homolog protein
CKI Cyclin-Dependent Kinase Inhibitor CRL Cullin-RING E3 ubiquitin Ligases
Cul Cullin
Cyc Cyclin
Dap/p27Dap Dacapo
DAPI 4',6-diamidino-2-phenylindole DCAF Ddb1 and Cul4 Associated Factors DDB1 DNA Damage Binding protein 1 DNA Deoxyribonucleic acid
DP DRTF1/E2F Dimerization partner 1
dDREAM RBF, dE2F2, and dMyb-interacting proteins
dsRNA double-stranded ribonucleic acid dup double parked
E2F E2 Factor
EdU 5-Ethyl-2’-deoxyuridine
en engrailed
FACS Fluorescent-Activated Cell Sorting fzr fizzy-related
G Gap
GFP Green Fluorescent Protein GMR Glass Multimer
HA Hemagglutinin
hid head involution defective Hsp70 Heat shock protein 70 INK4 Inhibitor of Cdk4
M Mitosis
MCM Mini Chromosome Maintenance mRNA messenger ribonucleic acid ORF Open Reading Frame PBS Phosphate-Buffered Saline
PCNA Proliferating Cell Nuclear Antigen PCR Polymerase Chain Reaction PH3 Phospho-histone H3
PMSF phenylmethanesulphonylfluoride pre-RC pre-Replication Complex
pRb Retinoblastoma protein
RBF Retinoblastoma-family protein RNAi RNA interference
RnrS Small subunit of Ribonucleotide reductase
RT-PCR Reverse Transcription Polymerase Chain Reaction
S Synthesis
S2 Schneider 2
SCF Skp1-Cullin1-F box
SDS-PAGE Sodium dodecyl sulfate polyacrylamide gel electrophoresis Skp1 S phase kinase-associated protein 1
Skp2 S phase kinase-associated protein 2 SLBP Stem loop binding protein
Slmb Slimb (super-numary limbs)
stg string
UAS Upstream Activator Sequence
CHAPTER I
INTRODUCTION
Establishing and maintaining proper patterning, timing, and tissue organization are critical for normal development. This process requires precise control of cell proliferation and cell death. These seemingly opposing influences must be balanced in order to achieve homeostasis. Inappropriate activation, or repression, of either can have severely detrimental consequences. Loss of proliferation is associated with senescence and some early aging disorders such as progeria, whereas hyper-proliferation is a classical hallmark of
tumorgenesis and cancer (Burtner and Kennedy, 2010; Hanahan and Weinberg, 2011). A host of complicated decisions must occur to transition from a single cell after fertilization into a complex, multi-cellular, organism. The proliferation of cells in a tissue is regulated by various intrinsic and extrinsic cues. In multicellular organisms, the cell cycle is usually rapid during early embryogenesis, resulting in a sufficient number of cells for tissue formation. Later in development, it becomes important to arrest the cell cycle before cells differentiate. Specific adult cell populations must maintain the ability to re-enter the cell cycle upon mitogenic signaling, especially rapidly proliferating epithelial tissues such as skin, lung, and intestine. In contrast, other cells must exit the cell cycle definitively and their proliferation could have severe consequences (Hanahan and Weinberg, 2011). The failure to arrest the cell cycle when required may cause neoplastic growth and eventual cancer development.
are specifically culled before they can harm the surrounding tissue, or ignore regulatory cues. There is also a requirement for apoptosis during normal development, as rapid morphological changes occur that require the loss of specific cell populations. Again, mis-regulation of this powerful molecular mechanism has potentially serious consequences during development and the adult life of the organism. Therefore, it is critical to understand the mechanisms at work to balance the proliferation, arrest, and the critical role of programmed cell death during development to understand how homeostasis is maintained, and how disruptions of these mechanisms may act as initiating events in disease.
The regulation of the G1-to-S transition
The canonical cell cycle is made of four phase: G1, S, G2, and M. During S phase, DNA synthesis takes place and the whole genome is replicated, resulting in two identical sets of genomes in one nucleus. During M phase, the replicated genomes are divided into two nuclei, and the subsequent cytoplasmic division results in two daughter cells. G1 and G2 phases are defined as gap phases that separate S phase and M phase. In these gap phases, proteins required for the subsequent phase are actively synthesized. There are many factors that regulate this canonical cell cycle, most of which tend to function at the major transitions including the G1 to S transition and the G2 to M transition. Some of these factors include
E2F, which, together with its heterodimeric partner DP, induces transcription of genes involved in DNA synthesis, mitosis, apoptosis, DNA repair, and differentiation at the G1-S transition (Blais and Dynlacht, 2004; Iaquinta and Lees, 2007; Lee and Orr-Weaver, 2003; Stevaux and Dyson, 2002). E2F is negatively regulated by pocket protein family members including the retinoblastoma tumor suppressor protein (pRB), p107, and p130. To add further complexity, pocket proteins are negatively regulated by Cyc/CDK-mediated phosphorylation.
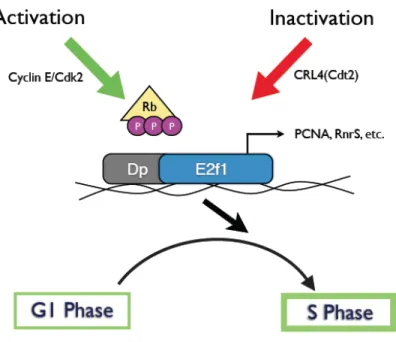
Figure 1.1: Roles and Regulations of Drosophila E2f1. The E2F transcription factor, together with its heterodimeric partner DP, induces DNA replication genes such as, ribonuclease reductase small subunit (RnrS),
proliferating cell nuclear antigen (Pcna), and DNA polymerase. Because of this, E2f1 acts as a strong positive regulator of the G1-to-S transition. E2f1 is negatively regulated by pocket protein family members (represented by Rb in this figure). The phosphorylation of pocket proteins by Cyc/CDK complexes results in the dissociation of pocket proteins from E2F, allowing the induction of E2f1-target gene transcription
Once the activities of E2F and CycE/CDK2 reach a critical threshold, they
2006). The negative regulation of Cyc/CDK occurs in a timely manner during the cell cycle, and the misregulation of these mechanisms often results in ectopic S phase (Chen and Segil, 1999; de Nooij et al., 1996; Lane et al., 1996; Lowenheim et al., 1999; Moberg et al., 2001). In addition to Cyc/CDK regulation, previous studies have identified mechanisms that
negatively regulate E2F activity. The negative regulation involves pocket proteins, repressor E2Fs, proteasome-mediated destruction, CycA/CDK2-mediated phosphorylation, and transcriptional repression.
The regulatory mechanisms of mammalian and Drosophila E2Fs
In mammals, eight E2F genes have been identified, and can be generally categorized into two groups: activator E2Fs (1, 2 and 3a) and repressor E2Fs (3b and 4-8). When
activator E2Fs are overexpressed in cultured cells, they often induce S phase entry, followed by apoptosis (Kowalik et al., 1995; Qin et al., 1994; Shan and Lee, 1994; Wu and Levine, 1994). Conversely, the triple knockout of E2f1-3 in mouse embryonic fibroblasts completely arrests the cells cycle (Wu et al., 2001).
re-activate pRB-repressed E2Fs is that extracellular signals induce the transcription of CycD, which binds to and activates CDK4 and 6. CycD/CDK4 and CycD/CDK6 then
hyperphosphorylate pRB, which leads to the dissociation of pRB from E2F (Frolov and Dyson, 2004). The importance of the pRB-mediated repression is inferred by the fact that many types of cancers have mutations in the Rb gene, and that the loss of Rb in model animals leads to failure to maintain cell cycle arrest (Jacks et al., 1992; MacPherson et al., 2003; Ruiz et al., 2004; Wu et al., 2003). Also, reduction of E2F activity can suppress tumor formation due to loss of pRB (Lee et al., 2002; Yamasaki et al., 1998; Ziebold et al., 2003).
Upon entry in to S phase, there are specific mechanisms to disrupt E2F activity. The first mechanism involves the phosphorylation of DP by CycA/CDK2 in S phase. DP forms heterodimers with E2Fs, and this heterodimerization is required for the binding of E2F/DP to DNA. In S phase, CycA/CDK2 binds to the N-terminus of activator E2Fs and phosphorylates E2F-bound DP, leading to the dissociation of E2F/DP from the DNA (Dynlacht et al., 1994; Dynlacht et al., 1997; Krek et al., 1994; Krek et al., 1995). It is predicted that this free dimer is then targeted for destruction via the ubiquitin-proteosome pathway during S phase. In mammals, the Cul1SKP2 ubiquitin ligase complex has been linked to the degradation of E2F1.
reports have showed that homo- and heterodimers formed by mouse E2F7/8 bind to the promoter of the E2f1 gene and repress the transcription of E2f1 in S/G2 (Li et al., 2008). The combinational loss of E2f7 and 8 resulted in embryonic lethality with massive apoptosis induction, and the apoptosis was suppressed by additional deletion of E2f1, suggesting that the negative regulation of E2F1 by E2F7/8 is important for animal development.
It becomes evident, based on the multiple mechanisms in place to ensure E2F activity is down-regulated upon S phase entry, that there must be critical consequences of inappropriate activator E2F function. However, the redundancy that exists in mammals among the eight E2Fs, two DPs (DP1 and 2), and three pocket proteins (pRB, p107, and p130) makes it difficult to directly address this question. A more simplified E2F/DP/RB pathway has been characterized in Drosophila melanogaster, providing an excellent model system to investigate the regulatory mechanisms of E2Fs. In Drosophila, two E2Fs (E2f1 and E2f2), one DP, and two pocket proteins (RBf1 and Rbf2) have been identified (Lee and Orr-Weaver, 2003). E2f1, the only known activator E2F in Drosophila, shares major
to suppress the transcription of E2f1-target genes (Frolov et al., 2001; Weng et al., 2003). However, other aspects of E2f1 biology were not conserved, namely the down-regulation upon S phase. Unlike mammalian activator E2Fs, no known Cyclin-binding site has been found in Drosophila E2f1. Previous work has suggested a ubiquitin-mediated proteolysis of
Drosophila E2f1 dependent on the Cul1Slmb ubiquitin ligase (Heriche et al., 2003), though more recently a new mechanism has emerged, where CRL4Cdt2 targets E2f1 for rapid
ubiquitination and destruction during S phase (Shibutani et al., 2008). Orthologs of E2F7/8 do not seem to exist in Drosophila.
Despite the simpler E2F/DP/RB pathway in Drosophila, the existence of the multiple layers of the E2F suppression mechanisms raises the question: What are the biological consequences of disrupting E2f1 S phase-coupled destruction?
Ubiquitin Mediated Proteolysis
CRL4Cdt2 E3 ubiquitin ligase, and how its activity contributes both to normal cell cycle
progression and to the preservation of genome integrity.
The ubiquitylation reaction involves the covalent attachment of the small 76 amino-acid ubiquitin moiety on a specific lysine residue in the target substrate protein. For
substrates destined for degradation via the 26S proteasome, polyubiquitin chains are assembled through the successive attachment of the ubiquitin molecules through the
formation of isopeptide bonds between the C-terminus of the incoming ubiquitin to lysine 48 of the attached ubiquitin (Havens and Walter, 2011). The formation of this polyubiquitin chain marks the substrate protein for proteolysis. Polyubiquitylation is achieved through three distinct and consecutive enzymatic steps where ubiquitin is first activated by an E1 ubiquitin-activating enzyme followed by the transfer of the activated (AMP-charged) ubiquitin from the E1 enzyme to an E2 ubiquitin-conjugating enzyme. Finally, the ubiquitin is transferred from the E2 enzyme to the substrate through the activity of an E3 ubiquitin ligase (Abbas and Dutta, 2011). The ability of E3 ubiquitin ligases to recognize, with high specificity, a relatively large number of substrates accounts for the diverse structural complexity of this group of proteins.
Cullin-RING E3 ubiquitin Ligases (CRLs) represent the largest and most complex family of E3 ubiquitin ligases and play significant roles in multiple physiological processes including transcription, differentiation, cell cycle control, proliferation, apoptosis and
or Cul4B), Ddb1 (damage-specific DNA binding protein-1), an adaptor protein which functions to bridge one of many substrate recruiting factors (DCAFs; Ddb1 and Cul4 Associated Factors) to the Cul4 E3 subunit, and a small RING finger protein (Rbx1/2) required for the recruitment of a corresponding E2 ubiquitin-conjugating enzyme (UBC) (Jackson and Xiong, 2009). There are at least 49 known DCAFs or WDR (WD repeat-containing proteins) proteins that function as substrate recognition factors to recruit substrates to the CRL4 ubiquitin ligase complex (Higa et al., 2006b).
The CRL4 E3 ligase orchestrates a variety of physiological processes including DNA replication, transcriptional regulation, apoptosis and a number of DNA repair processes. Recent work demonstrated that CRL4 is critical for preventing genomic instability through its ability to promote the ubiquitin-dependent proteolysis of Cdt1, a replication initiation protein that is essential for pre-RC (pre-replication complex) assembly and the recruitment of the replicative helicase MCM2-7 at replication origins (Abbas and Dutta, 2011; Havens and Walter, 2009; Higa et al., 2006a). Cells that are deficient in Cul4 exhibit re-replication and genomic instability reminiscent to that seen in cells overexpressing the replication initiation factor Cdt1 (Arias and Walter, 2005; Jin et al., 2006).
Following Cdt1, a small but growing list of proteins have been shown to be targeted for destruction by CRL4Cdt2 ubiquitination. CRL4Cdt2 promotes the ubiquitin-dependent degradation of several of its substrates not only in response to genotoxic stress, but also in unperturbed proliferating cells, specifically during the S phase of the cell cycle. The CDK inhibitor p21 (Jorgensen et al., 2011; Nishitani et al., 2008), the histone monomethyl transferase Set8/Pr-Set7, the C. elegans the bypass polymerase, (Acharya et al., 2008), and
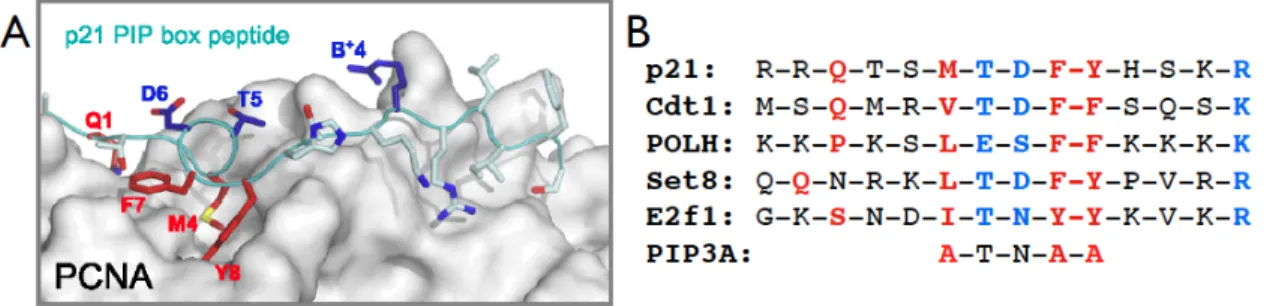
seem to have a variety of roles, they all coalesce on regulation of cell cycle progression, arrest following genotoxic stress, and overall maintenance of genome integrity (Havens and Walter, 2011). The coupling of destruction of these proteins via CRL4Cdt2 to a specific phase of the cell cycle or after DNA damage relies on an elegant coupling of this mechanism to chromatin loaded PCNA (Arias and Walter, 2006). Recent crystal structure studies have shown that only once PCNA (Proliferating Nuclear Antigen) is associated with chromatin, there is the formation of the appropriate hydrophobic pocket that can recognize a specific amino-acid sequence referred to as the PIP degron (Havens and Walter, 2009). This degron contains both amino acids that interact with chromatin loaded PCNA (PIP box), as well as amino acids that extend into the nucleoplasm to recruit the substrate receptor, Cdt2, initiating the recruitment of the entire CRL4Cdt2 complex. The PIP degron is highly conserved between
all CRL4Cdt2 targets and temporally connects the destruction of these substrates to S phase, as well as after DNA damage, when DNA replication relies on PCNA loading (Figure 1.2).
Figure 1.2: PIP Degron Interacts with Chromatin Associated PCNA A) Structure of chromatin associated PCNA demonstrating hydrophobic pocket in which PIP degrons interact. Amino acids in red associate directly with PCNA pocket, while amino acids shown in blue extend into the nucleoplasm and interact directly with substrate receptor protein, Cdt2. Figure from (Havens and Walter, 2009) B) Conservation of PIP degron among five target proteins. Colors of amino acids are the same as in A. PIP3A mutation in Drosophila E2f1, the substitution of three amino acids for alanine, completely blocks E2f1 S phase coupled destruction.
Drosophila embryos as an experimental model for studying E2F1 regulation
pathways and regulations have been well-characterized in Drosophila embryogenesis (Lee and Orr-Weaver, 2003). In addition, we can take advantage of mutant fly resources and genetic tools, with which we can manipulate many aspects of the cell cycle in vivo.
The first 13 cycles of Drosophila embryogenesis are synchronous, rapid S-M cycles that lack obvious gap phases. These cycles are driven by maternal supplies of mRNAs and proteins (Foe and Alberts, 1983). After the S phase of cycle 14, the first gap phase G214
appears. It has been shown that G214 is caused by the degradation of maternal string (stg)
mRNA and protein (Edgar and Datar, 1996). Stg is a Drosophila ortholog of Cdc25
phosphatase that activates CDK1 by removing the inhibitory phosphates. Stg is required for the G2-to-M transition, so that the degradation of maternal stg causes G214 introduction
(Edgar and O'Farrell, 1989; Sigrist and Lehner, 1997). After gastrulation begins, the
developmentally-regulated transcription of zygotic stg regulates the entry into mitosis during cycles 14, 15 and 16 (Edgar et al., 1994; Edgar and O'Farrell, 1990). After cycle 16, the first G1 phase appears in the epidermal cells of the embryo (G117), whereas the cells in the central
nervous system (CNS) continue the S-G2-M cycle, and the cells in the midgut enter a G1-S cycle called the endocycle (discussed in Chapter IV).
The initiation of G1 phase is achieved by the developmentally-regulated transcription of dacapo (dap), which encodes the single Drosophila p27-like CDK inhibitor (de Nooij et al., 1996; Lane et al., 1996). Dap induces G117 because it specifically inhibits CycE/CDK2,
which is required for entry into S phase. The G117-arrested epidermal cells remain in G1 for
the rest of embryogenesis, and this maintenance of G117 requires the function of RBF1 (Du et
positive cells (Shibutani et al., 2007), however following the first gap phase (G214), E2f1 is
targeted for destruction upon subsequent S phase entry (Figure 1.2B). The mechanism that activates this destruction upon zygotic expression is as yet unknown, but will be discussed further in the future directions.
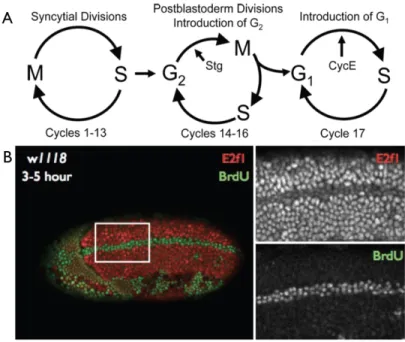
Figure 1.3: Drosophila embryonic cell cycles and E2f1 Destruction A) Schematic of various cell cycle s utilized during Drosophila embryonic development. B) A 3-5 hour wild type (w1118) embryo. BrdU (green) is a nucleotide analogue that incorporates into replicating DNA and labels cells undergoing S phase. E2f1 protein (red) as measured by a polyclonal antibody generating by the Duronio lab. Those cells in the midline marked with BrdU have entered S15, the first S where E2f1 is targeted for destruction. The onset of this mechanism is still unclear and will be discussed later.
Drosophila Imaginal Discs as an Experimental Model for Studying Tissue Homeostasis
During the development of homometabolous insects such as Drosophila
melanogaster, specific cells are fated during embryogenesis to contribute to adult structures (Baker, 2007). These are called imaginal cells and make up imaginal tissues that are
1.3). Imaginal tissues have long served as an important tool for understanding the
mechanisms controlling cell cycle regulation, size determination, and development. We will focus on wing imaginal discs and eye imaginal discs as they provide distinct advantages for the analysis of stabilization of E2f1 protein on normal tissue homeostasis.
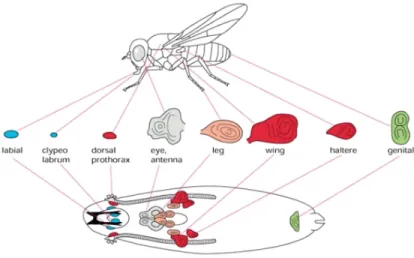
Figure 1.4: Drosophila Larval Imaginal Structures Schematic of the imaginal tissues found in Drosophila larvae during development and the adult structures they give rise to. Discussed further in this chapter are wing and eye discs.
Imaginal Wing Discs
and decapentaplegic (Neufeld et al., 1998). The most prominent is the formation of the anterior and posterior compartments, which is established within the wing primordial and persists until the adult structure. Due to their well-characterized cell cycle profiles and developmental patterning, imaginal wing discs have long served as an excellent model for understanding rapidly proliferating developing tissues and which molecular mechanisms are at work to ensure their homeostasis. Interestingly, there is relatively little apoptosis seen normally in developing disc tissues. It has been shown, however, that these cells are poised to enter programmed cell death pathways in response to cells which have atypical cell division rates or acquired genomic damage. Despite robust apoptosis, these discs are able to form the correct adult structures. Recent work has shown that UV damage which results in up to 50% cell death within the imaginal disc can still result in a normal adult wing (Rusconi et al., 2000). The mechanism at work is known as compensatory proliferation, which is discussed further later. Due to all these characteristics, imaginal wing discs have served as an excellent model to study the balance of proliferation, arrest, and apoptosis required for complex tissues to develop rapidly.
Imaginal Eye Discs
area where specific cells differentiate to a photoreceptor fate. Those cells anterior to the furrow are synchronously dividing, but without any pattern. Cells within the furrow are arrested in G1, and as the furrow progresses, some cells re-enter the cell cycle in what is called the second mitotic wave (SMW) while others differentiate into various photoreceptor cell populations (Roignant and Treisman, 2009). The power of analyzing the effects of E2f1 stabilization in this tissues falls with the genetic tool, GMR-gal4. This activator promotes UAS dependent gene expression only after the morphogenic furrow has progressed posteriorly. Therefore, it allows precise, acute, measurements of the consequences of stabilized E2f1 protein. Previous studies have investigated the role of E2f1 in the eye disc. Asano and colleagues showed that the heat shock-induced expression of Drosophila E2f1 in the eye disc induces apoptosis. However, the cells within or anterior to the morphogenetic furrow did not undergo E2f1-induced S phase or subsequent apoptosis (Asano et al., 1996).
Cell Competition, Apoptosis, and Compensatory Proliferation in Development and
Cancer
that surrounding cells were dividing with greater frequency to replace the slow growing minute mutant cells. This observation was called “cell competition.” Interestingly, this process has been implicated in cells with tumor-suppressor mutations being replaced by surrounding wild-type cells as an intrinsic tumor-suppression mechanism to eliminate precancerous cells (Tamori and Deng, 2011). However, this mechanism requires that cells are able to sense mutant cells and clear them from the population, while relying on
compensatory proliferation to fill the resulting gaps to ensure normal tissue homeostasis. A recently well-studied example of this process is termed “compensatory
proliferation.” In this situation, instead of slow growth, certain cells are cleared from the tissue via apoptosis (Martin et al., 2009). However, as they undergo the well-controlled cascade responsible for the activation of apoptosis, specific extra-cellular mitogens are released from the dying cells and initiate proliferation of neighboring cells (Rusconi et al., 2000). This cell-cell communication is critical to ensure those dying cells are replaced and there are a sufficient number of cells for tissue formation, but also allows that developing tissue to cull cells which may have acquired mutations that could have potentially deleterious consequences on the overall health of the organism. Cells that have induced apoptosis, but are prevented from carrying out the complete program via expression of the baculovirus p35 pan-caspase inhibitor result in what has been called “undead” or “zombie” cells (Martin et al., 2009). These cells initiate compensatory proliferation, but as they are not cleared from the tissue, continue to signal and lead to eventual hyperplasia.
tissues (Weinberg, 2007). Cancer, therefore, is a disease that arises when mutations affect intrinsic mechanisms of tissue-integrity and organ-size control. Regulated cell competition, apoptosis, and compensatory proliferation act in concert drive sufficient proliferation to generate adult structures, and maintain those structures through the life of the organism, but also to prevent accumulated mutations from allowing proliferation to proceed unchecked.
Dissertation Goals
In this thesis, I will describe the work that I performed with my collaborators
addressing the regulation of E2F1 activity during Drosophila development. In Chapter II, we present the specific details of two assays critical to our investigations, flow cytometry
measurement of S phase coupled destruction of GFP tagged proteins in both Drosophila S2 cells as well as dissociated Drosophila imaginal wing discs. In Chapter III, we focus on the biological consequences of disrupting of S phase-dependent destruction of E2F1. We show that the destruction of E2F1 is required for the homeostasis of rapidly developing tissues, such as imaginal wing discs. Interestingly, the stabilization of E2F1 during S phase caused apoptosis, even when E2f1 was lacking activity as a transcription factor. Instead, we propose a mechanism where E2f1/Rbf1 interactions act to induce apoptosis by relieving repression of a pro-apoptotic gene, hid. In Chapter IV, we describe a comprehensive review of the
REFERENCES
Abbas, T., Dutta, A., 2011. CRL4Cdt2: master coordinator of cell cycle progression and genome stability. Cell cycle 10, 241-249.
Acharya, N., Yoon, J.H., Gali, H., Unk, I., Haracska, L., Johnson, R.E., Hurwitz, J., Prakash, L., Prakash, S., 2008. Roles of PCNA-binding and ubiquitin-binding domains in human DNA polymerase eta in translesion DNA synthesis. Proc Natl Acad Sci U S A 105, 17724-17729. Arias, E.E., Walter, J.C., 2005. Replication-dependent destruction of Cdt1 limits DNA replication to a single round per cell cycle in Xenopus egg extracts. Genes Dev 19, 114-126. Arias, E.E., Walter, J.C., 2006. PCNA functions as a molecular platform to trigger Cdt1 destruction and prevent re-replication. Nat Cell Biol 8, 84-90.
Asano, M., Nevins, J.R., Wharton, R.P., 1996. Ectopic E2F expression induces S phase and apoptosis in Drosophila imaginal discs. Genes Dev 10, 1422-1432.
Baker, N.E., 2007. Patterning signals and proliferation in Drosophila imaginal discs. Curr Opin Genet Dev 17, 287-293.
Blais, A., Dynlacht, B.D., 2004. Hitting their targets: an emerging picture of E2F and cell cycle control. Curr Opin Genet Dev 14, 527-532.
Blais, A., Dynlacht, B.D., 2007. E2F-associated chromatin modifiers and cell cycle control. Curr Opin Cell Biol 19, 658-662.
Burtner, C.R., Kennedy, B.K., 2010. Progeria syndromes and ageing: what is the connection? Nat Rev Mol Cell Biol 11, 567-578.
Campanero, M.R., Flemington, E.K., 1997. Regulation of E2F through ubiquitin-proteasome-dependent degradation: stabilization by the pRB tumor suppressor protein. Proc Natl Acad Sci U S A 94, 2221-2226.
Chen, P., Segil, N., 1999. p27(Kip1) links cell proliferation to morphogenesis in the developing organ of Corti. Development 126, 1581-1590.
de Nooij, J.C., Letendre, M.A., Hariharan, I.K., 1996. A cyclin-dependent kinase inhibitor, Dacapo, is necessary for timely exit from the cell cycle during Drosophila embryogenesis. Cell 87, 1237-1247.
Du, W., Vidal, M., Xie, J.E., Dyson, N., 1996a. RBF, a novel RB-related gene that regulates E2F activity and interacts with cyclin E in Drosophila. Genes Dev 10, 1206-1218.
Du, W., Xie, J.E., Dyson, N., 1996b. Ectopic expression of dE2F and dDP induces cell proliferation and death in the Drosophila eye. Embo J 15, 3684-3692.
Duronio, R.J., Brook, A., Dyson, N., O'Farrell, P.H., 1996. E2F-induced S phase requires cyclin E. Genes Dev 10, 2505-2513.
Duronio, R.J., O'Farrell, P.H., 1994. Developmental control of a G1-S transcriptional program in Drosophila. Development 120, 1503-1515.
Duronio, R.J., O'Farrell, P.H., Xie, J.E., Brook, A., Dyson, N., 1995. The transcription factor E2F is required for S phase during Drosophila embryogenesis. Genes Dev 9, 1445-1455. Dynlacht, B.D., Flores, O., Lees, J.A., Harlow, E., 1994. Differential regulation of E2F transactivation by cyclin/cdk2 complexes. Genes Dev 8, 1772-1786.
Dynlacht, B.D., Moberg, K., Lees, J.A., Harlow, E., Zhu, L., 1997. Specific regulation of E2F family members by cyclin-dependent kinases. Mol Cell Biol 17, 3867-3875.
Edgar, B.A., Datar, S.A., 1996. Zygotic degradation of two maternal Cdc25 mRNAs terminates Drosophila's early cell cycle program. Genes Dev 10, 1966-1977.
Edgar, B.A., Lehman, D.A., O'Farrell, P.H., 1994. Transcriptional regulation of string (cdc25): a link between developmental programming and the cell cycle. Development 120, 3131-3143.
Edgar, B.A., O'Farrell, P.H., 1989. Genetic control of cell division patterns in the Drosophila embryo. Cell 57, 177-187.
Edgar, B.A., O'Farrell, P.H., 1990. The three postblastoderm cell cycles of Drosophila embryogenesis are regulated in G2 by string. Cell 62, 469-480.
Foe, V.E., Alberts, B.M., 1983. Studies of nuclear and cytoplasmic behaviour during the five mitotic cycles that precede gastrulation in Drosophila embryogenesis. J Cell Sci 61, 31-70. Frolov, M.V., Dyson, N.J., 2004. Molecular mechanisms of E2F-dependent activation and pRB-mediated repression. J Cell Sci 117, 2173-2181.
Frolov, M.V., Huen, D.S., Stevaux, O., Dimova, D., Balczarek-Strang, K., Elsdon, M., Dyson, N.J., 2001. Functional antagonism between E2F family members. Genes Dev 15, 2146-2160.
Hanahan, D., Weinberg, R.A., 2011. Hallmarks of cancer: the next generation. Cell 144, 646-674.
Hateboer, G., Kerkhoven, R.M., Shvarts, A., Bernards, R., Beijersbergen, R.L., 1996. Degradation of E2F by the ubiquitin-proteasome pathway: regulation by retinoblastoma family proteins and adenovirus transforming proteins. Genes Dev 10, 2960-2970.
Havens, C.G., Walter, J.C., 2009. Docking of a specialized PIP Box onto chromatin-bound PCNA creates a degron for the ubiquitin ligase CRL4Cdt2. Mol Cell 35, 93-104.
Havens, C.G., Walter, J.C., 2011. Mechanism of CRL4(Cdt2), a PCNA-dependent E3 ubiquitin ligase. Genes Dev 25, 1568-1582.
Heriche, J.K., Ang, D., Bier, E., O'Farrell, P.H., 2003. Involvement of an SCFSlmb complex in timely elimination of E2F upon initiation of DNA replication in Drosophila. BMC Genet 4, 9.
Higa, L.A., Banks, D., Wu, M., Kobayashi, R., Sun, H., Zhang, H., 2006a. L2DTL/CDT2 interacts with the CUL4/DDB1 complex and PCNA and regulates CDT1 proteolysis in response to DNA damage. Cell Cycle 5, 1675-1680.
Higa, L.A., Wu, M., Ye, T., Kobayashi, R., Sun, H., Zhang, H., 2006b. CUL4-DDB1 ubiquitin ligase interacts with multiple WD40-repeat proteins and regulates histone methylation. Nat Cell Biol 8, 1277-1283.
Hofmann, F., Martelli, F., Livingston, D.M., Wang, Z., 1996. The retinoblastoma gene product protects E2F-1 from degradation by the ubiquitin-proteasome pathway. Genes Dev 10, 2949-2959.
Iaquinta, P.J., Lees, J.A., 2007. Life and death decisions by the E2F transcription factors. Curr Opin Cell Biol 19, 649-657.
Jacks, T., Fazeli, A., Schmitt, E.M., Bronson, R.T., Goodell, M.A., Weinberg, R.A., 1992. Effects of an Rb mutation in the mouse. Nature 359, 295-300.
Jackson, S., Xiong, Y., 2009. CRL4s: the CUL4-RING E3 ubiquitin ligases. Trends Biochem Sci 34, 562-570.
Jin, J., Arias, E.E., Chen, J., Harper, J.W., Walter, J.C., 2006. A family of diverse Cul4-Ddb1-interacting proteins includes Cdt2, which is required for S phase destruction of the replication factor Cdt1. Mol Cell 23, 709-721.
Kowalik, T.F., DeGregori, J., Schwarz, J.K., Nevins, J.R., 1995. E2F1 overexpression in quiescent fibroblasts leads to induction of cellular DNA synthesis and apoptosis. J Virol 69, 2491-2500.
Krek, W., Ewen, M.E., Shirodkar, S., Arany, Z., Kaelin, W.G., Jr., Livingston, D.M., 1994. Negative regulation of the growth-promoting transcription factor E2F-1 by a stably bound cyclin A-dependent protein kinase. Cell 78, 161-172.
Krek, W., Xu, G., Livingston, D.M., 1995. Cyclin A-kinase regulation of E2F-1 DNA binding function underlies suppression of an S phase checkpoint. Cell 83, 1149-1158. Lane, M.E., Sauer, K., Wallace, K., Jan, Y.N., Lehner, C.F., Vaessin, H., 1996. Dacapo, a cyclin-dependent kinase inhibitor, stops cell proliferation during Drosophila development. Cell 87, 1225-1235.
Lee, E.Y., Cam, H., Ziebold, U., Rayman, J.B., Lees, J.A., Dynlacht, B.D., 2002. E2F4 loss suppresses tumorigenesis in Rb mutant mice. Cancer Cell 2, 463-472.
Lee, L.A., Orr-Weaver, T.L., 2003. Regulation of cell cycles in Drosophila development: intrinsic and extrinsic cues. Annu Rev Genet 37, 545-578.
Li, J., Ran, C., Li, E., Gordon, F., Comstock, G., Siddiqui, H., Cleghorn, W., Chen, H.Z., Kornacker, K., Liu, C.G., Pandit, S.K., Khanizadeh, M., Weinstein, M., Leone, G., de Bruin, A., 2008. Synergistic function of E2F7 and E2F8 is essential for cell survival and embryonic development. Dev Cell 14, 62-75.
Lowenheim, H., Furness, D.N., Kil, J., Zinn, C., Gultig, K., Fero, M.L., Frost, D., Gummer, A.W., Roberts, J.M., Rubel, E.W., Hackney, C.M., Zenner, H.P., 1999. Gene disruption of p27(Kip1) allows cell proliferation in the postnatal and adult organ of corti. Proc Natl Acad Sci U S A 96, 4084-4088.
MacPherson, D., Sage, J., Crowley, D., Trumpp, A., Bronson, R.T., Jacks, T., 2003.
Conditional mutation of Rb causes cell cycle defects without apoptosis in the central nervous system. Mol Cell Biol 23, 1044-1053.
Malumbres, M., Barbacid, M., 2001. To cycle or not to cycle: a critical decision in cancer. Nat Rev Cancer 1, 222-231.
Marti, A., Wirbelauer, C., Scheffner, M., Krek, W., 1999. Interaction between ubiquitin-protein ligase SCFSKP2 and E2F-1 underlies the regulation of E2F-1 degradation. Nat Cell Biol 1, 14-19.
Martin, F.A., Perez-Garijo, A., Morata, G., 2009. Apoptosis in Drosophila: compensatory proliferation and undead cells. Int J Dev Biol 53, 1341-1347.
Morata, G., Ripoll, P., 1975. Minutes: mutants of drosophila autonomously affecting cell division rate. Dev Biol 42, 211-221.
Nakayama, K.I., Nakayama, K., 2006. Ubiquitin ligases: cell-cycle control and cancer. Nat Rev Cancer 6, 369-381.
Neufeld, T.P., de la Cruz, A.F., Johnston, L.A., Edgar, B.A., 1998. Coordination of growth and cell division in the Drosophila wing. Cell 93, 1183-1193.
Nishitani, H., Shiomi, Y., Iida, H., Michishita, M., Takami, T., Tsurimoto, T., 2008. CDK inhibitor p21 is degraded by a proliferating cell nuclear antigen-coupled Cul4-DDB1Cdt2 pathway during S phase and after UV irradiation. J Biol Chem 283, 29045-29052.
Qin, X.Q., Livingston, D.M., Kaelin, W.G., Jr., Adams, P.D., 1994. Deregulated transcription factor E2F-1 expression leads to S-phase entry and p53-mediated apoptosis. Proc Natl Acad Sci U S A 91, 10918-10922.
Roignant, J.Y., Treisman, J.E., 2009. Pattern formation in the Drosophila eye disc. Int J Dev Biol 53, 795-804.
Ruiz, S., Santos, M., Segrelles, C., Leis, H., Jorcano, J.L., Berns, A., Paramio, J.M., Vooijs, M., 2004. Unique and overlapping functions of pRb and p107 in the control of proliferation and differentiation in epidermis. Development 131, 2737-2748.
Rusconi, J.C., Hays, R., Cagan, R.L., 2000. Programmed cell death and patterning in Drosophila. Cell Death Differ 7, 1063-1070.
Shan, B., Lee, W.H., 1994. Deregulated expression of E2F-1 induces S-phase entry and leads to apoptosis. Mol Cell Biol 14, 8166-8173.
Sherr, C.J., Roberts, J.M., 1999. CDK inhibitors: positive and negative regulators of G1-phase progression. Genes Dev 13, 1501-1512.
Shibutani, S., Swanhart, L.M., Duronio, R.J., 2007. Rbf1-independent termination of E2f1-target gene expression during early Drosophila embryogenesis. Development 134, 467-478. Shibutani, S.T., de la Cruz, A.F., Tran, V., Turbyfill, W.J., 3rd, Reis, T., Edgar, B.A., Duronio, R.J., 2008. Intrinsic negative cell cycle regulation provided by PIP box- and Cul4Cdt2-mediated destruction of E2f1 during S phase. Dev Cell 15, 890-900.
Sigrist, S.J., Lehner, C.F., 1997. Drosophila fizzy-related down-regulates mitotic cyclins and is required for cell proliferation arrest and entry into endocycles. Cell 90, 671-681.
Stevaux, O., Dyson, N.J., 2002. A revised picture of the E2F transcriptional network and RB function. Curr Opin Cell Biol 14, 684-691.
Trimarchi, J.M., Lees, J.A., 2002. Sibling rivalry in the E2F family. Nat Rev Mol Cell Biol 3, 11-20.
Weng, L., Zhu, C., Xu, J., Du, W., 2003. Critical role of active repression by E2F and Rb proteins in endoreplication during Drosophila development. Embo J 22, 3865-3875. Wu, L., de Bruin, A., Saavedra, H.I., Starovic, M., Trimboli, A., Yang, Y., Opavska, J., Wilson, P., Thompson, J.C., Ostrowski, M.C., Rosol, T.J., Woollett, L.A., Weinstein, M., Cross, J.C., Robinson, M.L., Leone, G., 2003. Extra-embryonic function of Rb is essential for embryonic development and viability. Nature 421, 942-947.
Wu, L., Timmers, C., Maiti, B., Saavedra, H.I., Sang, L., Chong, G.T., Nuckolls, F.,
Giangrande, P., Wright, F.A., Field, S.J., Greenberg, M.E., Orkin, S., Nevins, J.R., Robinson, M.L., Leone, G., 2001. The E2F1-3 transcription factors are essential for cellular
proliferation. Nature 414, 457-462.
Wu, X., Levine, A.J., 1994. p53 and E2F-1 cooperate to mediate apoptosis. Proc Natl Acad Sci U S A 91, 3602-3606.
Xin, S., Weng, L., Xu, J., Du, W., 2002. The role of RBF in developmentally regulated cell proliferation in the eye disc and in Cyclin D/Cdk4 induced cellular growth. Development 129, 1345-1356.
Yamasaki, L., Bronson, R., Williams, B.O., Dyson, N.J., Harlow, E., Jacks, T., 1998. Loss of E2F-1 reduces tumorigenesis and extends the lifespan of Rb1(+/-)mice. Nat Genet 18, 360-364.
Yao, G., Lee, T.J., Mori, S., Nevins, J.R., You, L., 2008. A bistable Rb-E2F switch underlies the restriction point. Nat Cell Biol 10, 476-482.
CHAPTER II
IN-VIVO ASSAY OF S PHASE-COUPLED DESTRUCTION
Preface
This work was previously published as an in depth technical article. It is based on cell culture flow cytometry assays established by a former graduate student Shu Shibutani, and expanded by myself into imaginal discs dissociation FACS.
The S2 flow cytometry assay was initally carried out by Shu Shibutani, and previously published (Shibutani et al., 2008). I contributed to the writing of the manuscript while Robert Duronio conceived the project and finalized the manuscript. I expanded this technique into dissociated imaginal discs to utilize this technique to measure cell cycle perturbances in-vivo. This was fundamental for experiments described in Chapter III as well as a significant
contribution to a manuscript developed by a former graduate student, Harmony Salzler.
Davidson, JM., and Duronio, R.J. (2011). Using Drosophila S2 Cells to Measure S
phase-Coupled Protein Destruction via Flow Cytometry. Methods in Molecular Biology (Clifton, NJ). 782: 205.
Salzler, HM., Davidson, JM., Montgomery, ND., and Duronio, RJ. (2009) Loss of
Abstract
Cell proliferation depends on the timely synthesis and destruction of proteins at specific phases of the cell cycle. Recently it was discovered that the destruction of several key cell cycle regulatory proteins during S phase is coupled directly to DNA replication. These proteins harbor a motif called a PIP degron that mediates binding to chromatin bound PCNA at replication forks and recruits the CRL4Cdt2 E3 ubiquitin ligase. These interactions
comprise an elegant mechanism for coupling DNA replication with ubiquitylation and subsequent proteolysis by the 26S proteasome. Here we describe a flow cytometry-based method using Drosophila S2 and wing imaginal discs cells that recapitulates S phase-specific protein proteolysis. Because of the high degree of evolutionary conservation of the PIP degron and CRL4Cdt2 and the ease of culturing and inhibiting gene function by RNAi in S2
cells, as well as the genetic tools available in-vivo, our flow cytometric method should serve as a general tool for determining whether any eukaryotic protein is subject to replication-coupled protein destruction.
Introduction
Accurate progression through the cell cycle depends on the timely synthesis and destruction of a myriad of proteins. A classic example is the B-type cyclins, which are targeted for destruction via the APC/C E3 ubiquitin ligase complex during the metaphase to anaphase transition to ensure completion of mitosis. Cell cycle regulators are also targeted for destruction in other phases of the cell cycle. Recently it was discovered that the
(Arias and Walter, 2006; Hall et al., 2008; Higa et al., 2006; Hu and Xiong, 2006; Jin et al., 2006; Nishitani et al., 2006; Senga et al., 2006), the cyclin-dependent kinase inhibitor p21 (Abbas et al., 2008; Kim et al., 2008; Nishitani et al., 2008), the C. elegans translesion DNA polymerase Pol-H (Kim and Michael, 2008), and the Drosophila melanogaster transcription factor E2f1 (Shibutani et al., 2008). There is increasing evidence that these proteins must be destroyed during S phase to ensure normal cell cycle progression.
The mechanism of destruction used by this group of proteins couples DNA
replication with ubiquitin-mediated proteolysis. Each of these four proteins contains a short (approximately 14 amino acid) motif called a PIP degron that is required for replication-coupled destruction. The PIP degron has two critical features: a PIP box that confers binding to a hydrophobic pocket on PCNA (proliferating cell nuclear antigen) and key basic residues flanking the PIP box that recruit the multi-subunit CRL4Cdt2 E3 ubiquitin ligase, presumably through direct interaction with the substrate receptor, Cdt2 (Havens and Walter, 2009). PCNA loads onto DNA as a homotrimer and serves both as a processivity clamp for DNA polymerase during DNA synthesis and as a platform to recruit various PIP
Figure 2.1: A model of CLRCdt2 mediated destruction of E2f1.
Drosophila E2f1 is a member of the E2F family of transcriptional activators, which play a pivotal role in the progression of the G1-S transition (van den Heuvel and Dyson, 2008). Like mammalian E2Fs, E2f1 is inhibited prior to S phase via interaction with the retinoblastoma protein (pRb) homolog, Rbf1. Activation of cyclin-dependent kinases during G1 results in hyper-phosphorylation of Rbf1, thereby relieving E2f1 repression and
activating a transcription program that promotes entry into S phase. E2f1 is then rapidly destroyed during S phase (Asano et al., 1996; Heriche et al., 2003; Reis and Edgar, 2004; Shibutani et al., 2007). We hypothesized that S phase-specific destruction provides an important Rbf1-independent negative regulation of E2f1. In order to test this, we developed a facile method for using exogenous GFP-E2f1 fusion proteins and flow cytometry of
trans-acting factors (e.g. components of CRL4Cdt2) are required for destruction of E2f1 during S
phase. Our assay allowed us to discover a PIP degron within E2f1 and to demonstrate that PCNA and CRL4Cdt2 are necessary for S phase-specific destruction of E2f1 (Shibutani et al., 2008).
In this chapter we describe our method for determining whether a protein is destroyed specifically during S phase and whether this destruction requires components of the CRL4Cdt2
E3 ligase. We discuss the method of generating stably transfected S2 cell lines, generating and treating those cell lines with dsRNA that will knockdown components of the CRL4Cdt2 E3 ligase, inducing expression of GFP-fusion proteins, and submitting fixed and stained cells to flow cytometric analysis to ascertain their cell cycle profile and quantitatively measure S phase-specific protein destruction. Because of a high degree of evolutionary conservation and the ease of culturing and inhibiting gene function by bathing S2 cells in dsRNA, our flow cytometric method should serve as a general tool for determining whether any eukaryotic protein is subject to the replication-coupled, PIP degron/CRL4Cdt2-mediated destruction mechanism.
MATERIALS
Drosophila S2 Cell Culture: Drosophila S2 Cells (Invitrogen). SF-900 III SFM culture medium (Gibco, Invitrogen). Penicillin-Streptomycin: Solution stabilized, sterile-filtered, with 10,000 units penicillin and 10mg streptomycin/mL (Sigma, St. Louis, MO)., 25 cm2 Corning Cell Culture Flasks (Sigma). Incubators with proper humidity (28°C/100% air incubator for normal growth, 37°C/100% for heat shock induction).
Creating Double Strand RNA for RNAi: T7 RNA Polymerase (New England Biolabs),
8.0, 150 mM MgCl2, 50mM DTT, 0.5 mg/mL BSA. DNase 1U/ul (Promega), NTPs set
100mM Solutions (Fermentas), Phenol:Chloroform:Isoamyl Alcohol 25:24:1 saturated with 10 mM Tris, pH 8.0, 1 mM EDTA. (Sigma Aldrich), dsRNA ladder (New England Biolabs), AlphaImagerTM 2200 (Alpha Innotech) and ImageQuant 5.2 software (GE Life Science) Generating Stable Lines: pHGW: Gateway-compatible destination vector developed by Dr.
Terence Murphy (http://www.ciwemb.edu/labs/murphy/Gateway%20vectors.html). Available upon request. This vector allows NH2-terminal GFP fusion driven by the Hsp70
promoter, with Ampicillin resistance. Other vectors allow COOH-terminal fusion, which may be necessary for certain proteins depending on the stability of the fusion protein and the location of the PIP degron (e.g. NH2-terminal GFP fusion may mask an NH2-terminal PIP
degron). Gateway LR Clonase II enzyme (Invitrogen). pCoHygro plasmid (Invitrogen) 4526bp with Ampicillin resistance. Hygromyosin B (Invitrogen). Amaxa Nucleofectin V for Drosophila S2 Cell transfection (Lonza). Nucleofector apparatus (Lonza). 6 well culture plate (Corning). 2ml round bottom tubes (Eppendorf). 25cm2 cell culture flasks (Corning).
Fixing S2 Cells: 32% Paraformaldehyde (Electon Microscope Sciences), 1X PBS-T: 1X Phosphate Buffered Saline with 1%/vol Tween20 (Promega), DNase-free RNase (Roche), Propidium Iodide: 1.0 mg/mL solution in water (Invitrogen), store at 4° C protected from
light.
Flow Cytometric Analysis: Dako CyAn Flow Cytometry System (Dako, Beckman-Coulter),
House) Required parameters: height and area of fluorescence emission signal for GFP or propidium iodide signal. Height of forward and side scatter.
6. Nomenclature: Forward Scatter (FS); parameter to measure light scattered less than 10˚ FS measures relative cell size. Side Scatter (SS); light scattered at a 90˚ angle. Measures complexity of cellular membranes combined to measuring clumping of cells. Height (H) is the maximum amplitude of the emission signal. Area (A) is the area of the signal. Event Count measures the number of cells within to a certain parameter.
METHODS
Maintaining Drosophila S2 Cells in Culture
Cells were routinely grown at room temperature in SF-900 Drosophila medium (Gibco) without serum and 1:200 Penicillin-Streptomycin (5 units/ml Penicillin, 5 µg/ml
Streptomycin, Sigma). Schneider’s Drosophila medium (Gibco) supplemented with 10% Fetal Bovine Serum (Sigma) can also be used, but may interfere with RNAi and transfection efficiency. There are many multiparameter flow cytometer systems available that are
functional to collect cell cycle data. The main requirement is that the system be able to excite and detect GFP signal versus Propidium Iodide (PE) staining. Similarly, many operating systems are publically available for cytometric analysis, including FlowJo (TreeStar) and TestDNA (Verity Software).
Simple laminar flow hoods are sufficient when working with Drosophila S2 cells, as they are not thought to carry vectors of human disease. However, good sterile technique should be utilized to prevent contamination of the cells. Once contaminate, there is little to no possibility of recovery. Therefore, it is a good idea to freeze an aliquot of all cell lines generated. We recommend freezing 2 x 10⁷ cells from a single plate in 2.5 mL of freezing medium in 5 x 0.5 mL aliquots and storing in liquid nitrogen. When removing cells from the flask, tap the flask several times to dislodge adherent cells. Use a pipette to wash the surface where cells adhere before transferring cells to a new flask.
Creating double-strand RNA and RNAi on S2 Cells
Generate primers to amplify target genes using primers that contain a T7 promoter sequence (labeled in Italics). Below are the sequences used to generate dsRNA against components of the CLR4Cdt2-mediated destruction machinery. Note that an extended knockdown of PCNA is predicted to eventually result in an S phase arrest, thereby
precluding detection of S phase-coupled destruction because of a depletion of S phase cells from the population. However, we were able to find conditions of PCNA knockdown that stabilized E2f1 during S phase prior to extensive cell cycle arrest (Shibutani et al., 2008). A similar situation occurs with Cul4 knockdown, which eventually will result in G1 arrest.
a. Cul4 dsRNA Forward:
TAATACGACTCACTATAGGGTTGGCCAAACGATTACTTGTGGG
b. Cul4 dsRNA Reverse:
TAATACGACTCACTATAGGGGAGAAGATTATGGCTCAGCG
c. Cdt2 dsRNA Forward:
d. Cdt2 dsRNA Reverse:
TAATACGACTCACTATAGGCGTGGCTGGAGCCCCAGGCCACG
e. PCNA dsRNA Forward:
TAATACGACTCACTATAGGGCAGGCCATGGACAACTCCCATG
f. PCNA dsRNA Reverse:
TAATACGACTCACTATAGGGTGTCTCGTTGTCCTCGATCTTGGG
Double stranded RNAs (dsRNAs) are transcribed from PCR products generated by gene-specific primers containing T7 promoter sequences. PCR products are amplified from genomic DNA or cDNA clones. cDNA clones are available from the Drosophila Genomics Resource Center (https://dgrc.cgb.indiana.edu/). RNAi causes a reduction in gene expression and is not equivalent to a complete loss of function. Western blot analysis after dsRNA treatment is recommended to determine the efficiency of knockdown. Various responses to RNA interference occur depending on the threshold of activity necessary for each particular gene product.
Transcription reaction is performed by combining the following: 2mM (final concentration) each NTP, 10µL 10x Transcription Buffer, 0.5 µl RNasein, 1 µg purified
DNA template (e.g. via phenol:chloroform extraction), 1 µl T7 RNA polymerase with sterile
water to make 100µl total reaction volume. Incubate at 37˚ C for 6 hours (reaction may
become cloudy). Add 1µl DNase and incubate at 37˚C for 30 minutes. Annealed RNA
strands are generated by boiling samples in a beaker of water to remove secondary structure and slowly returning to room temperature. Purify dsRNA reaction using
Approximate concentrations of the dsRNAs are determined by comparing the intensity of band of 1µl of RNA sample in an agarose gel using a dsRNA ladder as a
standard. The intensity of the RNA bands is analyzed using by imaging the AlphaImagerTM and quantified with the ImageQuant 5.2 software. Since RNase is highly ubiquitous and ssRNA is unstable, we recommend wearing gloves and maintaining a clean environment when working with RNA. DEPC-treated water and RNAse-free plastics should be used when generating dsRNA. dsRNA itself is fairly stable, however multiple freeze-thaw cycles should be avoided.
Generating Stable Lines
The open reading frame of wild type Drosophila E2f1 was amplified from
pUAST-E2f1 and cloned into pENTR/D-TOPO. The forward primers used to amplify E2f1 are designed with a CACC at the 5’ end for directional cloning into pENTR. To create
expression vector plasmids, pENTR E2f1 was recombined with the Gateway expression vector pHGW, which contains an NH2-terminal GFP tag and a Hsp70 promoter, using the
Gateway LR Clonase II enzyme mix. Split cells 2-3 days prior to transfection to ensure they are growing well and not overcrowded. Ensure that the entire Nucleofector
Supplement is added to the Nucleofector Transfection solution and allowed to reach room temperature prior to beginning transfection protocol. The transfection solution should be kept at 4°C otherwise and will expire within 3 months of the supplement being added.
Resuspend cells in 100 µl room-temperature Nucleofector Solution per sample. Avoid
leaving cells in this solution for longer than 15 minutes. Combine cell solution with 2 µg
pENTR E2f1 and 0.5 µg pCoHygro and transfer solution to cuvette supplied in
Nucleofection Kit V, ensuring cell/DNA solution covers bottom of the cuvette with no air bubbles. Close cuvette with cap.
Select Nucleofector Program G-030. Insert cuvette into apparatus and apply the program by pressing the X-button. Take cuvette out once transfection is successfully
completed. Immediately add 500 µl of room temperature SF-900 SFM media to cuvette and
gently transfer to prepared 6 well plate, using supplied pipettes. Final volume is 1.6
mL/well. Incubate cells in a humidified 25°C/100% air incubator without C02 for 2-3 days.
Collect cells and centrifuge for 5 minutes at 500xg. Replace with 2mL of fresh SF-900 SFM media and transfer to a new 6 well plate. Let grow 2-3 days in a humidified 25°C/100% air incubator.
Collect cells into two 2mL round bottom Eppendorf tubes and centrifuge for 5
minutes at 500xg. To one sample, add 2mL of SF-900 SFM with 50µg/mL Hygromyosin B.
To the other, add only SF-900 SFM, in case selection kills the culture. Grow in 6 well plate for 2-3 days in humidified 25°C/100% air incubator. Other selection methods are available. Methotrexate resistance plasmids: pHGCO, pHCO, p8hCHO, actDHFR, (available from Drosophila Genomics Resource Center (DGRC)). Methotrexate (Sigma) (L-amethopterin) used at a final concentration of 2 x 10⁻⁷ M (store stock solution protected from light at -20°). α-Amantinin resistance plasmids: pPC4 is available at DGRC. α-Amantinin is used at a final
Once cells reach confluency within several days, transfer to 25 cm2 cell culture flask
and split cells 1:5 every week. Maintain 50mg/mL Hygromyosin B in SF-900 SFM media. Initial transfection efficiency should be around 50-60%, this can be checked by removing an aliquot, subjecting the cells to a 37°C heat shock for 30 minutes, waiting an hour and
visualizing GFP signal under a microscope. Once population is nearly homogeneous for containing the plasmid, experiments may begin.
RNAi and Heat Shock Induction
3-4 days prior to the experiment, count and plate stably transfected pHGW-E2f1 and pHGW-only cells at 1x10⁶ cells/mL. Add 1mL to each well of a 6 well plate. Let cells grow overnight in a humidified 28°C/100% air incubator. The following day, add the appropriate amount of dsRNA. The normal range of dsRNA is 2-30 µg dsRNA per treatment (e.g. Cul4
knockdown required 2µg whereas Cdt2 and PCNA required 10 µg). Treat each sample with
dsRNA two consecutive days while incubating at 28°C/100% air. A non-specific control (e.g. LacZ) should also be used to measure effect of dsRNA treatment. A subset of the cells may be collected and lysed for western blot analysis to measure efficiency of dsRNA knockdown. Optimization of the amount of dsRNA, and length of treatment, required to sufficiently knockdown a protein of interest may be required. Prior to heat shock induction, a control sample of cells may be taken to measure baseline cell cycle profile.
Transfer the rest of the cells to a 37°C/100% air incubator for 30 minutes to induce
Fixing S2 Cells for Flow Cytometric Analysis
Collect all the cells from each well by pipetting gently up and down and transfer each to a labeled 2ml round bottom Eppendorf tube. Centrifuge tubes for 5 min at 500xg. Pour out supernatant, flick tube gently to break up pellet. Wash cells with 500µl 1X phosphate
buffered saline solution (PBS), centrifuge 5 minutes at 2300 rpm and gently tap tube to break up pellet. Add 500 µl 1% paraformaldehyde in ice cold 1X PBS and keep on ice for 30 min.
Make the paraformaldehyde solution immediately prior to use by combining 700µl 10x PBS,
218µl 32% paraformaldehyde stock solution and bringing total volume to 7 mL. Centrifuge
tubes at 4° for 5 minutes at 500xg. Remove paraformaldehyde solution into proper waste container. Gently tap tube to break up pellet. Wash cells with ice cold 1X PBS. Centrifuge tubes at 4° for 5 minutes at 500xg, pour out supernatant and flick to break up pellet. Add 500µl 1X PBT (PBS with 0.1% Tween20), let sit 15 minutes at room temperature. This
increases the permeability of the cell membranes. Centrifuge for 5 minutes at 500xg at room temperature. Remove supernatant and tap tube to break up pellet. Add 3ul DNase-free RNase. Incubate for 30 minutes at 37° C. It is critical to degrade RNA as propidium iodide
binds equally to DNA and RNA. Add 5µl 15 mM Propidium Iodide and 500µl ice cold 1X
PBS. Leave at 4° C overnight. Fixed and stained cells can be kept up to a week until flow
cytometric analysis, kept at 4° C and protected from light. Propidium iodide is a DNA
FLOW CYTOMETRIC ANALYSIS OF S2 CELLS
We recommend proper training from be received prior to beginning a flow cytometry experiment. The following method outlines a protocol for measuring cell cycle profiles in S2 cells on a CyAn (Dako, Beckman Coulter), but does not address all the complexities of flow cytometric analyis or the various other operating systems that can be used.
Transfer all cells to Falcon tubes appropriate for the flow cytometer being used. Break up any clumps of cells prior to analysis by gently vortexing tubes. Establish the correct protocol using Summit 4.3 software. GFP detection uses a 488-nm laser and detection through a 530/30 bandpass filter. Propidium iodide uses a 488-nm laser and detection through a 630/30 bandpass filter. Create an acquisition template with plots by selecting “Create Histograms” from the menu options and create the following plots
Figure 2.2: Gating protocol for generating a cell cycle profile of Drosophila S2 cells, and measuring GFP fluorescence intensity using Summit software (X and Y-axis respectively). A: SS Area vs. FS Area. Gate R1 and R4 to collect only cells, not debris. B: PI Linear vs. PI area. Gate R2 to only collect single cells, not doublets or triplets, which may skew laser intensity readings. C: GFP log vs. Counts on untransfected control cells. GFP laser intensity should be set so the peak falls between 100-101 . D: PI Area vs. GFP log on
untransfected control cells. Set R3 gate so that no more than 0.05% of untransfected cells falls in the GFP positive range. E: GFP log vs. Counts for GFP-E2f1 transfected cells. Note shift of GFP intensity to 102 range. F: PI area vs. GFP log measurement of GFP-E2f1 transfected cells. Note shift of cell population now within the GFP positive gate (27% of all cells). G: PI area vs. Counts of all cells measured. First peak (64) represents with G1, second peak (128) represents G2/M. H: PI area vs Counts of GFP positive only cells. Note that fewer cells appear in the area between the G1 and G2/M peaks, reflecting the targeted destruction in S phase of GFP-E2f1.
Using the Gate Logic Builder and the Gate Scheme applications, create the following gates on your histograms, as follows;
a. SS Area vs. FS Area: Avoid bottom left corner where debris will be measured (R1). b. PI Lin vs. PI Area: Avoid doublets and clumped cells (R2).
c. PI Area vs. GFP Log: Create a gate that will select only GFP positive cells (the threshold will be determined by running the untransfected control).
parameters to “Auto-Start” and “Auto-Boost.” However, occasionally manual Boost will be required to activate the collection. Run the untransfected control cells to set the GFP
negative parameter. Aim for less than 0.05% of cells falling above the GFP cut off in the untransfected samples. Adjust laser voltage to generate single peak in the GFP Log vs. Counts histogram that falls between 100-101. Adjust gates to ensure that no debris and only single cells are being collected. Once parameters are set for negative control, do not adjust for the remainder of the experiment.
When acquiring cells, ensure that cells following “Boost” are not collected and cells run through the analysis between 200-400 cells per second. Running the cells too quickly will decrease the accuracy of the data due to decreasing the time for excitation and detection. Run pHGW-only (GFP only) control to measure efficiency of transfection and heat shock induction. Aim to collect at least 10,000 experimental events (GFP positive cells after all the gating). The minimum number needed for statistical analysis is 4,000. 20,000 cells is
optimal. Ensure that data is properly stored after each collection before starting the next. Take care that the gates ensure that only the experimental data is saved, not debris, which could quickly overfill your saving capacity. In between samples, activate “Backflush” under the Acquisition menu to clear out any residual cells. Rinse the CyAn uptake nozzle with distilled, deionized, water.
DATA ANALYSIS
population as compared to the GFP-positive population alone. This provides an easy way to quickly visualize S phase specific destruction.
Figure 2.3: ModFit LT analysis. A: Histogram representing the calculated percentage of cells in each phase of the cell cycle and the confidence in these values. Shaded peaks represent the calculated profile of G1 and G2 peaks, dashed lines represent the calculated percentage of cells in S phase. B: The gating required to analysis flow cytometry samples (X and Y-axis, respectively). Gate 1: SS area vs. FS area. Gate 2: PI Linear vs. PI Area. Gate 3: Area PI vs. GFP Log. Include all cells in this gate to get a total cell population profile, and gate only the GFP positive cells to measure the cell cycle profile of GFP-E2f1 transfected cells.
To observe more subtle changes in the cell cycle, or for a more quantifiable approach, statistical software can calculate the percentages of cells in each phase of the cycle, in
addition to apoptotic (i.e. sub-G1) cells. This will be discussed further. Open ModFit LT