INTERSPECIFIC COMPETITION AND PREDATION CONTROL EUHALINE OYSTER REEF DEVELOPMENT
Michelle Claire Brodeur
A dissertation submitted to the faculty at the University of North Carolina at Chapel Hill in partial fulfillment of the requirements for the degree of Doctor of Philosophy in the
Department of Marine Sciences.
Chapel Hill 2016
© 2016
ABSTRACT
Michelle Claire Brodeur: Interspecific competition and predation control euhaline oyster reef development
(Under the direction of F. Joel Fodrie)
Species interactions, including competition and predation, can drive the development of biogenic habitats across environmental stress gradients. Using the Eastern oyster
To my family, thank you for always believing in me.
AKNOWEDGEMENTS
I would first like to thank my advisor and mentor, Dr. Joel Fodrie, for his extensive
guidance and support. From the early days of the lab, you taught me how to design and execute
an experiment, find the money fish from the trawl, write a paper, and the best way to outrun a
thunderstorm through the shallowest part of Middle Marsh. You always challenging me to do the
best that I can, and as the first technician and student, I’d like to think we both learned a lot from
this experience. I am grateful you provided me with this opportunity to grow into a scientist – it
was a very good nursery habitat.
To my committee- Drs. Jon Grabowski, Pete Peterson, Michael Piehler, and Johanna
Rosman- thank you for the guidance and advice over the years, I appreciate the time you spent to
help me get to where I am today. To Drs. John Fear and Brandon Puckett, thanks for being a
great mentors and fun company in our sonde adventures.I also am grateful for being welcomed
into the Rodriguez Lab family. Thanks, Tony, for the all the advice and hallway laughs.
I could not have done this without the help and support of the past and present members
of the Fisheries Ecology Lab. Thanks to my officemates Abby Poray-Morley, Matt Kenworthy,
Sara Coleman, Danielle Keller, and Ian Kroll for your friendship and for being my sounding
board. Lauren Yeager, thank you for your support, mentorship, and reinvigorating my passion for
ecology when I needed it most. To the Fod Squad family over the years, who were willing to
helped me scrape algae and barnacles off oysters, Erin Voigt, Chris Baillie, Kenny Namkoong,
Ziegler, Martin Benavides, Max Tice-Lewis, Quin Walker, Richard Mahoney, Mariah Livernois,
and Emily Woodward- thanks!
To my Carolina and Duke families – thanks for welcoming me in and making my time at
IMS so much fun.Thanks to all the grad students for support and reminding me that I was not the
only one going through the ups and downs of grad school, especially (but not limited to) Liz
Schrack, Sara Coleman, Teri O’Meara, Beth VanDusen, Caitlin White, Ashley Smyth, Ann
Mooney, Lindsey Carr, Courtney Masden, and Abel Valdivia. To Rachel Gittman, thanks for
adopting me into your lab our first year, I appreciate all your friendship and encouragement,
especially at the end – I’m glad you are back. Avery Paxton, I looked forward to our Wednesday
coffee shop and late night work sessions, you lifted my spirits and helped me feel more confident
in my work. Ethan & Kristen Theueruakuf, thanks for always listening, reminding me to laugh
and for putting my grad school trials and tribulations into perspective. Danielle Keller, thanks for
always being there when I needed support in any area of life - field assistance, editing support,
wedding crafting, dinner, or fun. You and DJ are incredible friends and I miss our Swansboro
weekends.
To the triumvirate! Cait Cameron and Erin Wilkinson, thank you for always being willing
to do some long distance, last-minute editing, your constant support, and sticking with me over
all these years. You constantly reminded me why I was doing this and kept me from throwing
away my shot!
Finally, to my family - Mum, Papa, Matty and the entire Brodeur-Simard-Ridge clans -
thank you for your persistent encouragement and love. I could not have done this without you.
Last, but not least, I would like to thank Justin Ridge for valuable discussions, last minute field
assistance, unwavering patience, and constant love and support. I am excited for the adventures
TABLE OF CONTENTS
List of Figures ...xi
List of Symbols and Acronyms ...xii
INTRODUCTION ... 1
REFERENCES ... 8
CHAPTER 1: EFFECTS OF INTERSPECIFIC COMPETITION ARE MEDIATED BY BODY SIZE AND ENVIRONMENTAL STRESS IN A BIOGENIC REEF COMMUNITY ... 11
INTRODUCTION ... 11
METHODS ... 15
Statistical Analysis ... 17
RESULTS ... 18
Oyster Survival ... 18
Oyster growth... 19
Epibiotic community ... 20
DISCUSSION ... 20
REFERENCES ... 29
CHAPTER 2: DYNAMICS AND DRIVERS OF SEASONAL MACROALGAE ON BIOGENIC REEFS AND THE EFFECTS ON OYSTER FITNESS ... 33
INTRODUCTION ... 33
Study site ... 36
Monitoring ... 37
Effects of nutrients on macroalgal cover ... 38
Effects of top-down control on macroalgal cover ... 38
Effects of macroalgal cover on oyster fitness ... 39
Statistical Analyses ... 40
RESULTS ... 41
Monitoring ... 41
Effects of nutrients on macroalgal cover ... 44
Effects of top-down control on macroalgal cover ... 44
Effects of macroalgal cover on oyster fitness ... 45
DISCUSSION ... 45
REFERENCES ... 58
CHAPTER 3: LANDSCAPE-LEVEL DIFFEENCES IN SETTLEMENT AND PREDATION REGULATE OYSTER REEF COMMUNITIES ... 62
INTRODUCTION ... 62
METHODS ... 66
Reef landscape characteristics ... 66
Oyster settlement ... 67
Predation ... 67
Statistical analyses ... 69
RESULTS ... 70
Reef landscape characteristics ... 70
Predation ... 71
DISCUSSION ... 73
REFERENCES ... 81
CONCLUSIONS ... 83
LIST OF FIGURES
Figure 1.1 Conceptual model ... 25
Figure 1.2 Epibiota cover ... 26
Figure 1.3 Oyster survival ... 27
Figure 1.4 Oyster growth. ... 28
Figure 2.2 Water qulaity and water level. ... 53
Figure 2.3 Mesograzer and nekton catch per unit effort of grazers ... 54
Figure 2.4 Macroalgal cover: montioring ... 55
Figure 2.5 Macroalgal cover: nutrient enrichment experiment . ... 56
Figure 2.6 Macroalgal cover: biotic vs abiotic effects experiment. ... 57
Figure 3.1. Oyster biomass and large mud crab density. ... 77
Figure 3.2. Oyster settlement ... 78
Figure 3.3. Predation assay ... 79
LIST OF SYMBOLS AND ACRONYMS
% percent
< less than > greater than
± plus or minus
° degree
µ average
’ minutes
” seconds
ANOVA Analysis of Variance
C Celsius
K2O Potassium oxide
m meter
mm millimeter
MSL mean sea level
NAVD 88 North Atlantic Vertical Datum of 1988
n sample size
NOAA National Oceanic Atmospheric Administration
N Nitrogen
ppt parts per thousand P2O5 Phosphorous pentoxide
RTK GPS real time kinematic global positioning system SE standard error
1 2 3 4
INTRODUCTION 5
6
Biogenic habitats are an important component of landscape mosaics and the 7
foundation for many ecological communities (Lindsey et al. 2006, Boström et al. 2011). The 8
development habitat-building or foundation species is regulated by the integration of larval 9
supply (Underwood and Fairweather 1989) and post-settlement processes (Menge 2000, 10
Wright and Steinberg 2001). Species interactions, including the processes of competition 11
(Connell 1961a, 1961b) and predation (Paine 1966), can significantly affect the growth and 12
survival of individuals after settlement and transform how biogenic habitats are distributed 13
and formed throughout a landscape. However, the degree to which settlement processes and 14
species interactions influence the development of biogenic habitats may vary with different 15
spatial scales, altering how individual habitat patches develop across landscapes. 16
The differences in species tolerance to aerial (tidal) exposure and interactions with 17
neighbors can produce distinct zones of foundation species in littoral environments, limiting 18
where some biogenic habitats can develop. Interspecific interactions, including competition 19
for shared resources and predation, that mediate species distributions are context dependent, 20
and have been tested across numerous environmental stress gradients (Menge 2000, Helmuth 21
2002, Harley 2003, Crain et al. 2004, Liancourt et al. 2005). Patterns across multiple 22
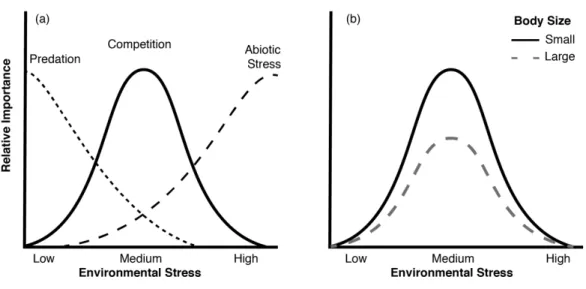
ecosystems have been used to develop environmental stress models that describe the relative 23
importance of physiological stress, competition, predation, and facilitation at varying levels 24
Bruno et al. 2003). For organisms at intermediate trophic levels, the relative importance of 26
predation is greatest at low environmental stress, competition becomes most important at 27
intermediate stress levels when recruitment is high, while abiotic stress tolerance is typically 28
most important in determining the relative abundance of a species at high stress levels. In the 29
marine environment, desiccation and thermal stress are associated with increasing aerial 30
exposure in the intertidal zone; therefore, aerial exposure tolerance determines how high in 31
the intertidal an organism can survive, and can dictate their ability to withstand competition 32
or escape predation determines the lower limit. 33
The landscape setting, or spatial arrangement of habitats within a mosaic, has also 34
been found to affect both the supply and survival of settlers, and ultimately the development 35
of biogenic habitats (Turner 1989). The position of a habitat within a landscape can 36
dramatically alter settlement rates if adjacent habitats interfere with the transport of settlers 37
or habitats are isolated and have low connectivity from source populations (Roughgarden et 38
al 1987). After settlement, new recruits of habitat building species are exposed to other 39
community members that are competing for the same space and other resources (e.g., food, 40
light, etc.). However, similar to mechanisms that drive species distributions across 41
environmental stress gradients, higher recruitment to an area also increases the importance of 42
interspecific and/or intraspecific competitive interactions for shared resources (Menge 1976, 43
Menge and Sutherland 1987b, Menge et al. 2010). Varying predation pressure due to 44
differences in the spatial arrangement and corresponding habitat connectivity can further 45
alter predator abundance and foraging activity can also dramatically alter the pattern of 46
individual habitat patches and abundance adults in biogenic habitats (Micheli and Peterson 47
across landscapes and within individual habitat patches that determines the resulting 49
distribution and demographics of foundation habitats. 50
Eastern oyster (Crassostrea virginica) reefs in euhaline waters are a model system to 51
test how settlement, interspecific competition, and predation vary across environmental stress 52
gradients and landscape settings to affect the development of a foundation species. Within 53
estuaries, Eastern oyster, Crassostrea virginica, reefs exhibit disparate development across 54
gradients of salinities (Wells 1961), habitat settings (Grabowski et al. 2005), and aerial 55
exposures (tidal emergence) resulting in differences in oyster demographics from the scale of 56
an individual reef to an entire estuary, presumably due to differences in settlement, 57
competition, and predation (Fodrie et al. 2014, Walles et al. 2016). In the euhaline portion of 58
the estuary, oyster reefs develop predominantly in the intertidal zone, and patterns of oyster 59
settlement and the distribution of adults can vary within individual reefs. Oyster settlement 60
has been found to decrease with increasing aerial exposure due to lower submergence time 61
on intertidal reefs; however, adult oyster density increased with greater aerial exposure 62
(Fodrie et al. 2014). 63
The restricted subtidal distribution of oyster reefs in euhaline waters has been 64
attributed to strong post-settlement interspecific competition with epifauna that inhibits 65
subtidal reef growth (Chestnut and Fahy 1953, Ortega and Sutherland 1992, Osman and 66
Whitlatch 1995, Bartol et al. 1999, Bishop and Peterson 2005, Fodrie et al. 2014). In the low- 67
salinity region of estuaries where epibiotic communities are less diverse or absent (Ortega 68
1981), oysters extend into the subtidal zone. One factor that may contribute to oyster reef 69
success in subtidal low-salinity waters is a reduction of oyster mortality from competition. 70
survive in the low to mid intertidal, reducing competition with oysters in the intertidal zone 72
compared to the subtidal zone. Although oysters in euhaline waters have been observed to 73
grow faster and have higher oyster abundance in the intertidal than at subtidal depths, these 74
finding have been primarily observational and the effects of inter-specific competition and 75
predation have been confounded by intraspecific density of oyster recruits (Bishop and 76
Peterson 2006, Fodrie et al. 2014). 77
More is known concerning the role of predation on oyster reefs; however, the 78
understanding of how landscape setting and aerial exposure interact to affect settlement and 79
predation rates remains tenuous. Across the intertidal gradient, predation of newly recruited 80
oysters is greater in the subtidal (Johnson and Smee 2014), but the magnitude or pattern in 81
predation rates may not be a linear from the intertidal to subtidal zones or be the same at all 82
landscapes settings. Previous work has found that intertidal reefs restored along saltmarshes 83
typically have lower oyster densities than isolated reefs (Grabowski et al 2005, Carroll et al 84
2015); however, it is unknown if settlement and/or predation drive these differences. 85
Additionally, increasing reef structural complexity may change predator accessibility and 86
foraging success (Turner 1989). High structural complexity increases prey survival on oyster 87
reefs (Crowder and Cooper 1982, Grabowski 2004) because it reduces predator foraging 88
efficiency relative to unstructured habitats (Summerson and Peterson 1984). An 89
understanding of how settlement and predation vary across landscape settings and aerial 90
exposure is needed to better understand the mechanisms regulating reef growth, as well as 91
how the resulting habitat complexity further alters oyster survival. 92
My dissertation research focused on understanding if and how species interactions 93
species interactions affect species distributions across environmental stress gradients and 95
landscapes, I directly explore how these processes interact to regulate development of a 96
crucial foundation species. I conducted a series of field manipulations to evaluate how 97
settlement, competition and predation affect the fitness of oysters. Specifically, I examined 98
how summer epibiotic communities (Chapter 1) and winter macroalgal fouling communities 99
(Chapter 2) compete for space with juvenile oysters and affect oyster growth and survival 100
across the intertidal. Additionally, I examined how landscape setting and aerial exposure 101
affect the relative rates of new oyster settlement and predation of oyster spat, as well as how 102
habitat complexity further modifies predation rates (Chapter 3). 103
A thorough understanding of oyster reef community ecology, especially the interplay 104
between settlement and mortality from species interactions and how they vary across 105
landscapes and environmental stress gradients, is crucial for effectively conserving and 106
restoring oyster reefs. In North Carolina, for example, restoration projects within the last 107
decade have been sited in the subtidal zone in euhaline waters, even though early work 108
observed that reefs grow best in the intertidal zone (Lanier 1981). Here I build upon recent 109
work that experimentally identified that restoration efforts should focus at elevations within 110
the mid to low intertidal zone in euhaline systems (Fodrie et al 2014). By exploring how 111
species interactions restrict oyster reef development in the subtidal, we can refine science- 112
based oyster restoration methods to avoid negative ecological interactions and maximize 113
restoration success. 114
115
Study Objectives 116
zones by reducing growth and survival of juvenile oysters. 119
Hypothesis 1: Removal of epibiota will reduce competition, increasing growth and 120
survival of oysters causing growth and survival to be equal across all aerial 121
exposures. 122
b. Objective 2: Determine the effects of juvenile oyster body size on how competition 123
with epibiota affects oyster growth and survival across the aerial exposure gradient. 124
Hypothesis 2: Increasing oyster body size will reduce the negative effects of 125
competition with epibiota, particularly at low aerial exposures where epibiota 126
abundance is high. 127
2. The influence of seasonal macroalgae on intertidal oysters 128
a. Objective 1: Characterize the temporal patterns of macroalgal cover across the 129
intertidal gradient. 130
Hypothesis 1: The species composition of macroalgae will shift and the cover of 131
macroalgae with increase with decreasing aerial exposure. 132
b. Objective 2: Quantify the effects of eutrophication on seasonal macroalgal cover. 133
Hypothesis 2: Increasing the nutrient concentration in the water will enhance growth 134
of macroalgae. 135
c. Objective 3: Determine the effect of macroalgae on oyster growth and abundance. 136
Hypothesis 3: Macroalgae will filter oyster larvae and food particles, reducing the 137
oyster abundance and growth. 138
3. Importance of landscape setting and structural complexity on oyster settlement and 139
predation of oyster spat 140
the aerial exposure gradient. 142
Hypothesis: Oyster settlement will increase with decreasing aerial exposure and be 143
higher at isolated oyster reef settings due to higher transport of larvae. 144
b. Objective 2: Elucidate how oyster reef landscape setting affects predation on oysters 145
across the aerial exposure gradient. 146
Hypothesis 2: Reefs fringing salt marshes will have higher settlement rates than 147
isolated oyster reefs and predation will increase with decreasing aerial exposure 148
(higher submergence time for marine predators). 149
c. Objective 3: Determine the effects of habitat structural complexity on oyster 150
predation. 151
Hypothesis 3: Reducing habitat complexity will increase predation rates of oyster 152
REFERENCES 154
Bartol, I., R. Mann, and M. Luckenbach. 1999. Growth and mortality of oysters (Crassostrea 155
virginica) on constructed intertidal reefs: effects of tidal height and substrate level. 156
Journal of Experimental Marine Biology and Ecology 237:157–184. 157
Bishop, M. J., and C. H. Peterson. 2005. Constraints to Crassostrea ariakensis aquaculture: 158
season and method of culture strongly influence success of grow-out.: An article from: 159
Journal of Shellfish Research. Thomson Gale. 160
Bishop, M. J., and C. H. Peterson. 2006. Direct effects of physical stress can be counteracted 161
by indirect benefits: oyster growth on a tidal elevation gradient 147:426–433. 162
Boström, C., S. J. Pittman, C. Simenstad, and R. T. Kneib. 2011. Seascape ecology of coastal 163
biogenic habitats: advances, gaps, and challenges. Marine Ecology Progress Series 164
427:191–217. 165
Bruno, J., J. Stachowicz, and M. Bertness. 2003. Inclusion of facilitation into ecological 166
theory. Trends in Ecology & Evolution 18:119–125. 167
Chestnut, A. F., and E. W. Fahy. 1953. Studies on the vertical distribution of setting of 168
oysters in North Carolina. Proceedings of the Gulf and Caribbean Fisheries Institute 5. 169
Connell, J. 1961a. Effects of competition, predation by Thais lapillus, and other factors on 170
natural populations of the barnacle Balanus balanoides. Ecological Monographs 31:61– 171
104. 172
Connell, J. 1961b. The influence of interspecific competition and other factors on the 173
distribution of the barnacle Chthamalus stellatus. Ecology 42:710–723. 174
Crain, C. M., B. R. Silliman, S. L. Bertness, and M. D. Bertness. 2004. Physical and Biotic 175
Drivers of Plant Distribution across Estuarine Salinity Gradients. Ecology 85:2539– 176
2549. 177
Fodrie, F. J., A. B. Rodriguez, C. J. Baillie, M. C. Brodeur, S. E. Coleman, R. K. Gittman, D. 178
A. Keller, M. D. Kenworthy, A. K. Poray, J. T. Ridge, E. J. Theuerkauf, and N. L. 179
Lindquist. 2014. Classic paradigms in a novel environment: inserting food web and 180
productivity lessons from rocky shores and saltmarshes into biogenic reef restoration. 181
Journal of Applied Ecology 51:1314–1325. 182
Grabowski, J., A. Hughes, D. Kimbro, and M. Dolan. 2005. How habitat setting influences 183
restored oyster reef communities. Ecology 86:1926–1935. 184
Harley, C. 2003. Abiotic stress and herbivory interact to set range limits across a two- 185
dimensional stress gradient. Ecology 84:1477–1488. 186
42:837–845. 189
Lanier, L. M. B. A. W. P. 1981. The Ecology of Intertidal Oyster Reefs of the South Atlantic 190
Coast: A Community Profile:1–118. 191
Lenihan, H., C. Peterson, J. Byers, J. Grabowski, G. Thayer, and D. Colby. 2001. Cascading 192
of habitat degradation: oyster reefs invaded by refugee fishes escaping stress. Ecological 193
Applications 11:764–782. 194
Liancourt, P., R. M. Callaway, and R. Michalet. 2005. Stress tolerance and competitive- 195
response ability determine the outcome of biotic interactions. Ecology 86:1611–1618. 196
Lindsey, E. L., A. H. Altieri, and J. D. Witman. 2006. Influence of biogenic habitat on the 197
recruitment and distribution of a subtidal xanthid crab. Marine Ecology Progress Series 198
306:223–231. 199
Menge, B. A. 1976. Organization of the New England Rocky Intertidal Community: Role of 200
Predation, Competition, and Environmental Heterogeneity. Ecological Monographs 201
46:355. 202
Menge, B. A. 2000. Recruitment vs. postrecruitment processes as determinants of barnacle 203
population abundance. Ecological Monographs 70:265–288. 204
Menge, B. A., and J. P. Sutherland. 1987a. Community regulation: variation in disturbance, 205
competition, and predation in relation to environmental stress and recruitment. American 206
Naturalist 130:730–757. 207
Menge, B. A., and J. P. Sutherland. 1987b. Community Regulation: Variation in Disturbance, 208
Competition, and Predation in Relation to Environmental Stress and Recruitment. 209
American Naturalist 130:730. 210
Menge, B. A., and J. P. Sutherland. 2001. Community Regulation: Variation in Disturbance, 211
Competition, and Predation in Relation to Environmental Stress and Recruitment. 212
Menge, B. A., M. M. Foley, J. Pamplin, G. Murphy, and C. Pennington. 2010. Journal of 213
Experimental Marine Biology and Ecology. Journal of Experimental Marine Biology and 214
Ecology 392:160–175. 215
Micheli, F., and C. H. Peterson. 1999. Estuarine vegetated habitats as corridors for predator 216
movements. Conservation Biology 13:869–881. 217
Ortega, S. 1981. Environmental Stress, Competition and Dominance of Crassostrea virginica 218
near Beaufort, North Carolina, USA. Marine Biology 62:47–56. 219
Ortega, S., and J. P. Sutherland. 1992. Recruitment and growth of the Eastern oyster, 220
Crassostrea virginica, in North Carolina. Estuaries and Coasts 15:158–170. 221
comparison to settlement. Journal of Experimental Marine Biology and Ecology 223
190:169–198. 224
Paine, R. 1966. Food web complexity and species diversity. The American Naturalist 100:65. 225
Rilov, G., and D. R. Schiel. 2006. Seascape-dependent subtidal-intertidal trophic linkages. 226
Ecology 87:731–744. 227
Turner, M. G. 1989. Landscape Ecology: The Effect of Pattern on Process. Annual Review 228
of Ecology and Systematics 20:171–197. 229
Underwood, A. J., and P. G. Fairweather. 1989. Supply-side ecology and benthic marine 230
assemblages. Trends in Ecology & Evolution 4:16–20. 231
Walles, B., F. J. Fodrie, S. Nieuwhof, O. J. D. Jewell, P. M. J. Herman, and T. Ysebaert. 232
2016. Guidelines for evaluating performance of oyster habitat restoration should include 233
tidal emersion: reply to Baggett et al. Restoration Ecology 24:4–7. 234
Wells, H. W. 1961. The Fauna of Oyster Beds, with Special Reference to the Salinity Factor. 235
Ecological Monographs 31:239. 236
Wright, J. T., and P. D. Steinberg. 2001. Effect of variable recruitment and post-recruitment 237
herbivory on local abundance of a marine alga. Ecology 82:2200–2215. 238
CHAPTER 1: EFFECTS OF INTERSPECIFIC COMPETITION ARE MEDIATED BY BODY SIZE AND ENVIRONMENTAL STRESS IN A BIOGENIC REEF COMMUNITY1
Introduction
An underlying goal of ecology is to understand the mechanisms controlling species distributions and abundance. The impacts of physiological stress and interspecific
interactions, including competition for shared resources (Connell 1961a, 1961b) and predation (Paine 1966), have been tested across numerous environmental stress gradients (Menge 2000, Helmuth 2002, Harley 2003, Crain et al. 2004, Liancourt et al. 2005). Patterns consistently observed across these systems have been integrated into environmental stress models that describe the relative importance of physiological stress, competition, predation, and facilitation at varying levels of recruitment (Menge and Sutherland 1987, Menge 2000, Bruno et al. 2003). For organisms at intermediate trophic levels, abiotic stress tolerance is the most important in determining the relative abundance of a species at high stress levels. Communities that experience severe environmental stress are characteristically comprised of predominately sessile species, as mobile species leave habitats when conditions become too harsh (Menge and Sutherland 1976, 1987). At low environmental stress, the relative
importance of predation is greatest, while competition becomes most important at intermediate stress levels when recruitment is high.
The littoral zone is an ideal system to test environmental stress models on intermediate trophic levels. The differences in species tolerance to aerial exposure and interactions with neighbors produce distinct zones across a small area, providing an opportunity to use experimental manipulations to examine underlying mechanisms. The competitive ability of sessile species is typically inversely related with abiotic stress
tolerance (Connell 1961b, 1961a, Liancourt et al. 2005), indicating a tradeoff between these two characteristics. For example, the salt marsh grass Spartina patens cannot withstand the physiological stress of the low intertidal zone where increased inundation results in greater salinity and anoxic stress (Bertness 1991). Conversely, Spartina alterniflora, can tolerate the stress of the low intertidal, but is competitively excluded from the less stressful, high
intertidal zone by S. patens when recruitment of S. patens is high. For marine invertebrates, desiccation and thermal stress are associated with increasing aerial exposure in the intertidal zone (i.e., higher elevations), therefore aerial exposure tolerance determines how high in the intertidal an organism can survive (Connell 1961a, 1972, Hacker and Gaines 1997).
overgrowing the smaller in the rocky subtidal of New England (Sebens 1982). Through faster growth rates, organisms can reach a size refuge and become less susceptible to competition with neighbors that settle simultaneously (McFadden 1986, Wethey 2002). Conversely, if an organism recruits earlier than its competitors, it may have an increased window for growth to also obtain a larger body size (Sutherland and Karlson 1977).
The advantage of increased body size to competitive ability should be the greatest at moderate stress levels, where competition is the most important in regulating populations (see Fig. 1). As the importance of competition declines at low and high environmental stress the advantage of increased body size for competitive ability should also become less
important in controlling species distributions. Recent work has shown that changes in competitive ability, due to temperature-dependent growth increases, can shift distributions along intertidal gradients (Wethey 2002).
Eastern oyster (Crassostrea virginica) reefs in euhaline waters are an excellent model system to test how body size, interspecific competition and aerial exposure interact to affect foundation species. Oysters can withstand extended periods of aerial exposure and create reefs by growing vertically upon conspecifics in the intertidal, forming a natural
environmental stress gradient of increasing aerial exposure. Many organisms in
Whitlatch 1995, Bartol et al. 1999, Fodrie et al. 2014). Oysters in euhaline waters have also been observed to grow better in the intertidal than at subtidal depths, but these findings have been primarily qualitative and/or confounded by intraspecific density of oyster recruits (Bishop and Peterson 2006, Trimble et al. 2009, Fodrie et al. 2014). Additionally, in the low-salinity region of estuaries where epibiotic communities are less diverse or absent (Ortega 1981), oysters extend into the subtidal zone, indicating that oyster reef success in subtidal waters may in part be due to the reduction of oyster mortality from interspecific competitors.
Although reduced oyster fitness across the aerial exposure gradient has been attributed to interactions with epibiota, there has been no empirical test to determine if interspecific competition limits the distribution of oysters in euhaline estuaries. Furthermore, oyster settlement also occurs over the summer months (Ortega and Sutherland 1992) and growth is variable, creating a range in the size of oyster recruits on reefs. However, it remains unclear whether larger oyster recruits are less susceptible to the negative effects of interspecific competition. I conducted a field experiment to evaluate: (1) how does
Methods
I manipulated epibiota presence to experimentally determine if interspecific
competition negatively affected oyster spat fitness, and if an increase in the body size of spat (<5mm or 40%) alleviated the negative effects of epibiota on oyster fitness across an aerial exposure gradient. I manipulated epibiota presence (ambient epibiota, epibiota removed), oyster spat size class (small, 9.9 ± 0.3 mm shell height; large, 13.8 ± 0.4 mm shell height), and aerial exposure stress (from mid-intertidal to subtidal or -0.3, -0.5, -0.7, and -0.9 m (relative to the North Atlantic Vertical Datum of 1988)) in a fully crossed design (n = 8).
Oyster spat were collected by deploying recycled oyster cultch shells (105 mm shell height on average) onto intertidal flats in May 2012 and allowing oyster larvae to settle on the shells. Shell was deployed at Middle Marsh and Carrot Island, both of which are located within in the euhaline portion of Back Sound, North Carolina in the Rachel Carson National Estuarine Research Reserve and experience a mean monthly tidal range of 0.9 m. Habitats in both sites are representative of estuarine marsh complexes in relic flood tidal deltas and consist of a mosaic of natural oyster reefs, seagrass meadows, saltmarshes and sandflats. Once spat had naturally seeded cultch shell, the shells were collected in mid -July.
I prepared the collected shells by gently scraping off all epibiota and reducing the density of juvenile oysters through targeted removals to an abundance of 7 spat on the smooth interior of each shell. This standardized oyster density for each replicate cultch shell and spaced oysters sufficiently to limit competition between individual oysters for
attachment space. Oyster spat collected from the two sites formed distinct size classes (Analysis of Variance; F15,108 = 59.40, p < 0.001) with the small size class shell height
0.4 mm (Carrot Island). Differences in body size are most likely due to small differences in settlement timing and not representative of distinct oyster stocks due to the proximity between the two sites (<1 km).
The naturally seeded cultch shells were randomly assigned a position along a vertical rack at one of four depths (-0.3, -0.5, -0.7, and -0.9 m NAVD 88), secured at the umbo, and suspended downwards. The experimental rack was deployed in Middle Marsh on July 16, 2012, adjacent to natural oyster reefs to place each treatment at the desired aerial exposures. Oysters were suspended to reduce the influences of other confounding processes that reduce oyster fitness, particularly sedimentation and predation. Although I was unable to exclude all mobile nektonic predators from accessing experimental racks, the racks reduced the
abundance of predators that reside in the reef (e.g., mud crabs, stone crabs, oyster drills etc.) to practically zero based on serial observation during rack maintenance and monitoring (e.g., on average sheepshead grazing scars covered >1% of experimental shells over the duration of the experiment). A Trimble® RTK GPS, with a vertical precision of <1.5 cm, was used to measure the elevation at the base of the experimental racks. Aerial exposures were calculated for target elevations using water level data and methods of Ridge et al. (2015). Using these data, the elevations of -0.3, -0.5, -0.7, and -0.9 m NAVD 88 had aerial exposures of 23.9%, 4.9%, 0.2%, 0% of the day, respectively.
ensured that epifauna densities were high enough to allow epifauna to interact and compete for attachment space and/or indirectly interfere with oysters (reducing food or degrading local water quality). Monitoring also confirmed that epibiota removals were effective throughout the experiment, and significantly lowered the cover of fouling invertebrates (repeated measures ANOVA, p < 0.001). At the end of the experiment, average cover on ambient epibiota treatments was 98.0 ± 0.03% (µ ± 1SE) and cover in the epibiota removal treatments was 18.4 ± 0.02% (Fig. 2, F15,108 = 380.354, p < 0.001). The size (shell height, measured as the longest vertical axis from the umbo) of visible oysters was also measured; however, high cover of fouling organisms on shells with ambient epifauna treatments prevented us from rigorously quantifying oyster survival and size until the end of the experiment when I could completely remove all epibiota.
After four months (November 2012) I collected shells from the experimental racks and enumerated species abundance of all organisms and estimated percent cover of all sessile invertebrates in the lab. When invertebrates recruited directly on top of each other I measured the total cover of each species; therefore, the percent cover of all species summed could exceed 100%. Once quantified, I removed all epifauna from the shells to enumerate oysters and measure shell height of all living oysters. Oyster survival (%) was calculated at the end of the experiment. Growth of surviving oysters was also calculated as the relative increase (%) in average shell height of each replicate ([final size – initial size] / initial size) from the beginning to the end of the experiment.
Statistical Analysis
presence, and aerial exposure treatments on the total percent cover of epibiota, canopy-forming epibiota (Sutherland 1974), and most common invertebrate species found on shells. The cover of canopy-forming epibiota did not meet the assumptions of normality or equal variance and therefore was Box-Cox Y transformed before I tested the effects of the independent variables with a three-way Analysis of Variance (ANOVA). The effect of independent variables on the total cover of all organisms, percent cover of barnacles, and abundance of mobile invertebrates were tested with Kruskal-Wallis tests because values did not meet assumptions of parametric statistics after transformation.
To understand how oyster fitness was affected by size, epibiota presence, and aerial exposure I also conducted a three-way ANOVA testing the independent and interactive effects of our manipulations on oyster survival and average growth. Both dependent variables failed to meet the assumptions of normality and equal variance and were Box-Cox Y
transformed (growth) or arcsine square root-transformed (survival) to meet these
assumptions. Post-hoc comparisons were conducted with Student’s t-test for all significant interactions and main effects to determine whether there were significant differences between unique treatments. All analyses were performed using JMP software version 10.0 (SAS Institute 2010).
Results
Oyster Survival
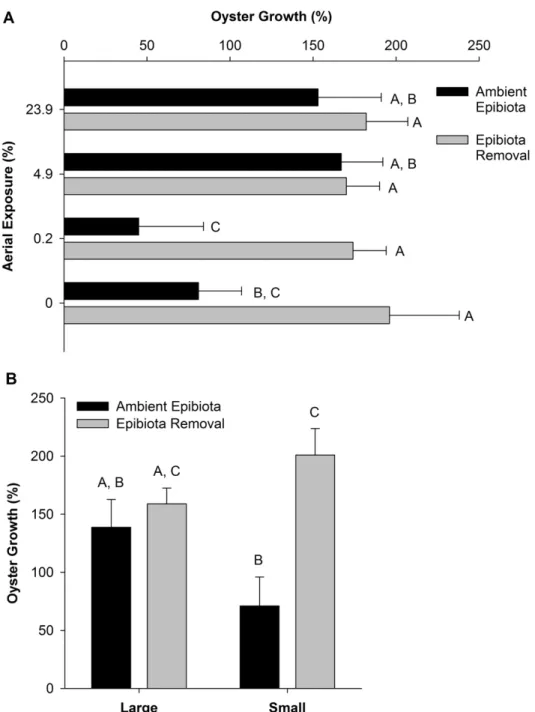
small size class; survival of large oysters was 7.5 percentage points greater than small oysters regardless of aerial exposure (Fig. 3B, F15,108 = 5.248, p = 0.016). There were no differences in oyster survival across aerial exposures (F15,108 = 0.719, p = 0.543) or interactions between aerial exposure, epibiota removal, or body size.
Oyster growth
Growth of the surviving oysters in response to epibiota presence varied with aerial exposure (epibiota x aerial exposure, F15,57 = 4.173, p = 0.020). When epibiota were removed, oysters grew by an average of 180.6 ± 13.7% of their initial body size during the duration of the experiment. There were no significant differences between aerial exposures (Fig. 4A), but when epibiota were present, oyster growth diminished with decreasing aerial exposure. Oyster growth of ambient epibiota treatments at the highest two aerial exposures (23.9% and 4.9% exposed) were not different than all epibiota removal treatments. However, growth of oysters exposed to ambient epibiota cover decreased by an order of magnitude relative to epibiota removal treatments. Under ambient epibiota cover, oyster body size only increased by 45.5 ± 78.6% at 0.2% exposure and 81.0 ± 51.2% at 0% exposure, respectively.
Epibiotic community
Epibiota quickly recruited to shells, and barnacles were the first and most abundant species to settle. By the first monitoring period (August 8th), barnacle densities were 99.9 ± 6.1 (µ ± 1SE) barnacles/shell in ambient epibiota treatments and included Balanus spp. and Chthamalus fragilis. High barnacle densities persisted through the end of the experiment
(Fig. 2A). Barnacles represented 95% of the epibiota community overall and covered 93.1 ± 2.1% of the inner side of cultch shells in ambient epibiota treatments, as compared to
covering 14.3 ± 0.1% for epibiota removal treatments (F15,108 = 521.929, p < 0.001). Total epibiotic cover (F15,108 = 1.196, p = 0.315) and individual species cover did not significantly change with aerial exposure (Fig. 2A), but there was a significant reduction of canopy-forming invertebrates (bryozoans Bugula neritina and Bugula avicularia, the hydroid Tubularia crocea, and tunicates Stylea plicata and Didemnum duplicatum) with increasing
aerial exposure (Fig. 2B, F15,108 = 7.476, p = 0.001). Abundances of other bivalves,
gastropods, and polychaetes were present in low densities, but exhibited no patterns across treatments.
Discussion
I found that interspecific interactions between oysters and epibiota reduced the fitness of oyster recruits; however, oyster body size and aerial exposure stress mediated the
with canopy-forming fouling organisms increased with decreasing aerial exposure and reduced oyster growth at low aerial exposures. Thus, our results confirm that high
recruitment of epibiota causes high mortality and reduced growth of oyster recruits on reefs. However, oysters with a larger body size may experience greater survival and growth rates relative to small spat when exposed to competitors.
The presence of epibiota significantly reduced survival of oyster spat irrespective of oyster size or aerial exposure, presumably due to the high recruitment and overgrowth of encrusting barnacles across all aerial exposures. This result is consistent with previous work than has shown that barnacles reduce oyster spat survival via overgrowth (Boudreaux et al 2009). Since barnacles are tolerant to aerial exposure and settlement is continuous throughout summer (Sutherland and Karlson 1977), oyster spat were almost completely covered by barnacles in the ambient epifauna treatments throughout our experiment. Barnacle
recruitment is also high in areas of high flow (Ortega 1981) and have an affinity to settle on new shell material (Ortega and Sutherland 1992). These factors enhanced barnacle densities on experimental racks, and combined with the isolation from predators of barnacles found on reefs, may have caused the considerable overgrowth of oysters relative to what is found on both natural and newly restored reefs.
oyster feeding because oysters may perceive the risk of predators taking refuge in the canopy (Sih 1980) or the allelopathic effects of competitors (Kennedy et al. 1996, Lopanik et al. 2004). Reduced oyster growth with decreasing aerial exposure correlated with the presence of canopy-forming fouling organisms (including bryozoans, hydroids and tunicates), which supports previous growth patterns of intertidal oysters. Bishop and Peterson (2006) also observed that despite a 93% reduction in feeding time, Crassostrea ariakensis grew 34% faster in the intertidal than the subtidal areas where oysters were covered by epibiota. Growth patterns also parallel results from restored experimental reefs along the same aerial exposure gradient, in which oysters exhibited lowest growth in the subtidal (Fodrie et al. 2014). Because I did not track the growth of individual oysters throughout the experiment, size-selective predation or mortality from physiological stress may have confounded growth measurements throughout the experiment. However, final oyster growth was greater than one standard deviation of the mean initial oyster shell height for both size classes in ambient epibiota treatments, indicating that the limited growth observed was not strictly due to mortality of the largest individuals in each replicate, but incorporates growth.
were elevated from the benthos at high aerial exposures in our design, oysters may have experienced enhanced flow and food delivery relative to that of a reef.
Considering that interference competition with canopy forming epibiota increased with decreasing aerial exposure, I expected oyster body size to become more important to oyster fitness as aerial exposure decreased. However, high cover of encrusting epibiota (barnacles) reduced survival drastically across all aerial exposures causing no differences among aerial exposures or interactions between body size and aerial exposure. Although oyster survival was low across all size classes when epibiota were present, larger individuals exhibited greater survival than smaller oysters. These results also suggest that an increase in oyster body size also prevented oysters from experiencing reduced growth when exposed to epibiota. Thus, increased body size created a partial size refuge from competition for larger oyster spat, where growth was less hindered by interactions with the canopy forming epibiota at low aerial exposures than small spat.
predation, and contribute to the patterns observed in intertidal oyster reef development (Chestnut and Fahy 1953, Ortega and Sutherland 1992, Osman and Whitlatch 1995, Bartol et al. 1999, Fodrie et al. 2014).
The interplay of environmental stress, species interactions and body size largely determines the growth and survival, and thus, distribution of species that live along
environmental stress gradients. The design I employed separated the effects of interspecific competition from other mechanisms that are thought to reduce fitness. This study provides evidence that as juveniles, interference competition and overgrowth reduces fitness of intermediate trophic level species at low environmental stress. Additionally, a small (4 mm), but proportionately significant (40%), increase in body size can alleviate the negative effects of competitors on growth and mortality of intermediate species.
Figure 1.3 Oyster survival (% ± 1SE) for two epibiota treatments at: (A) four aerial
Figure 1.4 Growth of the surviving oysters at the end of the experiment (% ± 1SE),
REFERENCES
Bartol, I., R. Mann, and M. Luckenbach. 1999. Growth and mortality of oysters (Crassostrea virginica) on constructed intertidal reefs: effects of tidal height and substrate level. Journal of Experimental Marine Biology and Ecology 237:157–184.
Bertness, M. D. 1991. Zonation of Spartina patens and Spartina alterniflora in a New-England salt-marsh. Ecology 72:138–148.
Bishop, M. J., and C. H. Peterson. 2006. Direct effects of physical stress can be counteracted by indirect benefits: oyster growth on a tidal elevation gradient. Oecologia 147:426–433. Bruno, J. F., J. J. Stachowicz, and M. D. Bertness. 2003. Inclusion of facilitation into
ecological theory. Trends in Ecology & Evolution 18:119–125.
Buss, L. W. 1980. Competitive Intransitivity and size-frequency distributions of interacting populations. Proceedings of the National Academy of Sciences of the United States of America 77:5355–5359.
Buss, L. W., and J. B. Jackson. 1981. Planktonic food availability and suspension-feeder abundance: evidence of in situ depletion. Journal of Experimental Marine Biology and Ecology 49:151–161.
Chestnut, A. F., and E. W. Fahy. 1953. Studies on the vertical distribution of setting of oysters in North Carolina. Proceedings of the Gulf and Caribbean Fisheries Institute 5:106–112.
Connell, J. 1961a. Effects of competition, predation by Thais lapillus, and other factors on natural populations of the barnacle Balanus balanoides. Ecological Monographs 31:61– 104.
Connell, J. 1961b. The influence of interspecific competition and other factors on the distribution of the barnacle Chthamalus stellatus. Ecology 42:710–723.
Connell, J. H. 1972. Community Interactions on Marine Rocky Intertidal Shores. Annual Review of Ecology and Systematics 3:169–192.
Crain, C. M., B. R. Silliman, S. L. Bertness, and M. D. Bertness. 2004. Physical and Biotic Drivers of Plant Distribution across Estuarine Salinity Gradients. Ecology 85:2539– 2549.
Ferguson, N., C. R. White, and D. J. Marshall. 2013. Competition in benthic marine invertebrates: the unrecognized role of exploitative competition for oxygen. Ecology 94:126–135.
productivity lessons from rocky shores and saltmarshes into biogenic reef restoration. Journal of Applied Ecology 51:1314–1325.
Hacker, S. D., and S. D. Gaines. 1997. Some implications of direct positive interactions for community species diversity. Ecology 78:1990.
Harley, C. D. 2003. Abiotic stress and herbivory interact to set range limits across a two-dimensional stress gradient. Ecology 84:1477–1488.
Helmuth, B. 2002. How do we measure the environment? Linking intertidal thermal physiology and ecology through biophysics. Integrative and Comparative Biology 42:837–845.
Jackson, J. B. 1977. Competition on marine hard substrata: the adaptive significance of solitary and colonial strategies. American Naturalist 111:1–26.
Kennedy, V. S., R. Newell, and A. F. Eble, editors. 1996. The eastern oyster: Crassostrea virginica. Maryland Sea Grant, College Park, MD.
Lenihan, H. S., C. H. Peterson, and J. M. Allen. 1996. Does flow speed also have a direct effect on growth of active suspension-feeders: An experimental test on oysters. Limnology and Oceanography 41:1359–1366.
Liancourt, P., R. M. Callaway, and R. Michalet. 2005. Stress tolerance and competitive-response ability determine the outcome of biotic interactions. Ecology 86:1611–1618. Lopanik, N., N. Lindquist, and N. Targett. 2004. Potent cytotoxins produced by a microbial
symbiont protect host larvae from predation. Oecologia 139:131–139.
McFadden, C. S. 1986. Laboratory evidence for a size refuge in competitive interactions between the hydroids Hydractinia echinata (Flemming) and Podocoryne carnea (Sars). Biological Bulletin 171:161–174.
Menge, B. A. 2000. Recruitment vs. postrecruitment processes as determinants of barnacle population abundance. Ecological Monographs 70:265–288.
Menge, B. A., and J. P. Sutherland. 1976. Species Diversity Gradients: Synthesis of the Roles of Predation, Competition, and Temporal Heterogeneity. The American Naturalist
110:351–369.
Menge, B. A., and J. P. Sutherland. 1987. Community Regulation: Variation in Disturbance, Competition, and Predation in Relation to Environmental Stress and Recruitment. American Naturalist 130:730–757.
Okamura, B. 1990. Particle size, flow velocity, and suspension-feeding by the erect bryozoans Bugula neritina and B. stolonifera. Marine Biology 105:33–38.
Marine Bryozoan. Ecology 73:1502.
Ortega, S. 1981. Environmental Stress, Competition and Dominance of Crassostrea virginica near Beaufort, North Carolina, USA. Marine Biology 62:47–56.
Ortega, S., and J. P. Sutherland. 1992. Recruitment and growth of the Eastern oyster, Crassostrea virginica, in North Carolina. Estuaries and Coasts 15:158–170.
Osman, R. W., and R. B. Whitlatch. 1995. The influence of resident adults on recruitment: a comparison to settlement. Journal of Experimental Marine Biology and Ecology
190:169–198.
Paine, R. T. 1966. Food web complexity and species diversity. The American Naturalist 100:65–75.
Peterson, C. H., and R. Black. 1987. Resource depletion by active suspension feeders on tidal flats: influence of local density and tidal elevation. Limnology and Oceanography
32:143–166.
Ridge, J. T., A. B. Rodriguez, F. J. Fodrie, N. L. Lindquist, M. C. Brodeur, S. E. Coleman, J. H. Grabowski, and E. J. Theuerkauf. 2015. Maximizing oyster-reef growth supports green infrastructure with accelerating sea-level rise. Scientific Reports 5:14785–14785. Roegner, G. C., and R. L. Mann. 1995. Early recruitment and growth of the American oyster
Crassostrea virginica (Bivalvia: Ostreidae) with respect to tidal zonation and season. Marine Ecology Progress Series 117:91–101.
Sebens, K. P. 1982. Competition for Space - Growth-Rate, Reproductive Output, and Escape in Size. American Naturalist 120:189–197.
Sih, A. 1980. Optimal behavior: can foragers balance two conflicting demands? Science 210:1041–1043.
Sutherland, J. P. 1974. Multiple stable points in natural communities. American Naturalist 108:859–873.
Sutherland, J. P., and R. H. Karlson. 1977. Development and stability of the fouling community at Beaufort, North Carolina. Ecological Monographs 47:425–446. Svensson, J. R., and D. J. Marshall. 2015. Limiting resources in sessile systems: food
enhances diversity and growth of suspension feeders despite available space. Ecology 96:819–827.
Thompson, M. L., D. J. Marshall, and K. Monro. 2015. Non-contact competition in a sessile marine invertebrate: causes and consequences. Marine Ecology Progress Series 522:115– 125.
a historically overexploited shellfish species, Ostrea lurida Carpenter 1864. Journal of Shellfish Research 28:97–106.
Wethey, D. S. 2002. Biogeography, competition, and microclimate: The barnacle
CHAPTER 2: DYNAMICS AND DRIVERS OF SEASONAL MACROALGAE ON BIOGENIC REEFS AND THE EFFECTS ON OYSTER FITNESS
Introduction
Foundation species facilitate epifaunal communities by providing suitable habitat for settlement (Bertness and Callaway 1994, Bruno et al. 2003). Eastern oyster (Crassostrea virginica) reefs are some of the only naturally occurring hard substrates in soft-bottom
estuaries and provide essential habitat for diverse epifaunal assemblages of barnacles, bryozoans, tunicates, and macroalgae (Wells 1961, Sutherland and Karlson 1977, Bahr and Lanier 1981, Meyer and Townsend 2000). Although oyster reefs serve as an essential settlement substrate for epifauna (Grabowski and Peterson 2007), high rates of epifaunal recruitment can be harmful to oyster fitness and the growth of oyster reefs (Bishop and Peterson 2005, Barnes et al. 2010, Barnes and Dick 2014). Therefore, a thorough
understanding of the mechanisms that control the development of epifaunal communities is critical for addressing how eutrophication and climate change may affect oyster reefs.
Numerous abiotic factors can co-regulate the development and persistence of macroalgal mats on oyster reefs. Nutrients limit macroalgal primary productivity and seasonal nutrient patterns may control macroalgal dynamics (Valiela et al. 1997). Fast growing, ephemeral macroalgae respond quickly to increases in nutrients, but also have a high nutrient demand; therefore, productivity is more often limited by nitrogen (Taylor et al. 1995). Photosynthesis, and ultimately primary production, is also limited by water
temperature (Beer and Eshel 1983). If summer water temperatures rise above the thermal limit for the dominant macroalgal species (Rivers and Peckol 1995), it will reduce in
macroalgal cover in the summer months. Additionally, intertidal macroalgal communities are also limited by desiccation tolerance, which is a function of the interaction between the air temperature and the duration epifauna are aerially exposed at low tide (Underwood 1981, Henley et al. 1992). Macroalgae on intertidal oyster reefs may be able to withstand exposure at extreme winter low tides, but not once the air temperature exceeds thermal tolerance.
Biotic mechanisms may also control macroalgal cover, as the decline of macroalgae coincides with seasonal increases in invertebrate and fish communities in the spring (Nelson 1979). Mesograzers - small herbivores including amphipods - play important roles in
The seasonal dynamics of macroalgal mats are likely impacted by human-driven eutrophication and warming. Use of the coastal zone has resulted in nutrient enrichment, which promotes algal blooms and has cascading negative effects on coastal ecosystems (Valiela et al. 1997). Increases in local nutrient concentrations can augment macroalgal biomass or even extend the duration of seasonal algae if it is nutrient limited. Additionally, human-induced ocean warming can shift the timing of macroalgal development to earlier in the year if water temperature restricts when macroalgae can grow (Gao et al. 2012). Warming also alters the timing of reproduction of mesograzers and fishes, causing temporal mismatch and changes in top-down forcing on macroalgae (Platt et al. 2003, Kordas et al. 2011). Increasing water temperature also strengthens herbivore-algal interactions (O'Connor 2009, Carr and Bruno 2013) as metabolic rates of consumers increase at a greater rate than the metabolic rates of primary producers. This may result in a trophic skew, causing a faster decline in seasonal macroalgae by enhanced grazing. In sum, the relative importance of biotic and abiotic factors will determine how macroalgal mats respond to changes in water quality within the estuary.
eutrophication or regional warming increases the biomass and/or timing of macroalgal cover, it may have subsequent negative effects on oyster reef recruitment and growth.
The main objectives of this study were to quantify the seasonal macroalgal dynamics and to understand the abiotic and biotic mechanisms controlling macroalgal cover. Further, I wanted to understand if macroalgae negatively affects the underlying oyster reef.
Specifically, our questions were: (1) What are the seasonal patterns of macroalgae on intertidal oyster reefs? (2) Is the seasonal decline in macroalgal cover controlled by biotic and/or abiotic forcing? (3) How does nutrient enrichment alter the seasonal distribution of macroalgae? And, (4) does seasonal macroalgae have negative effects on oyster fitness? I answer these research questions using seasonal monitoring and manipulative field
experiments. By quantifying the seasonal dynamics and understanding how abiotic and biotic mechanisms control macroalgal growth, we can better manage oyster reef communities as eutrophication and climate change continue to affect coastal ecosystems.
Methods Study site
Monitoring
I selected 16 intertidal oyster reefs located within Middle Marsh at two restoration settings; half being natural reefs and the other half were restored reefs from 1997 and 2000 (Grabowski et al. 2005). On each reef, I established 0.25m2-monitoring plots at two
elevations to quantify the seasonal cycle of macroalgae. All elevations are reported in
reference to the North American Vertical Datum established in 1988 (NAVD88), where local mean sea level is approximately 0.03 m NAVD88. High elevation plots were marked at -0.26 ± 0.02 m and low elevation plots were at -0.40 ± 0.01 m, near mean low water (MLW). Once macroalgae began to develop in January 2012, I estimated the percent cover of each species within each plot every two weeks at low tide. Monitoring occurred until total macroalgal cover was below 10% on average in May 2012.
On each monitoring date, I also quantified nekton and mesograzer communities at each reef. Two unbaited minnow traps were deployed at the base of the reef to capture local nekton, and grazer abundance was monitored by deploying frayed ropes which grazers typically recruit to. After a 24-hour soak time, fishes were identified, enumerated, and weighted and grazer ropes were bought back to the lab to quantify mesograzer abundance.
Effects of nutrients on macroalgal cover
To determine if increasing nutrient concentrations in the estuary would increase the abundance or duration of macroalgal cover I conducted a manipulative field experiment where I altered nutrient concentrations at half of the reefs and monitored macroalgal cover (n = 4). In December 2010 before the macroalgal mats began to develop, PVC dispensers were filled with 100 g OsmocoteTM slow release fertilizer (N:P2O5:K2O, 15:9:2%) and placed on the reef. Macroalgal percent cover was estimated from January through the end of May 2011 when cover was 10%. Fertilizer was replaced every two weeks to ensure that nutrients were constantly being released into the reef.
Effects of top-down control on macroalgal cover
To understand if biotic mechanisms control seasonal macroalgae, I conducted a caging experiment whereby I excluded mesograzers and nekton from the reefs in a fully orthogonal design (n=6). Once macroalgae had reached 100% cover on reefs in March 2011, I collected oyster clumps with attached algae from nearby reefs and placed them into a 0.10-m2 vexar basket. Baskets were then placed onto plots on an intertidal sandflat and were assigned a randomized treatment.
A half-cage was used and compared to the uncaged control to determine if artifacts from excluding nekton with a cage, including reduced light attenuation and flow,
organisms (Carpenter 1986, Duffy and Hay 2000, Dumbauld et al. 2001) as it degrades quickly (Armbrust and Crosby 1991, Whalen et al 2013).
Macroalgae was monitored every two weeks until macroalgal cover began to decline, when I monitored macroalgae every week until total average cover declined to less than 10%. If macroalgae cover declined at the same rate in control treatments as the grazer and nekton exclusion (no biotic control), it suggests that abiotic controls are the primary driver of the seasonal decline of macroalgae. It would assume that macroalgae was controlled by biotic controls if macroalgae declined slower when you excluded grazers and nekton than the control. If only grazers were responsible for top-down biotic control, nekton exclusion treatments would have the fastest rates of macroalgal decline because nekton removal would allow grazers to reproduce and graze freely, increasing herbivory on macroalgae. However, if fishes also consume macroalgae directly, it would indicate that macroalgae in the grazer exclusion treatment decline faster than when both grazers and nekton were excluded. Effects of macroalgal cover on oyster fitness
Additionally, I conducted an experiment to understand the effects of macroalgal fouling on oyster growth. I collected clumps of ten ~6-month old juvenile oysters in January 2012 that had recruited to experimental oyster reefs created the previous summer. Individual oysters were labeled and measured before deploying pairs of clumps at the two plot
elevations (high, low) on intertidal reefs. One clump was placed in the monitoring plot and another clump one meter away at the same elevation in the algal removal plot. Every two weeks, I manually removed all algal biomass within a 0.25m2 area around one clump per pair, being careful not to disturb the oysters, until macroalgal cover naturally declined to less than 10%. All oyster clumps were collected in May and individuals were measured to
calculate growth over the 5 months. Statistical Analyses
To assess the effects of plot elevation and restoration setting (fixed effects) on macroalgal cover over time, I fit a linear mixed effect model using the maximum likelihood framework with plot nested within sampling date (random effect). For the nutrient
experiment I used the same mixed model design as with the algal monitoring nutrient treatment with plot elevation and restoration setting were fixed effects. For the cage
experiment, I first examined if there was a significant difference in macroalgal cover between the control and control treatments. Since there were no cage effects (cage > 0.42), cage-control treatments were dropped from the analyses. Linear mixed effects models were also fit for the caging experiment with nekton exclusion and mesograzer exclusion as fixed effects and sampling date as a random effect to determine the effects of manipulated treatments through time.
growth by calculating the difference in oyster density or growth between ambient and algal-removal treatment plots at each elevation. This allowed me to standardize the effect of macroalgal cover relative to the characteristics of each individual oyster reef. The difference was calculated so a negative value represented that algal removal had a negative effect on the density or growth of oysters and a positive value meant that removing macroalgae increased oyster density or growth. Two-way ANOVAs were used to analyze the effect of landscape setting and elevation (fixed factors) on adult density, spat density and oyster growth.
Tukey's post-hoc comparisons of significant treatments and interactions were used to determine which levels of each treatment were significantly different from one another in each experiment. All analyses were run in R 3.2.3 and linear mixed model analyses were run using package lme4 (Bates et al. 2015, R Core Development Team 2016).
Results Monitoring
Two dominant genera, Ulva and Ectocarpus, composed 95% of the macroalgal community on the intertidal oyster reefs from January to May 2012. Ulva was comprised of Ulva lactuca and Ulva intestinalis, while Ectocarpus consisted of Ectocarpus fasciculatus
and Ectocarpus siliculosus. The remaining species comprised less than 5% of total cover and included Porphyra spp, Striaria attenuata, Gelidium americanum, Hypnea muciformis, Nemacystus howei, Scytosiphon lomentaria, Chondria spp., Lomentaria baileyana, Dyasia
baillouriana, Ceramium spp., and Aspercocous fistulosus.
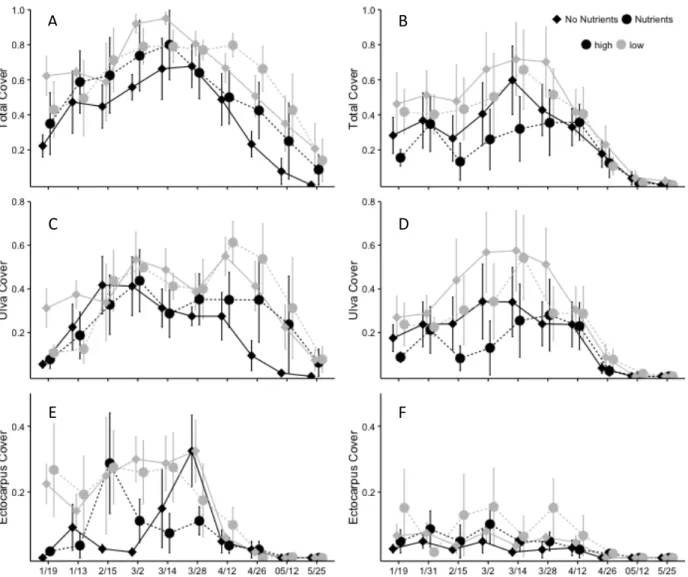
January 2012, with mat cover peaking from February 6 – March 14, 2012, before declining through May 2012 to 3.8 ± 2.0% across all treatments. Cover of macroalgae at low elevations on restored reefs developed the quickets and reached 67.0 ± 10.7% on February 6,2012 and was significantly greater than all other plots. Low-elevation plots on natural reefs and high-elevation restored plots did not have significantly different cover with 37.8 ± 13.2% and 38.1 ± 13.4% on February 6th, respectively (setting x elevation, P = 0.032) and high plots on natural reefs had the lowest cover on February 6th with 21.0 ± 27.6% cover. During peak growth, restored reefs had 1.9 times higher macroalgal cover than natural reefs (restoration setting, P < 0.001) and high plots had 1.8 times greater cover than low elevation plots (elevation, P < 0.001). Macroalgal cover in low plots on restored reefs persisted longer than all other treatments (setting x elevation, P = 0.032, elevation x time, P = 0.001).
Plot elevation had a significant effect on Ulva cover, with low plots peaking at 40% on February 20th and having higher coverage than high plots throughout the monitoring period (Fig. 1B, elevation, p < 0.001). The effect of elevation on Ulva cover during the end of the growing season was dependent on restoration setting (setting x elevation, p=0.038). On restored reefs, Ulva cover on low plots was nearly twice as high as the percent cover of Ulva in high plots, until the last sampling date (May 14, 2012) when algal cover on all reefs had declined to near 0%. However, on natural reefs, low elevation plots began to decline immediately after peaking on February 20th and were not significantly different than high plots.
Ectocarpus developed to 20% cover on reefs within the first two weeks and remained
(setting, P < 0.050), until Ectocarpus began declining. Coverage on all natural reefs and high-restored plots had declined to less than 1% by April 29th, but Ectocarpus persisted at low plots on restored reefs until May 1, 2012.
Water temperature increased with time throughout the macro-algal monitoring period and ranged from 3.09°C to 28.26°C (Fig. 2A). Average water temperature when the total macroalgae cover began to decline was 18.28 ± 2.16°C, ranging from 13.80°C to 24.96°C in the period between sampling intervals on March 20, 2012. Water salinity ranged from 23.6 to 36.2 ppt over the course of the monitoring period and was 33.0 ± 3.0 ppt on average (Fig. 2A). Overall, water level was lower during the winter and spring when macroalgae was present than the rest of the year (Fig. 2B). During the monitoring period, mean water level increased from -0.07 m in January to 0.10 m on average in May.
Natural reefs had 2.9 ± 1.0 grazers per sampling rope until April 12, 2012, as macroalgae began to decline, when mesograzers increased to 11.1 ± 4.0 mesograzers on average throughout the remainder of the monitoring period (Fig. 3A). Restored reefs had higher initial mesograzer density than natural reefs, with 10 grazers on average per sampling rope, peaking at 57 ± 21 grazers on April 12th and then declined back to 9.8 ± 4.7
mesograzers by the time the algae began to senesce.
2012, while restored reef CPUE remained low and only increased to 2 ± 1.5 individuals/set on average during the last six weeks of sampling.
Effects of nutrients on macroalgal cover
The response of macroalgal cover to nutrient enrichment was dependent on
restoration setting and plot elevation (Fig. 4A, nutrient x setting x elevation, P = 0.043). On restored reefs, nutrient enrichment increased Ulva cover at the end of the growing season, but the relative increase was greater for plots at low elevation than high (Fig. 4B). Additionally, the peak macroalgal cover persisted two weeks longer for nutrient enriched plots compared with non-nutrient enriched plots at low elevations on restored reefs. However, on natural reefs, macroalgal cover was lower within nutrient-enriched plots until April 26, 2011 when all treatments converged for the remainder of the monitoring period (Ulva cover, setting x elevation x time, P = 0.019). Nutrient enrichment had no effect on Ectocarpus cover (Fig. 4C, nutrients, P = 0.347) and did not cause any changes in community composition. Effects of top-down control on macroalgal cover
When nekton were excluded (removing top-down control on mesograzers) total cover of macroalgae declined significantly earlier than all other treatments from 77.5 ± 2.8% on April 8, 2012 to 8.3 ± 7.5% on May 9, 2012 (Fig 5A, cage x pesticide, P = 0.032; cage x date, P = 0.007). Macroalgal cover persisted at an average of 41.8 ± 4.7% in treatments where nekton were not excluded, until declining on May 16, 2012. Although removing top-down control on mesograzers caused a faster rate of decline in total macroalgal cover, all treatments were not significantly different from each other only one week later on May 23rd (time, P <0.001).