A CHEMICAL BIOLOGY APPROACH TO PHOSPHOINOSITIDE METABOLIC ANALYSIS
Jarod Waybright
A dissertation submitted to the faculty of the University of North Carolina at Chapel Hill in partial fulfillment of the requirements for the degree of Doctor of Philosophy in the Division of Chemical Biology and Medicinal Chemistry in the UNC Eshelman School of
Pharmacy.
Chapel Hill 2017
Approved By:
Michael Jarstfer
Nancy Allbritton
David Lawrence
John Sondek
ABSTRACT
Jarod Waybright: A Chemical Biology Approach to Phosphoinositide Metabolic Analysis (Under the direction of Qisheng Zhang)
Lipids serve a diverse array of functions including maintaining cellular structure and compartmentalization, regulating post-translational modifications of proteins, and as members of complex signaling networks. Despite their importance there is minimal understanding of how bioactive lipids and lipid pathways systematically regulate biological processes. Phosphoinositides (PIPs) are a diverse class of lipid signaling molecule implicated in nearly all facets of cell signaling including migration, proliferation, and apoptosis. Mutations in numerous PIP modifying enzymes occur frequently in human disease, especially cancers, though the effects of these mutations on the global metabolic system have been poorly defined. Likewise, heterogeneous protein expression and undefined feedback loops further complicate obtaining a global view of metabolism and understanding the PIP metabolic pathway’s role in disease. Current approaches have been unsuccessful in obtaining a systems-wide analysis due to various technical challenges including low sensitivity, use of indirect measurements of activity, and a lack of validated reporters and delivery methods.
findings to develop a suite of fluorescent reporters that could subsequently be used as standards and reporters in future experimentation.
To achieve our goal of systematically analyzing cellular metabolism, we examined a variety of delivery methods for fluorescent PIPs as previously reported techniques have failed to achieve a level of delivery sufficient for metabolic analysis. We further developed a fluorescent model phospholipid that allowed us to explore novel delivery techniques including intramolecular charge masking and photocaging methods while simultaneously exploring previously published methods including liposomes and charge altering releasable transporters (CARTs) for the delivery of PIPs.
ACKNOWLEDGEMENTS The best journeys answer questions
that in the beginning, you didn’t even think to ask -Jeff Johnson (180° South)
In the words of Hunter/Weir: what a long strange trip it’s been. I would first like to thank Dr. Qisheng Zhang for allowing me to join his lab and help me grow as a scientist and an individual. Members of the research team: Manish K. Singh, Huanyao Guao, and Weigang Wang were also a pleasure to work with and were also eager to help and offer their scientific expertise. It was a more than pleasurable experience scientifically and I enjoyed expanding my cultural horizons throughout our time together.
Thank you to my committee members Dr. Mike Jarstfer (Dr. J), Dr. David Lawrence, Dr. Nancy Allbritton and Dr. John Sondek for their scientific guidance. I would also like to extend a special than you to Dr. J who was a continued positive presence throughout my graduate work in both scientific and personal endeavors. I would also like to thank the entire faculty and staff of CBMC. The people in this program lead me to choosing UNC to pursue my graduate studies and is a large part keeping me here for my future scientific studies. I would also like to acknowledge Dr. Angie Proctor for her assistance throughout my project and always lending a helping hand and a good joke.
give a personal acknowledgment to Carla Coste Sánchez who was a motivating force throughout a crucial time in my graduate studies. Thank you for sticking by me things were hard and the enthusiasm you shared when they were great. I am excited to see where you will go on your journey and enjoyed immensely our time journeying together.
I would also like to extend an acknowledgement to Dr. Kimberly Barnash. I could write an immeasurable amount of great things about Kim the person and scientist, but she would want me to keep it short: you are delightful and a social butterfly. I cannot wait to see where your drive and witty nature take you.
PREFACE
Parts of Chapter 2 of this dissertation are adapted from Waybright, J., Huang, W., Proctor, A. et al. Required Hydrophobicity of Fluorescent Reporters for
Phosphatidylinositiol Family of Enzymes Anal Bioanal Chem (2017). https://doi.org/10.1007/s00216-017-0633-y
Parts of Chapter 3 of this dissertation are adapted from Singh, M.K., J. Waybright, and Q. Zhang. A facile method to enable a model phospholipid cell-permeable and
TABLE OF CONTENTS
ABSTRACT………..….iii
DEDICATION………...v
ACKNOWLEDGEMENTS………..vi
PREFACE………...…….ix
TABLE OF CONTENTS………..x
LIST OF TABLES………..xiv
LIST OF SCHEMES………..xv
LIST OF FIGURES………..……….xvi
LIST OF ABBREVATIONS………....xviii
CHAPTER 1. INTRODUCTION AND IMPORTANCE OF SYSTEMATIC ANALYSIS OF BIOACTIVE LIPIDS……..………...1
1.1 Importance of Bioactive Lipids………...1
1.2 Importance of Systematic Analysis of Lipid metabolites………..2
1.3 Importance of Phosphoinositides………....3
1.3.1 Background on Phosphoinositides……….3
1.3.2 Cellular Distribution of PIPs……….5
1.3.3 Cellular Functions of Phosphoinositides………6
1.4 The PI3K Metabolic Pathway………...7
1.4.1 Background……….7
1.4.2 The Importance of PI3K in Human Disease………..11
1.5 Measurement of Lipid Metabolites....………..13
1.5.1 Background……….13
1.5.2 Radiolabeled Substrate ………………13
1.5.3 Mass Spectrometry………14
1.5.4 Fluorescent Protein Domains .………..15
1.6 Synthetic Tools for Studying PIP Metabolism………15
1.6.1 Fluorescent Substrates……….15
1.6.2 Chemical Cytometry coupled with Fluorescent Substrates ……………16
CHAPTER 2. THE IMPORTANCE OF HYDROPHOBICITY IN LIPID SIGNALING REPORTERS: SYNTHESIS AND EVALUATION OF FLUORESCENT LIPID REPORTERS………..………..………...………. 18
2.1 Introduction to Interfacial Catalysis by PIP Modifying Enzymes……….18
2.2 Results and Discussion……….19
2.2.1 Design and synthesis of fluorescent PIP2 derivatives……….19
2.2.2 Biophysical and Biochemical Evaluation of Fluorescent PIP2 Reporters………….21
2.2.3 In vitro Membrane Association of Fluorescent PIP2 Reporters……….23
2.2.4 Vesicle Based PI3K Analysis………...25
2.2.5 Required Hydrophobicity for PI4K Substrate PtdIns………26
2.2.6 Synthesis of BODIPY-DAG-C15 and BODIPY-PA-C15 ……….27
2.3 Conclusions and Future Directions ………...29
2.4 Experimental………...………....31
2.4.1 Soluble PI3K Assay Conditions………...32
2.4.2 Soluble PI4K Assay Conditions………...32
2.4.3 Vesicle Based PI3K Assay Conditions………...32
2.4.4 TLC Analysis of Fluorescent Lipid Metabolites ..………....33
2.4.6 Fluorescent lipids/liposome interaction ………...34
2.4.7 Chemical Synthesis ………...35
CHAPTER 3. CELLULAR DELIVERY OF SYNTHETIC PIP REPORTERS…….………...55
3.1 Introduction………...………...………...……… 55
3.2 Results and Discussion………...………...……….. 59
3.2.1 Delivery of BODIPY-DAG-C15, BODIPY-PIP2-C15, and model phospholipid 36 to Cells………….…...……….…… 59
3.2.2 Photocaging for the Delivery of Model Phospholipid 36……… 61
3.2.3 Histone Delivery of PIPs………...………...……… 64
3.2.4 Cationic Liposomes for the Delivery of PIPs………...………. 65
3.2.5 Fusogenic Liposomes for the Delivery of PIPs………...………. 66
3.2.6 Intramolecular Charge Masking Strategy with Guanidine for the Delivery of Phospholipids………...………...……….…..70
3.2.7 Charge Altering Releasable Transporters (CARTs) for the Delivery of PIPs……….…….. 74
3.3 Conclusions and Future Directions………...………... 78
3.4 Experimental………...………...……….. 80
3.4.1 Confocal Microscopy ………...………. 82
3.4.2 Preparation of Cationic Liposomes……...……….. 82
3.4.3 Preparation of Fusogenic Liposomes……...……….. 82
3.4.4 Extraction of Lipid Metabolites……...……….. 82
3.4.5 TLC analysis of Lipid Metabolites……...………. 83
3.4.6 CE Analysis of Lipid Analytes……...……… 83
3.4.7 Chemical Synthesis……...………. 84
CHAPTER 4. INVESTIGATION OF CELLULAR PHOSPHOLIPID METABOLISM WITH FLUOURESCENT REPORTERS……….…..………... 94
4.2 Results and Discussion……...……….……. 96
4.2.1 Concentration Dependent Production of PA using BODIPY-DAG-C15…….….. 96
4.2.2 Delivery of BODIPY-PIP2-C15:CART Complex to Breast Cancer Cells……..… 97
4.2.3 Cellular Analysis of BODIPY-PIP2-C15 Metabolites in MDA-MB-436 Cells …... 98
4.2.4 Cellular Analysis of BODIPY-PIP2-C15 Metabolites in MDA-MB-453 Cells……102
4.3 Conclusions and Future Directions……...………103
4.4 Experimental……...………..108
4.4.1 Cell Culture….………..108
4.4.2 Delivery of BODIPY-PIP2-C15 to Breast Cancer Cells……….108
4.4.3 Extraction of Lipids from Cell Pellet……….….109
4.4.4 TLC Analysis of Lipid Metabolites………..…..109
Appendix………..111
LIST OF TABLES Table 1.1 Table 1.1 Summary of Interactions Within Lipid
Signaling Networks……..………..…3
Table 1.2 Cellular Distribution of PIPs……..………6 Table 1.3 Summary of Frequency of PIK3CA Alterations in Human Cancer………...10 Table 3.1 Cationic Liposome Formulations for BODIPY-PIP2-C15 Cellular
Delivery……….………...66
Table 3.2Fusogenic Liposome Formulations for BODIPY-PIP2-C15
LIST OF SCHEMES
Scheme 2.1 Synthesis of Fluorescent PIP2 Derivatives with
Varied Hydrophobicity………..……..………20
Scheme 2.2 Synthesis of Fluorescent PtdIns Reporter…………..…...…………..……....…….21 Scheme 2.3Synthesis of PIP Metabolites…………...……….………..29 Scheme 3.1 Synthesis of Fluorescent Model Phospholipid 36…....….…...……….…….……60 Scheme 3.2 Synthesis of Intramolecular Charge Masking
LIST OF FIGURES
Figure 1.1. Structure and Metabolic Pathway of Phosphoinositides………..……….5
Figure 1.2. PIP Binding Effector Protein Domains…………....………..………..7
Figure 1.3. The PI3K Metabolic Pathway………..………..………….………8
Figure 1.4. Systematic Analysis of Cellular PIP Generation…..……….………….17
Figure 2.1. Critical Micelle Concentration (CMC) and Kinetic Constants of PIP2 Derivatives……..………….……….22
Figure 2.2. Fluorescent PI(4,5)P2 Substrate Competition……….……..………...23
Figure 2.3. In-vitro Membrane Association of Fluorescent PIP2 Reporters……….………...25
Figure 2.4. Competition with Endogenous PI(4,5)P2 in Liposome Based Assay………...26
Figure 2.5. Biophysical and Kinetic Analysis of Fluorescent PtdIns Analogs……….…………..……27
Figure 3.1. Common Chemical Moieties in Photocaging of Phospholipids………...…..…..56
Figure 3.2. Common Lipids Used in Liposome Formulation for Cellular Transfection,……….…....58
Figure 3.3. Carrier Free Delivery of Fluorescent Lipid Reporters……..……….……..…….…61
Figure 3.4. Generation and Uncaging of Compound 54 with MKS-1…...……..…………...62
Figure 3.5. Delivery of uncaged 36 and caged 54 to Cells……….…….….……….…63
Figure 3.6. Histone Delivery of BODIPY-PtdIns-C15 to Cells………..……...………..64
Figure 3.7. Cationic Liposme Delivery of BODIPY-PtdIns-C15 to Cells………..….………….66
Figure 3.8. Fusogenic Liposome Delivery of BODIPY-PtdIns-C15 to Cells……..……...…....68
Figure 3.9. CE Analysis of Metabolites Generated using Fusogenic Liposome Delivery of BODIPY-PtdIns-C15………..69
Figure 3.10. Bidentite interaction between guanidine and phosphate…….…………..…..….70
Figure 3.12. Delivery of BODIPY-PIP2-C15 to cells via CART
systems A11 and G7………..………....….76
Figure 3.13. TLC analysis of Fluorescent Metabolites Generated from
BODIPY-PIP2-C15 in Cells using the CART System…………....77
Figure 4.1. Suite of Fluorescent Reporters to Probe
Various PIP Metabolic Pathways….………...…………..……...95 Figure 4.2. Breast Cancer Cell Lines for PI3K Pathway Metabolic Analysis……….….…….96 Figure 4.3. Concentration Dependent Increase of PA Production with
BODIPY-DAG-C15.………97
Figure 4.4. Delivery of BODIPY-PIP2-C15 into MDA-MB-453 cells with CARTs………..….…98
Figure 4.5. Analysis of Fluorescent Metabolite Distribution in
MDA-MB-436 Cells………….………..……….…….…100
Figure 4.6. Method to ‘Capture’ Fluorescent PIP3 Produced in
MDA-MB-436 Cells…………...……….….……101
Figure 4.7. Analysis of Fluorescent Metabolite Distribution in
MDA-MB-453 Cells…….….……….………...………..102
Figure 4.8. Structure of AK-PtdIns-C15 and Fluorophore
LIST OF ABBREVIATIONS PIPs Phosphoinositides
DAG Diacylglycerol
PtdIns Phosphatidylinositol
PI(4,5)P2; PIP2 Phosphoinositide 4,5-bisphosphate
PI(4)P Phosphoinositide 4-phosphate
PI(3,4,5)P3; PIP3 Phosphoinositide 3,4,5-trisphosphate
PI3K Phosphoinositide 3-kinase PI4K Phospoinositide 4-kinase
PH Pleckstrin Homology Domain
PTEN Phosphatase and tensin homolog
PLC Phospholipase C
DAGK Diacylglycerol kinase
INPP4 Inositol-3,4-bisphosphate 4-phosphatase
PM Plasma Membrane
GPCR G-Protein Coupled Receptor RTK Receptor Tyrosine Kinase EGF Epidermal Growth Factor
EGFR Epidermal Growth Factor Receptor PDGFR Platelet derived growth factor receptor HGF Hepatocyte Growth Factor
HGFR Hepatocyte Growth Factor Receptor
NfKb Nuclear Factor Kb
mTOR Mammalian target of rapamycin
PA Phosphatidic acid
fMLP N-Formylmethionyl-leucyl-phenylalanine
MS Mass spectrometry
GFP Green fluorescent protein TLC Thin layer chromatography
CE-LIF Capillary Electrophoresis with laser induced fluorescence DCC N,N'-Dicyclohexylcarbodiimide
DMAP Dimethylaminopyridine
DCM Dichloromethane
DTT Dithiothreitol
MOPS 3-(N-morpholino)propanesulfonic acid ATP Adenosine triphosphate
BODIPY 4,4-Difluoro-5,7-Dimethyl-4-Bora-3a,4a-Diaza-s-Indacene
Cbz Carboxybenzyl
Bn Benzyl
Pd/C Palladium on carbon
MOM methoxymethyl
NHS N-Hydroxysuccinimide FMOC Fluorenylmethyloxycarbonyl BOC tert-butyloxycarbonyl
PE Phosphatidylethanolamine
PS Phosphatidylserine
Chol Cholesterol
DOPE 1,2-dioleoylphosphatidylethanolamine DOTAP 1,2-dioleoyl-3-trimethylammonium-propane EDMPC 1,2-dimyristoyl-sn-glycero-3-phosphocholine EDPPC 1,2-dipalmitoyl-sn-glycero-3-ethylphosphocholine EDOPC 1,2-dioleoyl-sn-glycero-3-ethylphosphocholine di-C14 DAB N,N-Dimethyltetradecylamine
CHAPTER 1. INTRODUCTION AND IMPORTANCE OF SYSTEMATIC ANALYSIS OF BIOACTIVE LIPIDS
1.1 Importance of Bioactive Lipids
Lipids are responsible for diverse and vital cellular processes with variations in lipid head groups and aliphatic chains allowing for the existence of >1,000 different lipid species [1, 2]. While largely recognized as being important structural components of the cell allowing for compartmentalization of cellular tasks, lipids also serve as critical regulators of a wide array of biological outcomes. Lipids can serve as an energy sources in times of glucose depletion. Fatty acids can be hydrolyzed from phospholipids that enter a stepwise pathway leading to the generation of acetyl CoA, that provides needed carbon atoms to the Kreb’s cycle where they can be oxidized for energy production [3]. Lipids can also serve as post-translational modifications of proteins such as the addition of myristoyl group to the N-terminal of the protein leading to membrane association, subcellular localization, and protein-protein interactions [4].
derived growth factor receptor (PDGFR) that lead to downstream signaling cascades generally promoting cell survival and growth [6-8]. Likewise, a separate subset of PIP modifying enzymes can also be stimulated by Wnt leading to activation of a separate signaling cascade Wnt [9, 10]. Interestingly, PIP pathways also respond to intracellular production of lipid metabolites possibly as a feedback mechanism to control the ratios of the various metabolites which will be highlighted in the future sections and summarized in Table 1.1 [11].
1.2 Importance of Systematic Analysis of Lipid metabolites
Because of the broad role of lipid signaling molecules, various enzymes within different pathways control the levels of various lipid metabolites very tightly to maintain cellular homeostasis. Imbalances of these metabolites contribute to a wide variety of human diseases including neuro-degeneration and cancers [5]. For example, mutations in the lipid modifying enzyme phosphoinositides 3-kinase (PI3K) leads to an increase production of signaling metabolite phosphoinositide 3,4,5-trisphosphate (PIP3). This
increased production of PIP3 is important in cancer onset and progression [12].
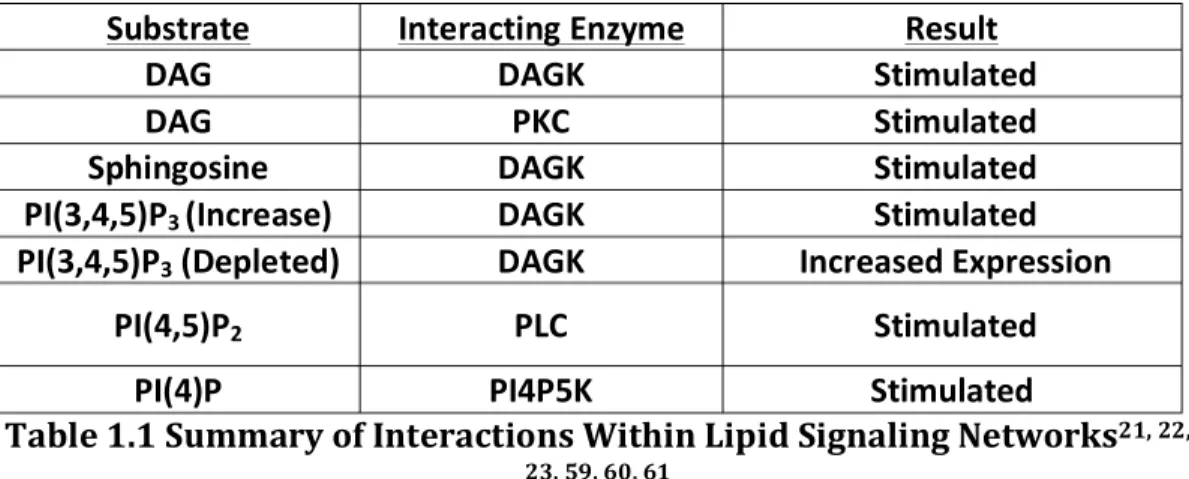
analysis has raised many questions about the contributions of the total metabolic pathway versus that of just a single metabolite because of the interconnected lipid pathways [20]. Indeed, there are crosstalk and feedback mechanisms among various lipid metabolites within a single pathway as well as interactions between various classes of bioactive lipids [21, 22]. For instance, the sphingolipid and phosphoinositides metabolic pathways have shown to interact through stimulation of diacylglycerol kinase (DAGK) activity. Cells treated with increasing concentrations of sphingosine lead to an increase in phosphatidic acid (PA) production suggesting the pathways are intertwined [21]. Therefore understanding the systems contributions of the various classes of bioactive lipids would be invaluable to understanding their importance in biological processes and diseases [20]. Despite the importance of the lipid signaling metabolic networks, little is known about the interplay between metabolites in cellular processes due to the difficulty in studying multiple metabolic events systematically within the cell [20].
Substrate Interacting Enzyme Result
DAG DAGK Stimulated
DAG PKC Stimulated
Sphingosine DAGK Stimulated
PI(3,4,5)P3 (Increase) DAGK Stimulated
PI(3,4,5)P3 (Depleted) DAGK Increased Expression
PI(4,5)P2 PLC Stimulated
PI(4)P PI4P5K Stimulated
Table 1.1 Summary of Interactions Within Lipid Signaling Networks21, 22,
1.3 Importance of Phosphoinositides 1.3.1 Background on Phosphoinositides
1.3.2 Cellular Distribution of PIPs
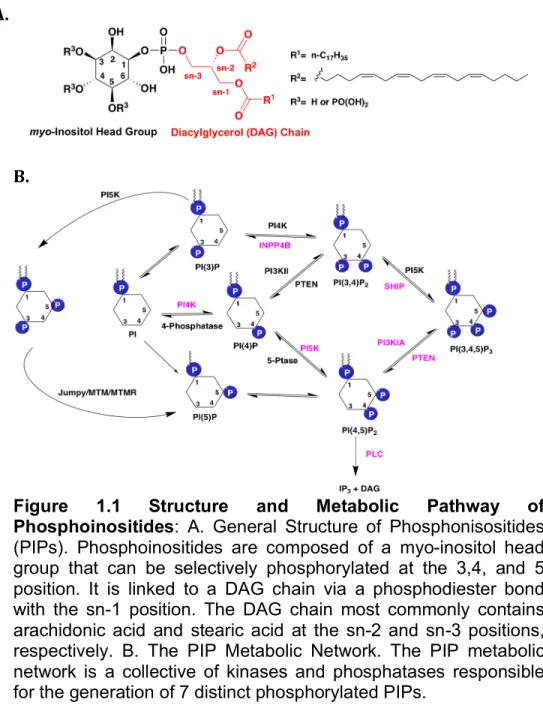
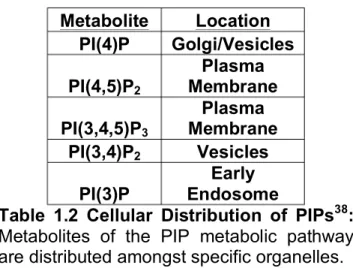
PIPs are found distributed on specific membranes and the abundance of each lipid is tightly controlled giving great spatial and temporal control of the pathway [2]. As shown in Figure 1.1B, PtdIns is modified to generate a pool of 7 PIPs through reversible phosphorylation of the C3, C4, and C5 hydroxyl groups that are distributed
A.
B.
throughout various cell membranes [34, 35]. These lipid metabolites are distributed throughout various membranes as summarized in Table 1.2. The most abundant of the PIPs in cells are phosphoinositides 4,5-bisphosphate (PI(4,5)P2; PIP2) and
phosphoinositide 4-phosphate (PI(4)P) which are important precursors to generate second messenger PI(3,4,5)P3. Because of the potent signaling functions of PIP3 it is
generally found at only ~2—5% of the levels of PIP2 at basal conditions [20, 34, 39].
PIP2 Other low abundance PIPs, such as PI(3)P and PI(3,5)P2 are found primarily in
various endosomes and lysosomes while PI(5)P has been shown to be both a nuclear and cytosolic signaling molecule underscoring the vast diversity amongst distribution and function of PIPs [33, 39].
1.3.3 Cellular Functions of Phosphoinositides
The various PIPs are generated from a collective of kinases and phosphatases that make up the PIP metabolic network. PIP modifying enzymes can be stimulated through a variety of receptors including G-Protein coupled receptors (GPCRs) and receptor tyrosine kinases (RTKs) by corresponding ligands allowing for temporal control
Metabolite Location PI(4)P Golgi/Vesicles PI(4,5)P2
Plasma Membrane PI(3,4,5)P3
Plasma Membrane PI(3,4)P2 Vesicles
PI(3)P
Early Endosome
over the generation of metabolites [33, 35]. PIPs have a wide range of downstream targets and cellular functions through interacting with targets at or recruited to the membrane [34, 35]. Effector proteins are recruited to cellular membranes via stereospecific binding to the phosphorylated inositol head groups enabling spatial organization and control [39]. One such example is the pleckstrin homology (PH) domain, the most abundant lipid-binding domain, which binds to numerous phosphorylated metabolites as seen in Figure 1.2 [13, 40]. Effector proteins, such as Akt (PKB), contain PH domains that localize the protein to the membrane allowing for activation and downstream signaling effects. This further highlights the importance of stringent control over production of secondary signaling metabolites [33, 34].
1.4 The PI3K Metabolic Pathway 1.4.1 Background
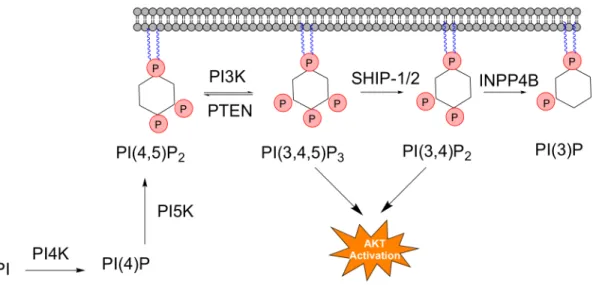
The PI3K pathway is a localized metabolic pathway of 4 enzymes and 4 metabolites within the larger PIP metabolic network and is illustrated in Figure 1.3 [41, 42]. The central enzyme phosphoinositide 3-kinase (PI3K) is responsible for generation
of potent second messenger PI(3,4,5)P3 (PIP3)from the most abundant PIP metabolite
PI(4,5)P2. In addition to PI3K, the pathway contains 3 phosphatases responsible for
diminishing the pool of PIP3: phosphatase and tensin homolog (PTEN),
Phosphoinostol-3,4,5-trisphosphate 5-phosphatase 1 (SHIP1), as well as the inositol polyphosphate
4-phosphatase type II (INPP4B) [14, 25, 38]. While the resulting reaction does not generate a PIP, phospholipase C (PLC) is also an important enzyme that is relevant to the PI3K pathway as PLC and PI3K share PI(4,5)P2 as a substrate and respond to
many of the same stimuli [33]. Other signaling metabolites DAG and inositol 1,4,5-triphosphate (IP3) that are generated by PLC also serve as important regulators of the
PIP metabolic pathway and cellular functions as second messengers [5].
1.4.2 The Importance of PI3K in Human Disease
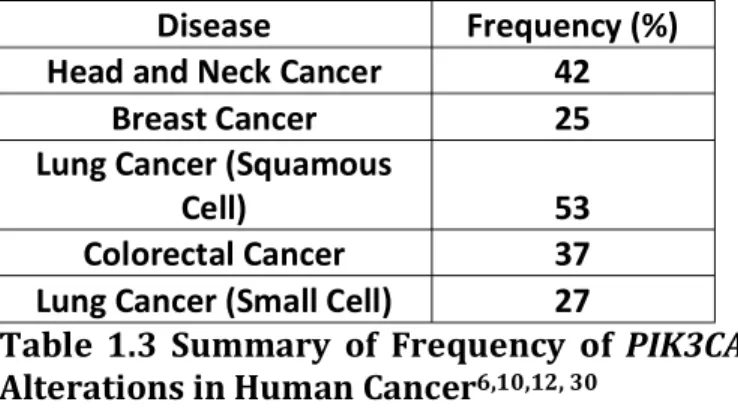
Genes encoding for the PIP modifying enzyme PI3K are found frequently mutated in a variety of cancers summarized in Table 1.3[12, 13, 23, 43-45]. Class 1A
Figure 1.3The PI3K Metabolic Pathway: The enzymes and metabolites that make up the PI3K metabolic pathway with PI(4,5)P2 supplied from
PI3Ks are heterodimers composed of a p110 catalytic subunit responsible for generation of PIP3, and a p85 regulatory subunit responsible for auto-inhibition of the
enzyme [46, 47]. Mutations in the helical and kinase domains of the protein result in increased enzymatic activity through both increased lipid binding and relief of p85 auto-inhibition resulting in a increase in PIP3 production [23, 46, 47].Increases in PIP3 levels
drive tumorigenesis due to an increased activation of the PH domain containing effector protein Akt (PKB), which is activated following binding to PIP3 [25, 38, 48]. The increase
in Akt activation results in misregulated downstream signaling of effector proteins including inhibition of transcription factor forkhead box 01 (FOX01) and increased activity of anti-apoptotic proteins such as nuclear factor kB (NFkB) and mammalian target of rapamaycin (mTOR), all important in tumorigenesis [14, 49, 50]. Interestingly the
conversion of PI(3,4,5)P3 to PI(3,4)P2 by the SHIP family of phosphatases does not
reduce Akt activation and it has been shown that both metabolites are capable of PH domain binding and Akt activation[40]. Therefore, both PTEN and INPP4B are
responsible for direct termination of PI3K/Akt signaling through depletion of both PI(3,4,5)P3 and PI(3,4)P2 respectively, suggesting tumor suppressor potential for both of
human cancer behind p53[52]. Collectively, these findings have made the PI3K pathway
an attractive target for pharmaceutical development [14, 16, 38, 49, 50, 53].
Highlighting this need of expanded analytical techniques, a study6 of MCF10A cell populations using flow cytometry revealed heterogeneity in PI3K activity that was previously unknown due to measurement of population averages. In this study, a bimodal distribution of Akt activity was observed following EGF stimulation that correlates with PI3K protein production. Interestingly, the same distribution of PI3K was observed on a single cell level for both wild type and mutant PI3KH1047R suggesting that only a subset of cells classified as having a high levels of PI3K can activate Akt [7]. Because cell-to-cell variability has been demonstrated in multiple systems can lead to unique cellular fates and understanding how this is maintained and regulated could be a powerful tool in basic biology and pharmaceutical targeting of PI3K [54, 55]. For instance, targeting a population of cells are expressing low quantities of mutant PI3K with low Akt activation may be unsuitable for achieving a positive therapeutic effect [16]. Therefore, a simple and effective diagnostic tool to better understand this heterogeneity and PI3K activity in a patient could be effective in better determining a method and time of treatment.
Disease Frequency (%)
Head and Neck Cancer 42
Breast Cancer 25
Lung Cancer (Squamous
Cell) 53
Colorectal Cancer 37
Lung Cancer (Small Cell) 27
Table 1.3 Summary of Frequency of PIK3CA
1.4.3 Pharmaceutical Targeting of PI3K Pathway
Attempts at therapeutic intervention against the PI3K pathway have been made by targeting PI3K directly as well as downstream effectors of the pathway. Indeed, the PI3K-d selective inhibitor, idelalisib, has been approved by the FDA to treat chronic lympocytic leukemia in combination with rituximab though only as a third line treatment following multiple treatment failures [56]. Likewise, the drug was pulled from multiple clinical trials in 2016 due to lack of efficacy. Pan PI3K inhibitors represent the largest class of agents used to regulate aberrant PI3K activity [14, 16, 49, 57, 58]. Unfortunately, such a strategy has proven to be difficult in achieving clinical success and raises questions regarding the possible off-target effects of inhibiting all isoforms of PI3K versus the oncogenic PI3Kα mutant [49]. Akt inhibition is the second most common target of pharmacological agent for PI3K aberrant cancers, but this too has seen little positive clinical outcomes [14, 16, 34, 49]. Such failures in the clinic have raised numerous interesting and important biological questions that are essential in understanding the complex nature of the PI3K signaling network, as well as the PI metabolic pathway as a whole. One such goal is understanding the roles of various metabolites within the pathway and possible feedback loops across various cancer types [14, 16, 49, 57]. Likewise, it places an emphasis on achieving a systems understanding of PIP biology within a tumor microenvironment, especially with the previously described cell-to-cell variability of PI3K and Akt activation [3, 7]. It is hypothesized that inhibition of PI3K or Akt is overcome by compensatory lipid signaling pathways over time allowing for the cell to evade deleterious effects of inhibition.
DAGK, which converts DAG to PA [59]. In this study, increased DAGK activity was observed following an increase in PI(3,4,5)P3 and PI(3,4)P2 both in vitro and in vivo.
This was an interesting result as it was the first instance of DAGK activation in the absence of receptor-regulated calcium release. Further, it showed that DAGK can be activated and recruited to the plasma membrane as a direct consequence of PI3K activation highlighting the interconnectivity of lipid metabolic pathways [59].
Interestingly, another study showed extended inhibition of PI3K resulted in increased expression level of DAGK, contradictory to the previously described study. DAGK has been shown to activate tyrosine kinase SRC, which canonically is activated through PIP3/Akt [22, 60]. Dual inhibition of both DAGK and PI3K leads to a decrease in
1.5 Measurement of Lipid Metabolites 1.5.1 Background
To better understand the systems biology of PIP metabolism, sensitive detection methods are needed to analyze the changes of both major and minor metabolites. Such sensitivity is necessary to discern the roles of low-level metabolites in the system and to extend the analysis to a single cell level to in order to paint a clear picture of the tumor microenvironment[34]. PIPs represent less than 1% of total phospholipid content in the cell and at a concentration of 10 mM PIP2 is 25-fold more abundant than other
phosphorylated PI metabolites [21, 23]. Sensitive and robust detection methods are needed for analysis, especially when only a maximum of 10% of this pool of PIP2 is
converted to PIP3 following stimulation and the metabolite has a short life span [25,
62-64].
1.5.2 Radiolabeled Substrate
Current methods aimed at quantifying PI metabolism is done using radioactivity-based methods through the metabolic labeling of living cells with radiolabeled inorganic phosphate (32Pi or 33Pi) or [2-3H]myo-inositol. A major downfall of this method is that
labeling time and conditions greatly affects signal output and can therefore result in improper analysis of metabolic activity. This method also suffers from the inability to distinguish phosphorylation isomers such as PI(4,5)P2 vs. PI(3,4)P2 and requires a large
sensitivity to effectively measure systematic metabolism. Likewise, while it is acceptable for studying steady-state metabolism of PIs it is not effective in accurately capturing short lived metabolic products such as PIP3 [34]. Because of the drawbacks of this
method, it would not be effective in achieving a detailed view of PI metabolism necessary for use in diagnostic applications.
1.5.3 Mass Spectrometry
Mass spectrometry (MS) can also be used to analyze complex mixtures of PtdIns metabolites. Unfortunately MS relies on a large number of cells and can be problematic in identifying low level and highly phosphorylated phospholipid species such as PI(4,5)P2 and PI(3,4,5)P3 [64-68]. A promising MS method requires chemical
1.5.4 Fluorescent Protein Domains
Another method of studying PI metabolism is the use of engineered fluorescent proteins such as tagged PH domains to analyze enzymatic activities via microscopy and the translocation of the fluorescent domains following cell stimulation. PH domains, such as that from Akt, are engineered to contain a green fluorescent protein (GFP) that can be monitored via fluorescence microscopy. Following a cell stimulation event, the fluorescent domains can be analyzed translocating form the cytosol to the membrane where the lipid messenger is present [70]. Such methods, however, are indirect measurements of enzymatic activity and suffer from the inability to analyze multiple metabolites simultaneously [34, 62, 71, 72]. Likewise, it has been demonstrated that PH domains can bind to multiple lipid metabolites again complicating biological conclusions that could be discerned from using this method. Further, this method cannot be used as diagnostic tool because of the necessity to engineer and express fluorescent-tagged protein domains is not compatible with clinical samples [20, 62, 63].
1.6 Synthetic Tools for Studying PIP Metabolism 1.6.1 Fluorescent Substrates
thin layer choromatography (TLC) separation and fluorescent scanning [71]. Such a technology is more advantageous than radiolabeling due to increased sensitivity of fluorescence based analytical platforms. Likewise, a known concentration of a specific metabolite reporter could be loaded into cells versus relying on the steady-state metabolic incorporation of the labeled unit into the pool of phospholipids allowing for the direct dissection of specific nodes of the metabolic pathway and possibly systematic metabolic analysis. Fluorescent PIP reporters have been shown to serve as substrates for various PI modifying enzymes in-vitro, but due to the difficulty in their chemical synthesis, there has been little analysis on the effects of reporter structure on enzymatic turnover or cellular localization[62, 63, 71, 73].
1.6.2 Chemical Cytometry coupled with Fluorescent Substrates
a powerful technique for developing a lipid profile and could also be applied to patient samples for possible diagnostic applications [62, 63, 77]. Such technology could be applied to PI metabolic analysis and provide a detailed profile of PIP metabolites in various disease states and provide a powerful system to better understand the systems contributions to biology. Ideally, a fluorescent reporter could be delivered to cells where it could undergo in-cell mixture synthesis through the metabolic network followed by analysis of the collective of lipid metabolites by CE-LIF as shown in Figure 1.5. In this dissertation, I will describe our efforts in validating a platform utilizing fluorescent lipid reporters for PIP metabolic analysis.
Figure 1.4 Systematic Analysis of Cellular PIP Generation: A system using a validated fluourescent PIP2 reporter coupled with non-invasive
CHAPTER 2. THE IMPORTANCE OF HYDROPHOBICITY IN LIPID SIGNALING REPORTERS: SYNTHESIS AND EVALUATION OF FLUORESCENT LIPID
REPORTERS
2.1 Introduction to Interfacial Catalysis by PIP Modifying Enzymes
PI3K and other PIP modifying enzymes catalyze reactions at the lipid/water interface in a process known as interfacial catalysis wherein hydrophobic contact between the enzyme and substrate as well as enzyme and membrane are of critical importance to catalytic turnover [46, 79, 80]. Likewise, various cancer causing mutations in the PIP family of enzymes have been shown to cause increased activity through required hydrophobic interaction with the membrane [46, 80] Consequently, the hydrophobic side chains in fluorescent PIP derivatives will likely play important roles in their capacity as enzyme substrates. Consequently, reporters that cannot undergo efficient metabolism like that of their endogenous counterparts will not be useful tools in monitoring cellular PIP metabolism [20].
With the goal of using fluorescent PIP reporters to profile cellular metabolism we synthesized fluorescent PIP2 and PtdIns derivatives that contain varied degrees of
hydrophobicity and investigated their ability to serve as reporters of PI3KIα and PI4KIIα activity, respectively. This chapter describes the synthesis and biochemical evaluation of various PIPs with different degrees of hydrophobicity in their side chains for selection of a suitable reporter for cellular studies. We describe a set of assays that prove useful in reporter selection for lipid signaling enzymes and could be applied to various classes of signaling phospholipids. We further describe the synthesis of various other PIP metabolites based on our finings in these studies to be used as both standards and reporters in future cellular experiments.
2.2 Results and Discussion
2.2.1 Design and synthesis of fluorescent PIP2 derivatives
To investigate the effects of hydrophobicity on the capacity of fluorescent PIP2
derivatives as enzyme substrates, we synthesized four PIP2 analogs PIP2-C6, PIP2-C9,
PIP2-C12 and PIP2-C15 with different alkyl groups C6H13, C9H19, C12H25, and C15H31,
respectively, at the sn-2position according to Scheme 2.1. Fluorescein was chosen as the fluorophore for evaluation of multiple PIP2 derivatives because of our prior success
in separating fluorescein-tagged PIPs by both thin layer chromatography (TLC) and capillary electrophoresis (CE) [62, 71, 76]. A BODIPY tagged C15 PIP2 was
(BODIPY-C15-PIP2) also synthesized as the fluorophore possesses some chemical
protected inositol 4 previously synthesized according to literature protocols [81]. After oxidation with t-butyl hydroperoxide, compound 5 was formed and the carboxybenzyl (Cbz) and benzyl (Bn) groups were removed by hydrogenolysis. Deprotection of the methoxymethyl (MOM) groups then provided the primary amine 6, which reacted with the NHS ester of fluorescein 7 or BODIPY 9 to yield fluorescent PIP2 derivatives [81, 82,
85, 86].
BODIPY-PtdIns-C15 was synthesized in a similar manner according to according to Scheme 2.2 [81]. Briefly, DAG phosphoramidite 12 containing palmitic acid at the sn-2 position was synthesized as described in Scheme 2.1 and was coupled with protected inositol derivative 11 followed by oxidation with t-BuOOH to generate
Scheme 2.1: Synthesis of Fluorescent PIP2 Derivatives with Varied
compound 13. Removal of all the protective groups resulted in 14, which reacted with BODIPY-NHS to provide fluorescent 15 (BODIPY-PtdIns-C15).
2.2.2 Biophysical and Biochemical Evaluation of Fluorescent PIP2 Reporters
The critical micelle concentration (CMC) of the fluorescent PIP2 derivatives was
calculated by measuring light scattering of various concentrations of the reporters in H2O at 25 °C [71]. As expected, the PIP2 derivative with a longer acyl chain, and
thereby higher hydrophobicity, has lower CMC value than that with a shorter acyl chain In comparison, the endogenous PI(4,5)P2 has a reported CMC of 10 µM [71].
A mixed micelle assay was utilized to compare the kinetic parameters of the substrates [71]. The assay was initiated by the addition of purified PI3K enzyme to assay buffer containing individual fluorescent PIP2 derivative and ATP and stopped by
by TLC or CE for production of fluorescent PI(3,4,5)P3 as previously described [71]. The
concentration of substrate was varied to give a set of initial velocity values and this data was fit to the Michaelis-Menten equation to calculate the relative Km and Vmax values of
the reporters summarized in Figure 2.1. Under these conditions, no detectable amount of the corresponding PIP3 was formed for the PIP2-C6 reporter, suggesting that short
chain PIP2-C6 was not an effective substrate for PI3KIα under the assay conditions
examined. Unsurprisingly, the most hydrophobic PIP2-C15 was the most efficiently
metabolized substrate.
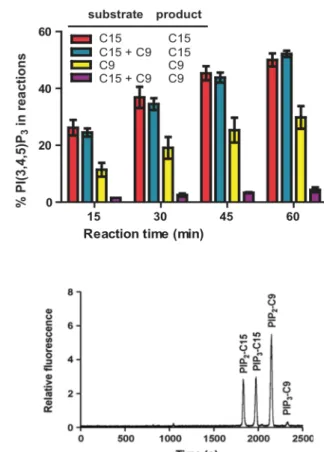
To further assess the ability of fluorescent PIP2 probes as PI3KIα substrates, a
1:1 (mol:mol) mixture of PIP2-C9 and PIP2-C15 was used in a mixture in a soluble PI3K
assay, with reactions of equimolar PIP2-C9 or PIP2-C15 alone under the same assay
conditions as controls. PIP2-C9, PIP2-C15 and their corresponding PI(3,4,5)P3 products
were efficiently separated by CE (Fig. 2.2 B). As shown in Figure 2.2, the conversion of PIP2-C9 in the presence of PIP2-C15 was decreased by approximately 5-fold compared
Figure 2.1: Critical Micelle Concentration (CMC) and Kinetic Constants of PIP2 Derivatives. The CMC was measured in water using
to when it was the only PI3K substrate. In contrast, the conversion of PIP2-C15
remained consistent with or without the presence of PIP2-C9. These results again
highlight the importance of hydrophobicity in fluorescent PIP2 probes, especially when
competing substrates were present- a scenario when the probe was used as a reporter in live cells.
A.
B
Figure 2.2 Fluorescent PI(4,5)P2 Substrate Competition. (A) Mixed
micelle PI3K assay conditions were used to analyze the effects of multiple reporters in solution. Production of PIP3 was monitored from
reactions that contained a single fluorescent PIP2 derivative (20 µM),
short chain C9 or long chain C15, as well as production of each product in reactions that contained both reporter in equimolar (20 µM) concentrations. (B) Representative chromatogram of separation of PIP2
-C9, PIP2-C15, PIP3-C9 and PIP3-C15 by CE. The CE analysis was
2.2.3 In vitro Membrane Association of Fluorescent PIP2 Reporters
The acyl side chain in a fluorescent PIP2 probe is vital to cellular localization.
However, the non-invasive method of using histone as a carrier protein to deliver fluorescent PIP2 derivatives into cells resulted in very low efficiency in our hands [87].
Consequently, we utilized a membrane association assay that was developed for protein-lipid interactions to investigate likely membrane localization of fluorescent PIP2
probes [88]. In this assay, liposomes and the associated cargo are recovered by centrifugation atop a dense sucrose gradient. Liposomes were formulated to mimic mammalian membranes with a final composition of phosphatidylcholine (PC; 45%), phosphatidylethanolamine (PE; 25%), phosphatidylserine (PS; 5%), phosphatidylinositol (PtdIns; 10%), and cholesterol (Chol; 15%). Figure 2.3 shows representative images of the assay mixtures after centrifugation. The top lipid layer and bottom sucrose layers were then collected and each layer quantified by CE for the presence of fluorescent PIP2. Approximately 91% of the PIP2-C15 probe was incorporated into the liposome
layer (Fig. 2A). The percentage of incorporation decreased dramatically to 35% for PIP2-C12. Only 12% and 9% of the probe was incorporated into liposome for PIP2-C9
and PIP2-C6, respectively. These results demonstrated that only the PIP2-C15 probe
2.2.4 Vesicle Based PI3K Analysis
To further assess whether PIP2-C15 functions as an effective reporter in the
presence of endogenous substrate, the PI3K-catalyzed reaction was run on lipid vesicles, an environment that closely mimic cellular presentation of lipid substrates, in the presence or absence of endogenous PIP2. Liposomes composed of a carrier lipid,
phosphatidylserine (PS) which is the most commone anionic lipid in the plasma membrane, PIP2-C15 and endogenous PIP2 at different ratios, were formulated for
enzymatic reactions [39, 89]. The total concentration of PIP2-C15 and endogenous PIP2
was 10 µM, which is close to that of the cellular environment and the conversion of PIP2-C15 to its corresponding PIP3 product was then measured and shown in Figure
2.4. The rate of conversion decreased by approximately 27% when the ratio of PIP2
-C15 to endogenous PIP2 was 1:1, and approximately 50% when the ratio was 1:9,
Figure 2.3: In-vitro Membrane Association of Fluorescent PIP2
Reporters: Probes were incubated with liposomes and under a gradient of sucrose. Following centrifugation the samples were visualized using a UV light source. The top liposome containing layer and bottom layer weas isolated and total PIP2 content was
compared to 100% PIP2-C15. These results suggested that PIP2-C15 was a similar to
endogenous substrate and can function as a reporter of PI3K activity.
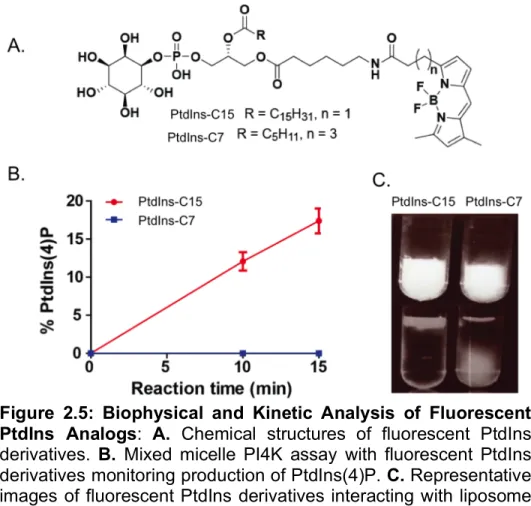
2.2.5 Required Hydrophobicity for PI4K Substrate PtdIns
Like PI3K, PI4K catalyzes reactions at the lipid/water interface. Consequently, what was observed for PI3K likely applies to PI4K as well as other enzymes in the pathway. There is only one commercial fluorescent PI derivative, BODIPY-PtdIns-C7 (Fig. 2.5A) with a short acyl side chain. We thus designed BODIPY-PtdIns-C15 with a longer acyl side chain to assess its capacity as PI4K substrate. Next, both BODIPY-PtdIns-C15 were BODIPY-PtdIns-C7 tested as substrates of PI4KIIα under soluble assay conditions. Consistent with what we observed with fluorescent PIP2 derivatives,
the PI(4)P product of the fluorescent PI with a longer acyl side chain BODIPY-PtdIns-C15 was efficiently generated shown in . In contrast, no detectable amount of product was formed for BODIPY-PtdIns-C7 containing a shorter acyl side chain shown in
Figure 2.4: Competition with Endogenous PI(4,5)P2 in Liposome Based
Assay: Liposomes were formulated to contain 10 µM total PI (4,5)P2 using
fluorescent C15 PI(4,5)P2 derivative or endogenous PI(4,5,)P2 and 10 µM of
PS as a carrier lipid. Production of Pi(3,4,5)P3 was monitored to analyze the
Figure 2.5B. Likewise, over 99% of BODIPY-PtdIns-C15 (not detectable in the aqueous layer) but only approximately 15% of BODIPY-PtdIns-C7 participated into the lipid layer in the in vitro membrane association assay as seen in Figure 2.5C.
2.2.6 Synthesis of BODIPY-DAG-C15 and BODIPY-PA-C15
With the goal of using these reporters for future cellular studies, multiple lipid metabolites of the PIP pathway for were also synthesized as standards for metabolite identification. BODIPY-DAG-C15 and BODIPY-PA-C15 were synthesized to contain the C15 acyl chain to be used as standards for CE and TLC analysis of cellular experiments as well as chemical reporters. In addition to the C15 alkyl chain, the
metabolites were synthesized also contain the same N-caproic acid tagged with a BODIPY fluorophore was kept constant to ensure the standards will chemically match the metabolites produced from our reporter in cellular experiments. When synthesizing fluorescent DAG, great care must be taken to avoid acyl migration from the secondary sn-2 position to the primary sn-3 position of DAG. If the primary hyrdroxyl is free under hydrogenolysis and basic conditions the side chain will migrate. To alleviate this, the hydroxyl was left protected with a PMB group until the final deprotection with DDQ. Under these conditions acyl migration does not occur as judged by NMR analysis of products from each synthetic step. Briefly, the Cbz group is selectively deprotected via hydrogenolysis in the presence of pyridine leaving the PMB group intact [90, 91]. Addition of BODIPY via the corresponding NHS ester followed by DDQ oxidation of the PMB protecting group resulted in final fluorescent DAG (Scheme 2.3A). Fluorescent PA was synthesized in a scheme similar to PIP2 and PtdIns synthesis because the hydroxyl
2.3 Conclusions and Future Directions
In summary, we have synthesized a series of fluorescent PIP2 derivatives with
varied levels of hydrophobicity and investigated their capacity as PI3K substrates. The probe with a longer acyl side chain functions as a better substrate for PI3K and has a higher affinity with liposome compared to that with a shorter acyl side chain. Strikingly, when the side chain is sufficiently short and thereby has low hydrophobicity, the
fluorescent PIP2 is no longer an effective PI3K substrate to generate detectable amount
A.
B.
of enzymatic product, highlighting the required hydrophobicity of fluorescent PIP2
derivatives. Likewise, the fluorescent PtdIns derivative with a long acyl side chain
functions as an effective PI4K substrate, while that with a short acyl side chain does not generate detectable amount of enzymatic product. These results suggest that the required hydrophobicity of a fluorescent probe, which can be assessed through its interaction with liposomes, is likely essential for phosphatidylinositide metabolic enzymes.
PIP2-C15 has shown similar properties as the endogenous PIP2 in regard to
CMC, kinetic parameters and tendency for membrane association. Unlike the endogenous PIP2, PIP2-C15 is easy to handle both in chemical synthesis and CE
separation. Similarly, BODIPY-PtdIns-C15 has also been efficiently synthesized and separated from its enzymatic products. These results demonstrate that fluorescent PIP2-C15 and PtdIns-C15 may strike the right balance between required hydrophobicity
and practical handling during chemical synthesis and separation. Consequently, they are likely effective fluorescent probes that can be used to profile metabolism of PIPs when coupled with CE separation. Likewise, fluorescent PI, DAG and PA will serve as valuable standards for analyzing PI metabolism as well as serve as functional tools for dissecting distinct nodes of the PI metabolic pathway. When coupled with an effective cellular delivery method, and CE separation, we predict these reporters will be capable of monitoring changes in dynamic PI metabolism.
what has been previously described using radiolabeled substrates, though with increased sensitivity for minor metabolites. Despite our best efforts at analyzing
membrane association via a liposomal flotation experiment, it is still possible we will see non-specific and cytosolic localization of our lipid reporters. Therefore, it may be
beneficial to further increase the hydrophobicity at the sn-2 position of the PI reporters. One such modification would be the addition of stearic, nonadecyclic, or arachidic acids at this position to further increase hydrophobicity and better mimic the endogenous substrate. Likewise, removal of the fluorophore for an alkyne tag on all substrates would make the reporters more suitable for cellular delivery and could lend well to future
analytical platforms of single cell analysis. Further, the fluorophores of various PI metabolites could be altered to allow multiple pools of metabolites to be tracked distinctly by using dual fluorophores with unique and non-overlapping excitation wavelengths.
2.4 Experimental
PIP2-C12 and related intermediates were synthesized and characterized by Dr.
Weigang Huang. Purified PI3KIα enzyme was purchased from Invitrogen-Life
Technologies. Purified PI4KIIα was purchased from Creative Biomart. Dynamic light scattering data were recorded on a Wyatt DynaPro dynamic light scattering plate
reader. Endogenous PI(4,5)P2 (brain, porcine) was purchased from Avanti Polar Lipids.
2.4.1 Soluble PI3K Assay Conditions
Fluorescent PIP2 derivatives were added to assay buffer composed of MOPS (50 mM,
pH 6.7), NaCl (100 mM), MgCl2 (10 mM), sodium cholate (0.5 mM), DTT (1 mM),
followed by the addition of ATP (2 mM). The reaction was initiated by the addition of purified PI3Kiα enzyme to a final concentration of 1.2 ng/µL or 2.4 ng/µL and incubated at 37 °C. At the indicated time point, an aliquot of the reaction was removed and diluted to 0.2 µM in CHCl3/MeOH (1:1) for analysis. All assays were performed in duplicate 3
times.
2.4.2 Soluble PI4K Assay Conditions
Fluorescent PtdIns derivatives were added to assay buffer composed of MOPS (50 mM, pH 6.7), NaCl (100 mM), MgCl2 (10 mM), sodium cholate (0.5 mM), DTT (1 mM),
followed by the addition of ATP (2 mM). The reaction was initiated by the addition of purified PI4KIIa enzyme to a final concentration of 1.0 ng/µL and incubated at 37 °C. At the indicated time point, an aliquot of the reaction was removed and diluted to 0.2 µM in CHCl3/MeOH (1:1) for analysis. All assays were performed in duplicate for 3 times.
2.4.3 Vesicle Based PI3K Assay Conditions
Liposomes were prepared to contain 10 µM total PIP2 composed of PIP2-C15 and
endogenous substratewith 10 µM phosphatidylserine (PS) as a carrier lipid in final assay conditions. Lipid stocks in CHCl3 or water were added to a 1:1 MeOH/H2O
mixture followed by solvent removal by speed-vac and drying under vacuum for at least 1 h. The lipids were then re-suspended in 5X MOPS (250 mM, pH 6.7) and 5X NaCl (500 mM) followed by sonication in a bath for 5 min to form lipid vesicles. The vesicles were then used to prepare a mixture containing a final PtdIns(4,5)P2 concentration of 10
(2 mM). The reaction was initiated by adding purified PI3K enzyme (0.6 ng/µL) and then incubated at 37 °C. At the indicated time point, an aliquot of the reaction mixture was removed and diluted to 0.2 µM in 1:1 CHCl3/MeOH for TLC analysis. In the case of the
10% PIP2-C15 liposome, the reaction was first stopped by the addition to methanol,
followed by concentration and addition of CHCl3/MeOH to achieve the desired
concentration of 0.2 µM FL-PtdIns(4,5)P2 substrate as direct dilution results in phase
separation. All experiments were performed using a single batch of liposome in duplicate for three times.
2.4.4 TLC Analysis of Fluorescent Lipid Metabolites
TLC plates (Merck, Silica Gel-60) were pre-treated with a solution of 1.2% potassium oxalate and 1.2 mM EGTA in MeOH/water (v:v = 2:3) and heated at 110 °C for 20 min before use. Reaction mixture was diluted in CHCl3/ MeOH (v:v = 1:1) and spotted on a TLC plate directly. The TLC plate was then developed in
CHCl3:Acetone:MeOH:AcOH:water (v:v:v:v:v = 80:30:26:24:14) and scanned on a Typhoon 9400 Variable Mode Imager (lex/lem = 488 nm/520 nm). The fluorescence intensity of various spots on the TLC plate was quantified with ImageQuant software (V.5.0).
2.4.5 CE Analysis of Fluorescent Lipid Metabolites
Capillary electrophoresis coupled with laser induced fluorescence detection (CE-LIF, 488 nm excitation) was performed on a custom-built system mounted to the stage of an inverted microscope, described previously in detail[75]. Fused silica capillaries were 38 cm long with a 20.5 cm effective length [30 µm inner diameter and 360 µm outer
in DI H2O. Prior to each run, capillaries were rinsed with 1 M NaOH and DI H2O for 5
min each and with electrophoretic buffer for 10 min by application of pressure to the capillary outlet. Buffer at the capillary inlet and outlet was completely refreshed prior to each electrophoretic run. The composition of the electrophoretic buffer was 80 mM NaH2PO4, pH 6.8 containing 15% 2-propanol and a field strength of 210 V cm-1 was
used for all separations. Internal standards and samples were hydrodynamically loaded by raising the inlet 3 cm relative to the outlet and holding the capillary inlet in the sample for 10 sec. The inlet was then lowered to the height of the outlet and electrophoresis was initiated by application of a negative voltage to the outlet while grounding the inlet. Electropherograms were plotted and analyzed utilizing OriginLab 9.0 (OriginLab
Corporation; Northampton, MA).
2.4.6 Fluorescent lipids/liposome interaction
The liposome mixture was prepared from stock solutions of lipids in CHCl3 for a final
composition of 45% PC, 25% PE, 15% cholesterol, 10% PI, and 5% PS. The solvent was blown off under a stream of N2 followed by drying under vacuum for at least 1 h.
The lipid film was then suspended in buffer composed of MOPS (50 mM, pH 6.7), NaCl (100 mM), DTT (1 mM), and MgCl2 (10 mM) to a concentration of 2 mM. Liposomes
were extruded through a 0.03 µM pore size polycarbonate filter membrane for at least 11 times back and forth. Fluorescent PIP2 or PI (10 µM) and liposomes (1 mM) were
55) for 1 h at 4 °C. The bottom 350 µL and top 150 µL were manually collected using a syringe and analyzed for fluorescent PI or PIP2 content by both TLC and CE. A
fluorescence image of the tubes was also taken prior and following centrifugation using a UV light source below the samples and a CCD camera.
2.4.7 Chemical Synthesis
Synthesis of (S)-1-((6-(((benzyloxy)carbonyl)amino)hexanoyl)oxy)-3-hydroxypropan-2-yl palmitate 3d) A mixture of compound 2 (350 mg, 0.76 mmol), 1d (234.5 mg ,0.91 mmol), DCC (189 mg, 0.91 mmol), and DMAP (51 mg, 0.42 mmol) in anhydrous CH2Cl2 (6 mL) was stirred at room temperature overnight. The reaction
mixture was concentrated and purified by flash chromatography (hexane-ethyl acetate = 2:1) over silica (407 mg, 89%). The so-formed intermediate (407 mg, 0.58 mmol) was dissolved in wet CH2Cl2 (20 mL) followed by addition of DDQ (278 mg, 1.2 mmol) and
the mixture was stirred at room temperature for 4 h. The reaction mixture was then by washed with 10% NaHCO3 and saturated NaCl, dried over MgSO4, and concentrated
under vacuum. The residue was then purified by flash chromatography (hexane-ethyl acetate =2:1) over silica to generate 3d (281 mg, 83%) as a colorless oil. 1H NMR (400 MHz, CDCL3) δ 7.26-7.38 (m, 5H), 5.06-5.11 (m, 3H), 4.83 (brs, 1H), 4.33 (dd, J = 11.9, 4.5 Hz, 1H), 4.21 (dd, J = 11.9, 5.7 Hz, 1H), 3.72 (d, J = 4.9 Hz, 1H), 3.19 (q, J = 13.1, 6.7 Hz, 1H), 2.24-2.30 (m, 4H), 1.58-1.68 (m, 4H), 1.48-1.55(m, 2H), 1.25-1.38 (m, 26H), 0.88 (t, J = 6.9 Hz, 3H). 13C NMR (101 MHz, CDCl
3) δ173.55, 156.58, 136.71,
Synthesis of (S)-1-((6-(((benzyloxy)carbonyl)amino)hexanoyl)oxy)-3-hydroxypropan-2-yl tridecanoate (3c) Compound 3c (80 mg, 75%). was prepared in a similar manner to compound 3d. 1H NMR (CDCl3, 400 MHz) δ 7.26-7.36 (m, 5H),
5.02-5.15 (m, 3H), 4.96 (brs, 1H), 4.32 (dd, J = 11.9, 4.3 Hz, 1H), 4.18 (dd, J = 11.9, 5.9 Hz, 1H), 3.69 (d, J = 5.2 Hz, 2H), 3.16 (q, J = 6.5 Hz, 2H), 2.26-2.36 (m, 4H), 1.43-1.66 (m, 6H), 1.18-1.40 (m, 20H), 0.86 (t, J = 7.1 Hz, 3H); 13C NMR (CDCl
3, 101 MHz) δ
173.41, 173.37, 156.47, 136.57, 128.45, 128.03, 72.00, 66.56, 62.25, 61.27, 40.77, 34.24, 33.82, 31.87, 29.61, 29.59, 29.57, 29.54, 29.30, 29.23, 29.05, 26.07, 24.89, 24.39, 22.64, 14.08. ESMS 535.7 [M]+
Synthesis of (S)-1-((6-(((benzyloxy)carbonyl)amino)hexanoyl)oxy)-3-hydroxypropan-2-yl decanoate (3b) Compound 3b (170 mg, 89%) was prepared in a similar manner to compound 3d as a colorless oil. 1H NMR (400 MHz, CDCl3) δ 7.26-7.38 (m, 5H), 5.05-5.12 (m, 3H), 4.99 (brs, 1H) 4.33 (dd, J = 11.9, 4.2 Hz, 1H), 4.19 (dd, J = 11.9, 5.9 Hz, 1H), 3.70 (d, J = 5.1 Hz, 1H), 3.18 (q, J = 13.0, 6.5 Hz, 1H), 2.25-2.30 (m, 4H), 1.46-1.56 (m, 6H), 1.20-1.39 (m, 14H), 0.88 (t, J = 6.8 Hz, 3H). 13C NMR (101
MHz, cdcl3) δ 173.11, 173.06, 159.29, 156.39, 136.65, 129.73, 129.28, 128.46, 128.04,
128.02, 114.50, 113.79, 77.40, 77.08, 76.77, 72.92, 70.00, 67.86, 66.52, 62.81, 62.58, 55.22, 55.11, 49.02, 40.81, 34.30, 34.08, 33.90, 33.84, 31.84, 29.67, 29.57, 29.41, 29.25, 29.05, 26.13, 25.62, 24.93, 24.39, 22.64, 14.09. ESMS 493.2 [M]+
to compound 3d (336 mg, 0.73 mmol, 96%) as a colorless oil. 1H NMR (400 MHz,
CDCl3) δ 7.26-7.38 (m, 5H), 5.02-5.20 (m, 3H), 4.95 (brs, 1H), δ 4.33 (dd, J = 11.9, 4.3
Hz, 1H), 4.20 (dd, J = 11.9, 5.8 Hz, 1H), 3.71 (d, J = 5.1 Hz, 2H), 3.18 (q, J = 6.5 Hz, 2H), 2.25-2.38 (m, 4H), 1.40-1.75 (m, 6H), 1.19-1.40 (m, 8H), 0.88 (t, J = 6.8 Hz, 3H).
13C NMR (101 MHz, CDCl
3) δ 173.12, 173.06, 159.29, 156.38, 154.12, 136.62, 129.73,
129.28, 128.47, 128.06, 128.04, 113.80, 77.35, 77.03, 76.72, 72.93, 70.14, 69.99, 67.86, 66.55, 62.82, 62.59, 55.24, 49.65, 49.18, 40.81, 35.93, 34.30, 33.84, 32.74, 31.57, 31.42, 30.90, 29.67, 29.58, 28.93, 28.77, 28.70, 26.38, 26.13, 25.58, 25.50, 25.42, 25.32, 24.88, 24.80, 24.70, 24.39, 22.47, 22.45, 14.01. ESMS 451.3 [M]+
Synthesis of tetrabenzyl ((1R,2R,3S,4R,5S,6S)-4-hydroxy-3,5,6-tris(methoxymethoxy)cyclohexane-1,2-diyl) bis(phosphate) (4). 4 was synthesized as previously described from myo-inositol [81]. 1H NMR (400 MHz, CDCl3) δ 7.40 – 7.19
(m, 19H), 5.15 – 4.87 (m, 11H), 4.84 (dd, J = 6.7, 0.9 Hz, 1H), 4.74 (dd, J = 6.6, 0.9 Hz, 1H), 4.57 (dd, J = 7.1, 0.9 Hz, 1H), 4.53 – 4.34 (m, 4H), 4.16 – 4.12 (m, 1H), 3.74 (t, J = 9.3 Hz, 1H), 3.64 – 3.54 (m, 1H), 3.50 – 3.44 (m, 1H), 3.42 – 3.39 (m, 3H), 3.30 – 3.28 (m, 3H), 3.28 – 3.26 (m, 3H). 13C NMR (101 MHz, CDCl
3) δ 136.07, 136.04, 136.00,
135.96, 135.93, 135.86, 128.51, 128.51, 128.49, 128.45, 128.41, 128.38, 128.32, 128.27, 128.23, 128.15, 128.05, 128.00, 127.97, 127.89, 127.85, 127.77, 127.72, 99.00, 97.65, 96.82, 83.27, 79.37, 79.32, 79.30, 79.26, 77.99, 77.94, 77.88, 77.48, 77.36, 77.16, 76.84, 75.60, 75.09, 75.07, 75.05, 70.41, 69.58, 69.52, 69.49, 69.43, 69.24, 69.19, 69.10, 69.01, 55.98, 55.78, 55.65, 55.55, 29.88, 29.85, 29.83, 29.81, 29.79. 31P
Synthesis of (2R)-1-(((benzyloxy)(((1R,2S,3R,4R,5S,6R)-3,4-
bis((bis(benzyloxy)phosphoryl)oxy)-2,5,6-
tris(methoxymethoxy)cyclohexyl)oxy)phosphoryl)oxy)-3-((6-(((benzyloxy)carbonyl)amino)hexanoyl)oxy)propan-2-yl palmitate (5d).
A solution of 3d (100 mg, 0.17 mmol) in anhydrous CH2Cl2 (1 mL) was added drop-wise
under argon to a flask that contained 1-(benzyloxy)-N,N,N’,N’- tetraisopropylphosphodiamine (360 mg, 0.43 mmol) and 1H-tetrazole (170 mg, 0.19 mmol) in anhydrous CH2Cl2 (2 mL). The mixture was stirred at room temperature for 2
h and concentrated under vacuum. The resulting residue was purified by column chromatography (hexane:ethyl acetate:triethylamine = 100:20:3) to give a phosphoramidite intermediate as a colorless oil. The so-formed phosphoramidite (125 mg, 0.15 mmol) in anhydrous CH2Cl2 (1.5 mL) was added to a solution of 4 (102mg,
0.12 mmol) and 1H-tetrazole (82 mg, 0.30 mmol) in anhydrous CH2Cl2 (1.5 mL) under
argon. The reaction mixture was stirred at room temperature overnight, followed by the addition of t-BuOOH (5.5 M, 138 µL) at -40°C. The reaction was allowed to come to room temperature and stirred for 1 h followed by removal of solvents under vacuum and purified by flash chromatography (2:1 Hex:Acetone) to yield 85 mg of pure product and impure fractions. The impure fractions were then purified by HPLC (BETASIL C18 150 X 21.2 mm water-acetonitrile 30 to 100% over 20 minutes 10 mL/min) to yield pure compound 5d (150 mg total, 70% combined from compound 3d) as a clear viscous oil.
1H NMR (400 MHz, CDCl
3) δ 7.38-7.26 (m, 30H), 4.80-5.21 (m, 14H), 4.80-4.60 (m,
(conformation 2) (s, 3H), 3.24 (conformation 1) and 3.23 (conformation 2) (s, 3H), 3.17 (q, J =6.4 Hz, 2H), 2.24-2.30 (m, 4H), 1.48-1.68 (m, 6H), 1.25-1.38 (m, 26H), 0.88 (t, J = 6.7 Hz, 3H). 13C NMR (101 MHz, CDCl3) δ 173, 172.94, and 172.89 (1C), 156.55,
136.80, 136.22, 136.17, 136.16, 136.09, 136.04, 135.64, 135.57, 128.83, 128.58, 128.53, 128.15, 128.03, 98.96, 98.90, 97.66, 97.04, 78.91, 76.52, 75.90, 74.69, 69.68, 69.62, 69.57, 69.52, 69.37, 69.32, 66.65, 66.55, 65.72, 65.54, 61.67, 56.80 and 56.74 and 56.68 (1C), 56.02 and 55.93 (1C), 40.94, 34.18 and 33.84 (1C), 32.04, 29.81, 29.61, 29.47, 29.41, 29.21, 26.27, 24.91, 24.49, 22.80, 14.24. 31P NMR (CDCl3, 162
MHz) δ -1.31 (2P), -1.65 and -1.70 (1P) ESMS 1561.7 [M]+
Synthesis of (2R)-1-(((benzyloxy)(((1R,2S,3R,4R,5S,6R)-3,4-
bis((bis(benzyloxy)phosphoryl)oxy)-2,5,6-
tris(methoxymethoxy)cyclohexyl)oxy)phosphoryl)oxy)-3-((6-(((benzyloxy)carbonyl)amino)hexanoyl)oxy)propan-2-yl tridecanoate (5c) Compound 5c (138 mg, 61%) was prepared in a similar manner to compound 5d from 3c (80 mg, 0.15 mmol) as a colorless oil. 1H NMR (CDCl3, 400 MHz) δ 7.18-7.40 (m, 30
H), 4.80-5.22 (m, 14 H), 4.56-4.80 (m, 4H), 4.53 (d, J = 7.0 Hz, 1H), 4.02-4.46 (m, 9H), 3.53 (dd, J = 10.0, 10.2 Hz, 1H), 3.37 (conformation 1) and 3.34 (conformation 2) (s,
3H), 3.31 (conformation 1) and 3.27 (conformation 2) (s, 3H), 3.22 (s, 3H), 3.15 (q, J =
6.3 Hz, 2H), 2.20-2.32 (m, 4H), 1.10-1.66 (m, 26H), 0.86 (t, J = 7.0 Hz, 3H); 13C NMR
(CDCl3, 101 MHz) δ 172.83, 172.77 and 172.72 (1C), 156.41, 136.66, 136.07, 135.95,
135.82, 135.57, 135.50, 135.43, 128.67, 128.43, 128.37, 128.28, 128.24, 128.18,
128.00, 127.88, 98.81, 98.74, 97.61, 97.51, 97.42, 96.88, 78.76, 77.37, 77.24, 77.06,
69.36, 69.26, 69.21, 69.16, 66.48, 65.43, 61.52, 56.65 and 56 59 and 56.53 (1C), 55.85
and 55.80 (1C), 55.76 and 55.69 (1C), 40.79, 34.03 and 33.69 (1C), 33.42, 31.89,
29.66, 29.61, 29.60, 29.56, 29.45, 29.36, 29.32, 29.25, 29.05, 26.12, 24.76, 24.34,
23.16, 22.65, 14.09; 31P NMR (CDCl3, 162 MHz) δ -1.37 (2P), -1.73 (1P). ESMS 1519.6
[M]+
Synthesis of (2R)-1-(((benzyloxy)(((1R,2S,3R,4R,5S,6R)-3,4-
bis((bis(benzyloxy)phosphoryl)oxy)-2,5,6-
tris(methoxymethoxy)cyclohexyl)oxy)phosphoryl)oxy)-3-((6-(((benzyloxy)carbonyl)amino)hexanoyl)oxy)propan-2-yl decanoate (5b) Compound 5b (55 mg, 30% combined from 3b) was prepared in a similar manner to compound 5d from 3b (77 mg, 0.16 mmol) as a colorless oil. 1H NMR (400 MHz, CDCl
3) δ 7.38-7.26
(m, 30H), 4.81-5.21 (m, 14H), 4.60-4.79 (m, 4H), 4.55 (d, J = 6.1 Hz, 1H), 4.00-4.50 (m, 9H), 3.50-3.58 (m 1H), 3.39 (conformation 1) and 3.36 (conformation 2) (s, 3H), 3.32 (conformation 1) and 3.28 (conformation 2) (s, 3H), 3.24 (conformation 1) and 3.23 (conformation 2) (s, 3H), 3.18 (q, J = 6.5 Hz, 2H), 2.18-2.34 (m, 4H), 1.40-1.70 (m, 6H), 1.17-1.39 (m, 14H), 0.87 (t, J = 6.8 Hz, 3H). 31P NMR (CDCl
3, 162 MHz) δ 1.31 (2P),
-1.66 and -1.71 (1P). 13C NMR (101 MHz, CDCl3) δ 172.82, 172.77, 172.72, 156.39,