Short-Term Energy Supply/Demand Outlook
◆– Forecast through FY2011 and Analysis on Effects of Crude Oil Price,
Economic Growth and Ambient Temperature Changes –
Shigeru Suehiro* Toshiaki Hachiuma** Masayuki Kako** Manabu Sofukuwaki** Kenji Sugii**
Introduction
This report presents forecasts on energy supply and demand in Japan for FY2010 and FY2011. Because energy demand can be positioned as “derivative demand” arising out of economic activities (more fundamental demand), it is important to start by evaluating economic trends. The world economy is on a recovery track after the worst period following the financial crisis. In the Japanese economy, production and consumption have recovered rapidly on an export rebound and economic stimulus measures. But effects of economic stimulus measures have run their course in the United States and Europe. Particularly in Europe, the recovery pace is slowing on lingering budget risks. In Japan, manufacturing industries have recovered rapidly on the strength of growing exports to other Asian countries. Consumption has been supported by consumption-stimulating measures like the eco-point system and tax cuts/subsidies for eco-friendly vehicles, as well as summer heat waves. Energy demand has turned upward on the production rebound and high temperatures. At present, however, the economic recovery might have come to a lull on the expiration of consumption-boosting measures and the yen’s appreciation.
When producing the forecasts contained in this report, we first estimated a base case under various assumptions. Then we addressed uncertainties by repeating our estimation of different cases under different assumptions on variable factors, such as the crude oil price and ambient temperature. By comparing the latter estimates with the former (base case estimates), we quantitatively evaluated how each of these factors may affect energy supply and demand.
This report is organized as follows: Chapter 1 presents an outlook on economic and production trends through the end of FY2011, based on which we have estimated energy supply and demand. Assuming the economic and production trends outlined in Chapter 1, Chapter 2 presents estimates of energy supply and demand. These estimates constitute the base case in this report. Chapter 2 also describes a breakdown of energy supply and demand by energy source (based on industrial statistics) and the domestic primary energy supply and final energy consumption (based on energy balance sheets) for the base case. Finally, Chapter 3 presents the results of sensitivity analyses for three factors: crude oil price, economic growth and ambient
◆
This report is based on a presentation at the IEEJ’s 406th Forum on Research Work on December 22, 2010.
* Senior Researcher, Energy Demand, Supply and Forecast Analysis Group, Energy Data and Modelling Center, Institute of Energy Economics, Japan
** Researcher, Energy Demand, Supply and Forecast Analysis Group, Energy Data and Modelling Center, Institute of Energy Economics, Japan
temperature.
1.
Outlook on Key Economic Indicators for FY2010 and FY2011
1-1
Short-Term Outlook Framework
1When estimating energy supply and demand for the given period, we studied the evolutions of various factors that would impact on the energy supply and demand from a qualitative viewpoint, while using two econometric models -- a macroeconomic model and an energy supply and demand model.
Concerning the major economic indicators on which our estimates are based, we made the following assumptions: The world economy
has escaped the worst period but is expected to slow down its recovery as effects of country-by-country economic stimulus measures have run their course. As global oil demand is expected to continue an upward trend with the supply/demand balance tightening moderately, the CIF-based price of crude oil imports into Japan is assumed to average $85/barrel in FY2011, slightly higher than the present level. (For details, see “Prospects for the International Oil Market and Crude Oil Prices in 2011” by Ken Koyama, December 22, 2010). As implementation schedules and financial sizes for most government-proposed policies have yet to be fixed, economic, energy and environmental policies now under consideration are not reflected in our outlook in principle. As for the exchange rate, we assume the dollar to hover around 85 yen in FY2011. Regarding the ambient temperature that affects energy demand particularly in the consumer sector, we assume the summer and winter averages over the past 10 years for FY2011, based on the Japan Meteorological Agency’s three-month forecast announced on November 25 that the second half of FY2010 would be a little colder than a year earlier.
1-2
Macroeconomic Outlook
The world economy is expected to achieve a great recovery in FY2010 thanks to a reactionary gain after a recession caused by the financial crisis and effects of country-by-country economic stimulus measures. A recovery trend has grown more remarkable in the industrial world including Europe and the United States, as well as in China and other emerging countries where the economic slump following the financial crisis was relatively limited.
1
The estimates in this report are based on information made available by December 17, 2010. Macroeconomic model
Energy supply/demand model
Secondary energy prices
Industrial and services activities
Final energy consumption
Crude oil prices
Energy conversion demand Primary energy supply
World economy, exchange rates (Major assumptions)
Temperature
Nuclear/hydro power generation
GDP components Prices, labor, finance, etc.
CO2 emissions
The United States has continued an economic recovery on the strength of such factors as a rebound in private consumption since the second half of 2009. But it is likely to post a more moderate recovery from now on due to the unemployment rate remaining at high levels and the household sector’s balance sheet adjustments. Europe has continued an export-driven economic recovery, led by Germany. But such countries as Greece and Ireland have been plagued with budget problems. Economic recovery paces of European countries are mixed. Therefore, the whole of Europe is likely to post a slower recovery than other industrial regions. Meanwhile, the Asian economy has continued high growth. In China, a sense of overheating has weakened on economic tightening measures such as interest rate hikes and restrictions on real estate investment. Given firm private consumption under various economic stimulus measures, however, China is expected to continue high economic growth.
The Japanese economy might have moved onto a recovery path in FY2010. Its real GDP in the year is likely to post a growth rate of 3.2% (including a carryover of 1.9 percentage points) from the previous year. Thanks to a fast recovery in production amid an export rebound linked to the world economy recovery, the Japanese economy is likely to record positive year-on-year growth every quarter in FY2010. The government’s economic stimulus measures have worked to accelerate economic growth including a domestic demand expansion. Domestic private sector demand is likely to work to boost real GDP by 2.3% in FY2010. Effects of government policies, including eco-point and eco-friendly car subsidy systems in the first half of the year, will make great contributions to private consumption. In the July-September 2010, particularly, accelerated car purchases just before the termination of the eco-friendly car subsidy system and expanded cigarette purchases before a major tobacco tax hike boosted private consumption. Meanwhile, the employment situation, including the high unemployment rate, has shown no major change. A reactionary fall is expected to come in policy-stimulated consumption. Given these factors, the economic recovery is expected to slow down in and after the second half of FY2010. Private consumption for the whole of FY2010 is likely to increase 1.6% from the previous year.
Private residential investment seemed to be ending a downward trend in the July-September 2010 quarter as a lull in inventory adjustments following the financial crisis was coupled with effects of such policies as the housing eco-point system. Given an increase in the number of households, private residential investment is likely to start a moderate recovery in the immediate future. But the recovery may fall short of offsetting a decline in the first half of FY2010. Private residential investment in the whole of FY2010 is expected to post a 0.7% decrease from the previous year. Private nonresidential investment has continued an upward trend as corporate earnings have recovered on the expansion of production accompanying a rapid export recovery. A sense of overcapacity, though still lingering as indicated by the Bank of Japan’s Tankan quarterly business confidence survey, has weakened particularly among manufacturers. Private nonresidential investment in FY2010 is forecast to score a 4.1% increase from the previous year.
Public demand as a whole may work to boost GDP by 0.1%. A supplementary FY2010 budget is likely to exert some impact on public demand. As government spending including public works outlays has continued to decline since the September 2009 government change, public investment
in FY2010 is likely to fall 6.3% from the previous year. Meanwhile, government consumption is expected to rise 1.6% due to an increase in nursing care and other public outlays amid the growing aged population and policy measures including the effective elimination of public senior high school tuitions. External demand as a whole may work to boost GDP by 0.9% in FY2010. Exports have been supported by a reactionary gain amid the world economy recovery after the financial
FY2008 FY2009 (Actual) FY2010 (Forecast) FY2011
(Actual) 1H 2H Total 1H 2H Total (Forecast)
Real GDP 539,484 256,318 270,418 526,735 267,554 276,259 543,812 551,369
(Chained to Year 2000, in billion Yen) (-4.1) (-6.6) (2.1) (-2.4) (4.4) (2.2) (3.2) (1.4)
Private demand 402,723 188,945 193,970 382,915 194,561 199,625 394,186 400,850
(-3.6) (-7.2) (-2.6) (-4.9) (3.0) (2.9) (2.9) (1.7) Private consumption 303,950 149,956 154,016 303,971 153,171 155,795 308,965 309,978
(-2.2) (-1.7) (1.8) (0.0) (2.1) (1.2) (1.6) (0.3) Private residential 15,342 6,434 6,117 12,551 6,053 6,416 12,468 12,973
investment (-3.6) (-15.2) (-21.1) (-18.2) (-5.9) (4.9) (-0.7) (4.0)
Private nonresidential 81,757 33,673 36,942 70,615 35,313 38,178 73,491 75,555
investment (-6.9) (-19.0) (-8.0) (-13.6) (4.9) (3.3) (4.1) (2.8)
Public demand 116,011 58,453 63,440 121,893 59,208 62,983 122,191 121,898
(-1.0) (5.1) (5.1) (5.1) (1.3) (-0.7) (0.2) (-0.2)
Government 97,304 49,604 51,056 100,660 50,744 51,541 102,285 103,103
consumption (0.2) (3.5) (3.4) (3.4) (2.3) (0.9) (1.6) (0.8)
Public investment 18,410 8,779 12,248 21,027 8,385 11,316 19,701 18,544
(-6.8) (15.6) (13.3) (14.2) (-4.5) (-7.6) (-6.3) (-5.9) Net exports of goods 21,336 8,205 11,885 20,091 13,501 13,209 26,710 28,313
& services (-24.0) (-46.8) (101.1) (-5.8) (64.5) (11.1) (32.9) (6.0)
Exports of goods & 80,406 33,615 39,078 72,693 42,233 43,093 85,326 89,682
services (-10.4) (-26.0) (11.7) (-9.6) (25.6) (10.3) (17.4) (5.1)
Imports of goods & 59,070 25,410 27,192 52,602 28,732 29,884 58,616 61,369
services (-4.3) (-15.3) (-6.4) (-10.9) (13.1) (9.9) (11.4) (4.7)
Nominal GDP 492,067 232,084 241,956 474,040 236,559 244,848 481,407 485,169
(billion Yen) (-4.6) (-6.5) (-0.8) (-3.7) (1.9) (1.2) (1.6) (0.8)
Industrial production index 94.4 80.6 91.4 86.0 94.3 92.3 93.3 95.5
(100 for 2005) (-12.7) (-23.4) (9.3) (-9.0) (17.1) (1.0) (8.5) (2.4)
Tertiary industry activity 100.1 96.0 97.4 96.7 97.5 100.1 98.8 100.3
index (100 for 2005) (-2.8) (-5.4) (-1.4) (-3.4) (1.6) (2.8) (2.2) (1.6)
Domestic corporate goods 108.3 102.9 102.3 102.6 102.9 102.8 102.9 103.1
price index (100 for 2005) (3.2) (-6.9) (-3.5) (-5.2) (0.0) (0.5) (0.3) (0.2)
Consumer price index 101.7 100.5 99.6 100.0 99.6 98.9 99.2 98.6
(100 for 2005) (1.1) (-1.6) (-1.6) (-1.6) (-0.9) (-0.7) (-0.8) (-0.7)
Exchange rate 100.5 95.4 90.2 92.8 88.9 83.0 86.0 85.0
(Yen/US$) (-12.0) (-10.0) (-5.0) (-7.6) (-6.8) (-7.9) (-7.4) (-1.1)
Crude oil CIF price 89.9 61.8 76.3 69.1 78.6 83.1 80.9 85.0
(US$/bbl) (15.4) (-48.4) (27.1) (-23.2) (27.2) (8.8) (17.1) (5.1)
Table 1-1 Macroeconomic Outlook (Base Case)
Notes : 1. Bracketed figures indicate year-to-year percentage changes.
2. GDP components may not add up to the total GDP due to minor data deviations. Sources : Actual results data prepared from various publications, forecasts by IEEJ
crisis. While the expansion of exports to Asian countries is slightly decelerating, exports to industrial countries are recovering moderately. Exports in FY2010 are likely to expand 17.4% from the previous year. Although raw materials and fuel imports have increased on the production recovery, overall imports have increased at a slower pace than exports due to limited private consumption recovery. Exports in the year are likely to rise 11.4% from the previous year.
Prices indicate a continuing deflationary trend. Domestic corporate goods prices, though still low, are likely to turn up with a slight hike in FY2010 as crude oil and other international commodity prices are rising. Consumer prices are expected to continue a downward trend under slumping private consumption. The consumer price index in FY2010 is expected to decline 0.8% from the previous year.
We expect the world economy to continue a recovery in FY2011. But industrial countries including Japan may slow down their recovery pace on the expiration of effects of economic stimulus measures, although China and other emerging countries may maintain their growth.
In the United States, the employment situation and the residential market have remained slack and income tax cuts are about to expire at the end of 2010. Recently, however, we have seen a financial market recovery under quantitative monetary easing. Given the continuation of economic stimulus measures, the U.S. economy in FY2011 may keep growing, though at a slower pace than in FY2010. Though being affected by spending cuts under budget problems as seen in FY2010, Europe may also keep growing moderately, driven by Germany that is expected to post firm export growth. The Asian economy may continue high growth in FY2011, benefitting from a recovery in exports to Europe and the United States. China is likely to maintain high growth in FY2011, given the expansion of consumption amid income growth and the possibility of a political leadership change in 2012. Other Asian economies are also likely to continue firm growth on the expansion of exports and domestic demand.
The Japanese economy may also continue a recovery in FY2011, posting a real GDP growth rate of 1.4% from the previous year. But the pace of the recovery may slacken as a slowdown in the production expansion under the deceleration of the world economy recovery is coupled with the absence of economic stimulus measures’ effects seen in the previous year. Domestic private demand may account for 1.4 percentage points of the projected GDP growth. While the employment situation may slightly improve on a recovery in production amid a continuous increase in exports, the private consumption recovery may sharply decelerate in reaction to sharp growth under economic stimulus measures in the previous year. Private consumption’s growth may be limited to 0.3%. Meanwhile, residential investment may turn up with a 4.0% increase even under a difficult income situation as such economic stimulus measures as the housing eco-point system remain effective until the end of 2011. Private nonresidential investment may grow 2.8% for the second consecutive year of growth as a sense of overcapacity weakens on a production recovery. Public demand may work to lower the GDP growth by 0.2 percentage point. Government consumption growth may decelerate to 0.8% as spending-saving efforts continue amid a continuous rise in social security expenses. Public investment may decline 5.9% as both central and local governments continue to cut such investment. External demand may account for 0.1 percentage
point of the FY2011 GDP growth. Exports, though with the expansion pace decelerating slightly from FY2010, may score a 5.1% increase thanks to brisk sales to fast-growing Asian countries. Imports may expand 4.7% as a rise in intermediate goods imports under the expansion of exports and production is coupled with a moderate increase in private consumption.
Prices may continue a deflationary trend, although price falls will slow down. Private consumption is unlikely to improve substantially even under an easier deflationary pressure. Imports prices may decline on the yen’s appreciation. Consumer prices are thus expected to drop 0.7% in FY2011.
1-3
Outlook on Production by Industry
The industrial production index in FY2010 may turn up with a substantial gain of 8.5% from the previous year. In the first half of the year, production expanded substantially as a rapid export rebound amid the global economic recovery was combined with Japan’s domestic demand expansion attributed to the eco-point system, eco-friendly car subsidies and other economic stimulus measures. A reaction to the termination of these measures may come in the second half. Given the expected export expansion, however, Japan’s production is expected to continue recovering, though at a slower pace.
The industrial production index in FY2011 may increase 2.4% from the previous year. It may thus grow for the second straight year, even though with the growth pace slowing down. While the global economic recovery may decelerate on the expiration of economic stimulus measures in industrial countries, brisk exports to Asia including China continuing high growth may drive Japan’s industrial production. Led by export-oriented industries including transportation and electrical machinery manufacturers, production may continue expanding. But the index may fall short of recovering the level before the September 2008 Lehman Shock. It is forecast at 95.5 (against 100 for the base year of 2005) for FY2011, slipping below a peak of 108.1 in FY2007 before the Lehman Shock. The following subsections describe the trends in production in major industries.
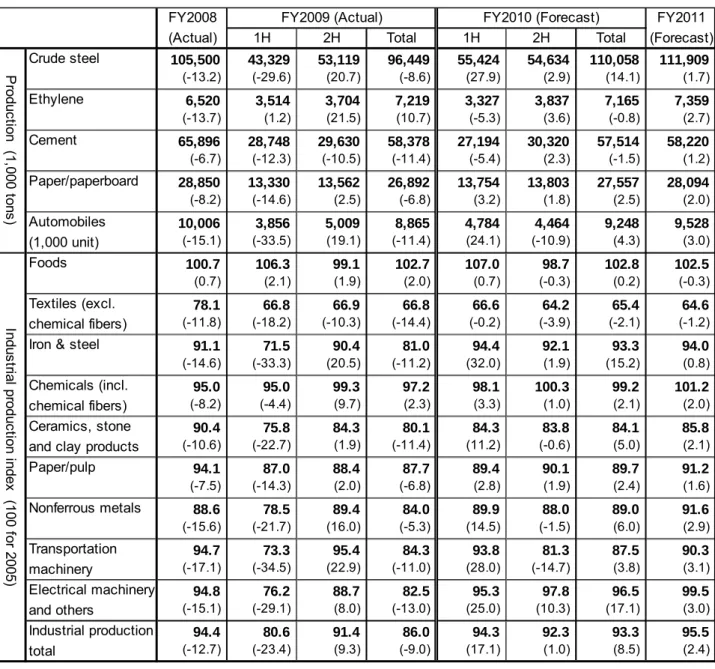
1-3-1 Crude Steel
Japan’s crude steel production in the first half of FY2010 expanded 27.9% from a year earlier as domestic demand including purchases by vehicle and machinery manufacturers recovered along with exports. Although exports account for some 40% of total demand for Japan’s crude steel output, exports including vehicles and machines as finished products cover more than 50% of the output. An economic recovery mainly in emerging countries made great contributions to the crude steel output expansion in Japan. In the second half of FY2010, however, domestic demand growth is expected to considerably decelerate on the termination of eco-friendly car subsidies and the reduction of the eco-point system for electrical appliances. Crude steel output for the whole of FY2010 is forecast to increase 14.1% from the previous year to 110.06 million tons, equivalent to some 90% of the FY2007 level. In FY2011, crude steel production is likely to expand 1.7% from the previous year to 111.91 million tons as both domestic and external demand increase on a rise in
exports of steel products as well as finished goods like vehicles and machines. Steel output for construction is expected to remain slack despite a recovery in private-sector demand, as public-sector demand has plunged.
1-3-2 Ethylene
Japan’s ethylene output in the first half of FY2010 decreased 5.3% from a year earlier as a half of Japan’s ethylene plants underwent regular repairs and exports declined substantially in reaction to the year-earlier briskness. While exports plunged, imports expanded substantially. Domestic demand increased considerably as output of automobiles and other machines recovered on the effects of policy measures including eco-friendly car subsidies and the eco-point system. We now see a reactionary domestic demand drop in response to the termination of eco-friendly car subsidies and the reduction of eco-points for electrical appliances. Since industrial production as a whole is expected to continue a moderate recovery, ethylene output in FY2010 is forecast to post a small drop of 0.8% from the previous year to 7.16 million tons. In FY2011, exports are expected to plunge as new petrochemical plants in the Middle East and China go on stream. Under a domestic economic recovery, however, domestic demand is likely to expand faster than imports decline. Ethylene output in FY2011 is thus forecast to increase 2.7% from the previous year to 7.36 million tons.
1-3-3 Paper and Paperboard
In the first half of FY2010, Japan’s paper output expanded as demand for coated printing paper for catalogues and leaflets recovered on the extension of eco-friendly car subsidies and the eco-point system. Greater demand for paper for packaging summer goods under summer heat waves, as well as brisk exports to Asia and Australia, also contributed to the paper output expansion. In a similar way, paperboard output also increased on brisk demand for paperboards for packaging electrical appliances subject to the eco-point system and on robust exports amid an Asian demand recovery. Paper and paperboard production in the first half grew 3.2% from a year earlier. In the second half, paperboard exports including cardboard paper will remain brisk. But a recovery in domestic paper and paperboard demand will slow down on the termination of eco-friendly vehicle subsidies and the reduction of the eco-point system for electrical appliances. Paper and paperboard output in the whole of FY2010 is projected at 27.56 million tons, up 2.5% from the previous year. In FY2011, paper production may increase on domestic and external demand growth. Paperboard output may also expand as cargo transportation grows brisk on a recovery in production in each industry. Therefore, paper and paperboard output in FY2011 may increase 2.0% from the previous year to 28.09 million tons.
1-3-4 Cement
In the first half of FY2010, Japan’s cement production decreased 5.4% from a year earlier as public sector demand dwindled on the government’s public investment curtailment despite a slight recovery in private sector demand. In the second half, cement exports may recover, though with
domestic demand remaining sluggish. As a result, cement output in the whole of FY2010 may fall 1.5% from the previous year to 57.51 million tons even amid an economic recovery. In FY2011, cement exports may firm on an Asian economic recovery. Domestic cement demand may level off as an increase in private sector demand amid an economic recovery offsets a further fall in public sector demand. Cement output in FY2011 is projected at 58.22 million tons, up 1.2% from the previous year.
1-3-5 Automobiles
Japan’s automobile production in the first half of FY2010 jumped 24.1% on a recovery in exports to Asian and other emerging countries, as well as tax breaks and subsidies for eco-friendly car purchases that worked to support domestic demand. In the second half, automobile exports may increase on brisk demand in Asian and other emerging countries including China and a moderate recovery in those to North America, which account for a half of Japan’s total vehicle exports, despite a delay in a recovery in those to Europe. Meanwhile, domestic automobile sales may plunge in reaction to the termination of eco-friendly car subsidies that had been extended until September 2010. Automobile production in the second half may decline 10.9% from a year earlier. Production in the whole of FY2010 may rise 4.3% from the previous year to 9.25 million units. In FY2011, domestic auto sales cannot be expected to increase as a reactionary decline after the termination of the subsidies is projected even amid continuing economic recovery. But exports to the rapidly growing Asian market may increase. Those to North America may continue to recover. Exports to Europe, whose recovery has been delayed, may gradually recover, centering on those to East European and other emerging countries. Given these conditions, we expect that auto output in FY2011 may increase 3.0% from the previous year to 9.53 million units. But the projected level is still about 20% less than the FY2007 record of 11.79 million units. Automakers are shifting their plants overseas on the yen’s appreciation as well as the shrinkage of the domestic market plagued with the falling birthrate, the aging population and young people’s shift away from cars. We may have to pay attention to automakers’ business strategies in order to check how domestic auto output will recover.
1-3-6 General and Electrical Machinery2
In the first half of FY2010, Japan’s general and electrical machinery production scored a substantial increase of 25.0% from a year earlier in reaction to a sharp year-before decline as export expansion amid the worldwide economic recovery and domestic demand recovery allowed production to generally rebound at manufacturers of general and electrical machinery, information and telecommunications equipment, and electronics parts and devices. In the second half, exports to the rapidly growing Asian market may continue to drive a recovery in production of electrical machinery and electronic parts in Japan. The extension of the eco-point system for electrical appliances until March 2011 is expected to support domestic demand. Capital investment may
2
“General and electrical machinery” covers general machinery, electrical machinery, information and telecommunications equipment, electronic parts and devices, precision machinery and metal products.
rebound on an economic recovery. Given these developments, we project the general and electrical machinery production index for FY2010 to score a sharp increase of 17.1% from the previous year in reaction to a year-earlier steep fall. In FY2011, domestic sales may decline in reaction to the termination of the eco-point system. But exports may remain brisk, including those to Asian and other emerging countries where consumer sentiment is robust. The production index may decelerate its growth to 3.0%.
Notes :
1. Bracketed figures indicate year-to-year percentage changes.
2. “General and electrical machinery” covers general machinery, electrical machinery, information and telecommunications equipment, electronic parts and devices, precision machinery and metal products.
Sources : Actual results data prepared from various publications, forecasts by IEEJ
Table 1-2 Outlook on Industrial Activities (Base Case)
FY2008 FY2009 (Actual) FY2010 (Forecast) FY2011
(Actual) 1H 2H Total 1H 2H Total (Forecast)
Crude steel 105,500 43,329 53,119 96,449 55,424 54,634 110,058 111,909
(-13.2) (-29.6) (20.7) (-8.6) (27.9) (2.9) (14.1) (1.7) Ethylene 6,520 3,514 3,704 7,219 3,327 3,837 7,165 7,359
(-13.7) (1.2) (21.5) (10.7) (-5.3) (3.6) (-0.8) (2.7)
Cement 65,896 28,748 29,630 58,378 27,194 30,320 57,514 58,220
(-6.7) (-12.3) (-10.5) (-11.4) (-5.4) (2.3) (-1.5) (1.2) Paper/paperboard 28,850 13,330 13,562 26,892 13,754 13,803 27,557 28,094
(-8.2) (-14.6) (2.5) (-6.8) (3.2) (1.8) (2.5) (2.0)
Automobiles 10,006 3,856 5,009 8,865 4,784 4,464 9,248 9,528
(1,000 unit) (-15.1) (-33.5) (19.1) (-11.4) (24.1) (-10.9) (4.3) (3.0)
Foods 100.7 106.3 99.1 102.7 107.0 98.7 102.8 102.5
(0.7) (2.1) (1.9) (2.0) (0.7) (-0.3) (0.2) (-0.3) Textiles (excl. 78.1 66.8 66.9 66.8 66.6 64.2 65.4 64.6
chemical fibers) (-11.8) (-18.2) (-10.3) (-14.4) (-0.2) (-3.9) (-2.1) (-1.2)
Iron & steel 91.1 71.5 90.4 81.0 94.4 92.1 93.3 94.0
(-14.6) (-33.3) (20.5) (-11.2) (32.0) (1.9) (15.2) (0.8) Chemicals (incl. 95.0 95.0 99.3 97.2 98.1 100.3 99.2 101.2
chemical fibers) (-8.2) (-4.4) (9.7) (2.3) (3.3) (1.0) (2.1) (2.0)
Ceramics, stone 90.4 75.8 84.3 80.1 84.3 83.8 84.1 85.8
and clay products (-10.6) (-22.7) (1.9) (-11.4) (11.2) (-0.6) (5.0) (2.1)
Paper/pulp 94.1 87.0 88.4 87.7 89.4 90.1 89.7 91.2
(-7.5) (-14.3) (2.0) (-6.8) (2.8) (1.9) (2.4) (1.6)
Nonferrous metals 88.6 78.5 89.4 84.0 89.9 88.0 89.0 91.6
(-15.6) (-21.7) (16.0) (-5.3) (14.5) (-1.5) (6.0) (2.9)
Transportation 94.7 73.3 95.4 84.3 93.8 81.3 87.5 90.3
machinery (-17.1) (-34.5) (22.9) (-11.0) (28.0) (-14.7) (3.8) (3.1)
Electrical machinery 94.8 76.2 88.7 82.5 95.3 97.8 96.5 99.5
and others (-15.1) (-29.1) (8.0) (-13.0) (25.0) (10.3) (17.1) (3.0)
Industrial production 94.4 80.6 91.4 86.0 94.3 92.3 93.3 95.5
total (-12.7) (-23.4) (9.3) (-9.0) (17.1) (1.0) (8.5) (2.4)
P
roduc
tion
(1
,0
00
t
on
s)
In
dus
tria
l pr
oduc
tion i
ndex
(
100
f
or
2
2.
Outlook on Energy Supply and Demand in FY2010 and FY2011
2-1
Outlook on Domestic Primary Energy Supply
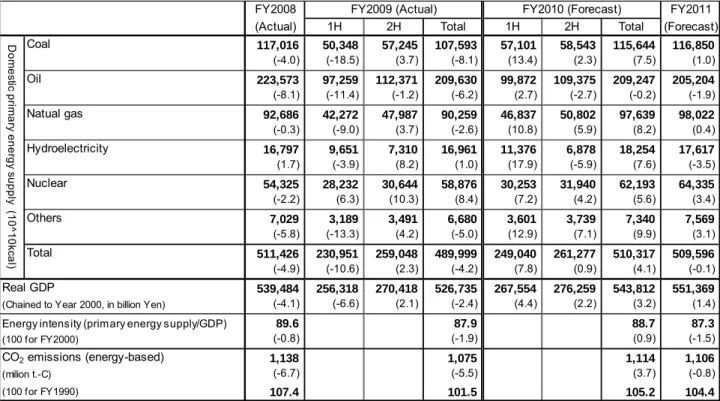
For FY2010, Japan’s domestic primary energy supply is expected to increase 4.1% from the previous year due mainly to a recovery in production and economic activities. In the first half and the early second half of the year, electricity demand grew due to summer heat waves as well as brisk production of steel and machinery including automobiles under the eco-friendly car subsidies and the eco-point system for electrical appliances. But production has slackened on the termination of the eco-friendly car subsidies and the reduction of the eco-point system. Among energy sources, coal supply in FY2010 is projected to increase 7.5% from the previous year due to a substantial recovery in steel production and a rise in the capacity utilization rate for coal thermal power plants under the summer heat waves. Oil supply in FY2010 is likely to decline 0.2% from the previous year as its downward trend comes in the second half of the year again after a gasoline consumption increase that emerged on deterioration of automobiles’ fuel efficiency under record summer heat waves in the first half. Natural gas supply in FY2010 is expected to increase 8.2% from the previous year as town gas consumption and gas thermal electricity generation grow on lower-than-usual ambient temperatures in the beginning of the year and the summer heat waves. Hydroelectricity supply in FY2010 is estimated to expand 7.6% from the previous year as water availability exceeded the year-before level between April and August. (Water availability in the second half of the year is assumed at the average-year level). Nuclear electricity supply in FY2010 is projected to rise 5.6% from the previous year as a nuclear plant resumed operations after a long suspension. Energy-based carbon dioxide emissions in FY2010 are estimated to increase 3.7% from the previous year.
In FY2011, coal supply is expected to increase 1.0% from the previous year on continuous growth in steel and other output, despite a drop in the capacity utilization rates of coal thermal power plants in reaction to summer heat waves in FY2010. Oil supply in FY2011 is projected to decrease 1.9% from the previous year on a decline in demand for oil for power generation and transportation in reaction to the previous year’s summer heat waves, a growing fuel switch from oil to town gas or electricity, and improvements in automobile fuel efficiency, although a production recovery is expected to work to boost oil demand. Natural gas supply in FY2011 is estimated to rise 0.4% from the previous year thanks to an increase in town gas demand amid the fuel switch from oil to gas, although demand for gas for power generation is likely to decline due to a reaction to the previous year’s summer heat waves and a rise in the capacity utilization rate for nuclear plants. Hydroelectricity supply in FY2011 is expected to decrease 3.5% from the previous fiscal year on a reaction to abundant water supply in the first half of FY2010, although the water availability is expected at an average-year level. Nuclear electricity supply in FY2011 is estimated to score an increase of 3.4% due to new plant launches and improvements in the capacity utilization rate as planned in regular checkup schedules. Given all of these factors, total domestic primary energy supply in FY2011 is expected to decrease 0.1% from the previous year. Carbon dioxide emissions are estimated to drop 0.8%. (A global warming prevention tax, full feed-in tariff system for renewable
energy power generation, domestic emissions trading system and an expressway toll system change now under consideration by the government are not taken into account for our projection.)
Table 2-1 Outlook on Domestic Primary Energy Supply (Base Case)
Note : Bracketed figures indicate year-to-year percentage changes. “Others” include geothermal energy, new energies, etc. Sources : Actual results data prepared from IEEJ and Department of the Environment databases, and Cabinet Office’s
“Preliminary National Income Statistics;” Forecasts by IEEJ
2-2
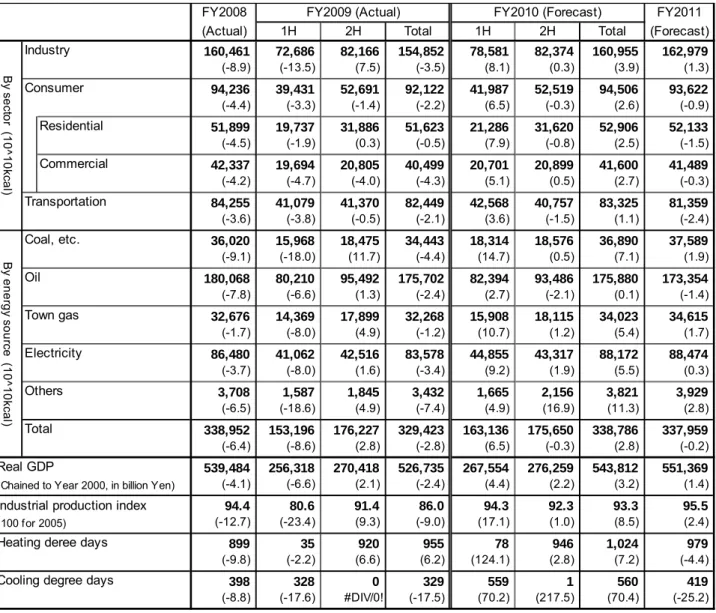
Outlook on Final Energy Consumption
In FY2010, Japan’s final energy consumption is expected to increase 2.8% from the previous year. In the industrial sector, final energy consumption is expected to increase 3.9% as production including steel, automobile and general machinery continues to recover. In the residential sector, energy consumption per household has been on a downward trend as the diffusion of household appliances has been close to saturation and as the energy efficiency of appliances has improved. But the residential sector’s final energy consumption in FY2010 is projected to increase 2.5% from the previous year due to a rise in air-conditioning demand under the actual record summer heat waves and the expected colder-than-usual winter weather. In the commercial sector, final energy consumption in FY2010 is also projected to rise 2.7% from the previous year on a sharp increase in summer air-conditioning demand and a recovery in services activities. The transportation sector’s final energy consumption in FY2010 is predicted to increase 1.1% due to a transportation demand rise amid an economic recovery and greater automobile air-conditioning demand under the summer heat waves.
In FY2011, final energy consumption may decline in reaction to the previous year’s record summer heat waves as the economic recovery trend weakens. In the industrial sector, final energy
FY2008 FY2009 (Actual) FY2010 (Forecast) FY2011
(Actual) 1H 2H Total 1H 2H Total (Forecast)
Coal 117,016 50,348 57,245 107,593 57,101 58,543 115,644 116,850
(-4.0) (-18.5) (3.7) (-8.1) (13.4) (2.3) (7.5) (1.0)
Oil 223,573 97,259 112,371 209,630 99,872 109,375 209,247 205,204
(-8.1) (-11.4) (-1.2) (-6.2) (2.7) (-2.7) (-0.2) (-1.9)
Natual gas 92,686 42,272 47,987 90,259 46,837 50,802 97,639 98,022
(-0.3) (-9.0) (3.7) (-2.6) (10.8) (5.9) (8.2) (0.4)
Hydroelectricity 16,797 9,651 7,310 16,961 11,376 6,878 18,254 17,617
(1.7) (-3.9) (8.2) (1.0) (17.9) (-5.9) (7.6) (-3.5)
Nuclear 54,325 28,232 30,644 58,876 30,253 31,940 62,193 64,335
(-2.2) (6.3) (10.3) (8.4) (7.2) (4.2) (5.6) (3.4)
Others 7,029 3,189 3,491 6,680 3,601 3,739 7,340 7,569
(-5.8) (-13.3) (4.2) (-5.0) (12.9) (7.1) (9.9) (3.1)
Total 511,426 230,951 259,048 489,999 249,040 261,277 510,317 509,596
(-4.9) (-10.6) (2.3) (-4.2) (7.8) (0.9) (4.1) (-0.1)
Real GDP 539,484 256,318 270,418 526,735 267,554 276,259 543,812 551,369
(Chained to Year 2000, in billion Yen) (-4.1) (-6.6) (2.1) (-2.4) (4.4) (2.2) (3.2) (1.4) Energy intensity (primary energy supply/GDP) 89.6 87.9 88.7 87.3
(100 for FY2000) (-0.8) (-1.9) (0.9) (-1.5)
CO2 emissions (energy-based) 1,138 1,075 1,114 1,106
(milion t.-C) (-6.7) (-5.5) (3.7) (-0.8)
(100 for FY1990) 107.4 101.5 105.2 104.4
Dom
e
sti
c pr
im
ar
y ener
gy
s
u
pply
(
10^10k
ca
consumption in FY2011 is likely to increase 1.3% from the previous year as a general recovery in production including general machinery and automobiles is expected to become moderate. As we assume a temperature pattern (a cooler summer and a slightly warmer winter than in FY2010) based on the average over the past 10 years, air-conditioning demand in the consumer sector is expected to make great negative contributions to final energy consumption. In the residential sector, final energy consumption in FY2011 is expected to fall 1.5% from the previous year in reaction to the summer heat waves in the previous year. Consumption in the commercial sector is also projected to decline 0.3% in reaction to the heat waves, despite a recovery in services activities. Final energy consumption in the transportation sector in FY 2011 is estimated to drop 2.4% despite a continuous recovery trend in transportation demand as automobile fuel consumption falls on fuel and transportation efficiency improvements and the reaction to the previous year’s brisk auto air-conditioning demand under the heat waves. Given all of these factors, Japan’s total final energy consumption in FY2011 is expected to decrease 0.2% from the previous year.
Table 2-2 Outlook on Final Energy Consumption (Base Case)
FY2008 FY2009 (Actual) FY2010 (Forecast) FY2011
(Actual) 1H 2H Total 1H 2H Total (Forecast)
Industry 160,461 72,686 82,166 154,852 78,581 82,374 160,955 162,979
(-8.9) (-13.5) (7.5) (-3.5) (8.1) (0.3) (3.9) (1.3)
Consumer 94,236 39,431 52,691 92,122 41,987 52,519 94,506 93,622
(-4.4) (-3.3) (-1.4) (-2.2) (6.5) (-0.3) (2.6) (-0.9)
Residential 51,899 19,737 31,886 51,623 21,286 31,620 52,906 52,133
(-4.5) (-1.9) (0.3) (-0.5) (7.9) (-0.8) (2.5) (-1.5)
Commercial 42,337 19,694 20,805 40,499 20,701 20,899 41,600 41,489
(-4.2) (-4.7) (-4.0) (-4.3) (5.1) (0.5) (2.7) (-0.3)
Transportation 84,255 41,079 41,370 82,449 42,568 40,757 83,325 81,359
(-3.6) (-3.8) (-0.5) (-2.1) (3.6) (-1.5) (1.1) (-2.4)
Coal, etc. 36,020 15,968 18,475 34,443 18,314 18,576 36,890 37,589
(-9.1) (-18.0) (11.7) (-4.4) (14.7) (0.5) (7.1) (1.9)
Oil 180,068 80,210 95,492 175,702 82,394 93,486 175,880 173,354
(-7.8) (-6.6) (1.3) (-2.4) (2.7) (-2.1) (0.1) (-1.4)
Town gas 32,676 14,369 17,899 32,268 15,908 18,115 34,023 34,615
(-1.7) (-8.0) (4.9) (-1.2) (10.7) (1.2) (5.4) (1.7)
Electricity 86,480 41,062 42,516 83,578 44,855 43,317 88,172 88,474
(-3.7) (-8.0) (1.6) (-3.4) (9.2) (1.9) (5.5) (0.3)
Others 3,708 1,587 1,845 3,432 1,665 2,156 3,821 3,929
(-6.5) (-18.6) (4.9) (-7.4) (4.9) (16.9) (11.3) (2.8)
Total 338,952 153,196 176,227 329,423 163,136 175,650 338,786 337,959
(-6.4) (-8.6) (2.8) (-2.8) (6.5) (-0.3) (2.8) (-0.2)
Real GDP 539,484 256,318 270,418 526,735 267,554 276,259 543,812 551,369
(Chained to Year 2000, in billion Yen) (-4.1) (-6.6) (2.1) (-2.4) (4.4) (2.2) (3.2) (1.4)
Industrial production index 94.4 80.6 91.4 86.0 94.3 92.3 93.3 95.5
(100 for 2005) (-12.7) (-23.4) (9.3) (-9.0) (17.1) (1.0) (8.5) (2.4)
Heating deree days 899 35 920 955 78 946 1,024 979
(-9.8) (-2.2) (6.6) (6.2) (124.1) (2.8) (7.2) (-4.4)
Cooling degree days 398 328 0 329 559 1 560 419
(-8.8) (-17.6) #DIV/0! (-17.5) (70.2) (217.5) (70.4) (-25.2)
B y s e cto r (1 0^ 10 kc al ) B y en e rgy s o u rc e ( 1 0^ 10 kc al )
Note : Bracketed figures indicate year-to-year percentage changes. The industrial sector consumption includes non-energy uses. Sources : Actual results data prepared form IEEJ database and others; forecasts by IEEJ.
Table 2-3 Outlook on Power Generation Mix (Electric Power Utilities) (Base Case)
Note : Bracketed figures indicate year-to-year percentage changes. Sources : Actual results data and forecasts prepared from IEEJ database
2-3
Outlook on Energy Sales
2-3-1 Electricity
In FY2010, Japan’s electricity sales (by electric power utilities) are projected to increase 5.4% due to the sharp increase in air-conditioning demand mainly in the residential and commercial sectors under the summer heat waves and an expected rise in industrial demand amid a production recovery.
In the residential sector, the number of all-electric households increased to an estimated 4.09 million at the end of the first half of FY2010. As such expansion of base-load demand was coupled with a substantial rise in air-conditioning demand under the record summer heat waves, household electricity demand in the first half of FY2010 scored a substantial increase of 10.2% from a year earlier. In the second half of the year, air-conditioning demand soared in September and October when ambient temperatures were higher than a year earlier. Heating demand is expected to increase on projected lower ambient temperatures this winter and a growing switch from kerosene heaters to air conditioners just before the reduction of the eco-point system for electrical home appliances. Given all of these factors, household electricity demand in the whole of FY2010 is expected to increase 5.2% from the previous year.
FY2008 FY2009 (Actual) FY2010 (Forecast) FY2011
(Actual) 1H 2H Total 1H 2H Total (Forecast)
Thermal power 130,552 56,529 61,445 117,974 60,927 61,952 122,879 121,700
(-6.3) (-16.6) (-2.1) (-9.6) (7.8) (0.8) (4.2) (-1.0)
Coal 50,545 22,374 25,597 47,971 24,446 26,127 50,573 50,307
(-3.7) (-13.3) (3.5) (-5.1) (9.3) (2.1) (5.4) (-0.5)
Oil, etc. 24,653 7,415 7,434 14,849 8,104 6,813 14,917 14,317
(-17.9) (-47.0) (-30.2) (-39.8) (9.3) (-8.4) (0.5) (-4.0) Crude oil 7,509 1,588 1,874 3,462 2,614 1,705 4,320 3,882
(-29.5) (-67.2) (-29.8) (-53.9) (64.6) (-9.0) (24.8) (-10.1)
Fuel oil C 12,495 3,923 3,275 7,198 3,488 3,025 6,514 6,192
(-11.9) (-42.5) (-42.2) (-42.4) (-11.1) (-7.6) (-9.5) (-4.9)
Natural gas 55,354 26,740 28,414 55,154 28,378 29,012 57,389 57,077
(-2.4) (-4.4) (3.7) (-0.4) (6.1) (2.1) (4.1) (-0.5) Hydroelectricity 15,199 8,910 6,721 15,631 10,543 6,340 16,882 16,292
(1.5) (-2.0) (10.0) (2.8) (18.3) (-5.7) (8.0) (-3.5)
Nuclear 54,325 28,232 30,644 58,876 30,253 31,940 62,193 64,335
(-2.2) (6.3) (10.3) (8.4) (7.2) (4.2) (5.6) (3.4)
Others 1,115 582 564 1,146 659 639 1,298 1,388
(-6.9) (7.0) (-1.2) (2.8) (13.3) (13.3) (13.3) (6.9)
Total 201,191 94,253 99,374 193,627 102,382 100,870 203,252 203,714
(-4.6) (-9.3) (2.2) (-3.8) (8.6) (1.5) (5.0) (0.2)
Power output 81,711 38,451 40,808 79,259 42,034 41,588 83,622 83,819
(10^10kcal) (-4.3) (-8.4) (2.7) (-3.0) (9.3) (1.9) (5.5) (0.2)
In
put
(
1
0^
10
kc
al
Industrial sector electricity demand in the first half of FY2010 expanded sharply due to a production recovery in steel and other industries, and substantial declines in FY2009. Commercial sector electricity demand also grew on a rebound in services activities and a steep rise in air-conditioning demand under the record summer heat waves. The production recovery also led to greater private power generation. Non-household electricity demand (including specified-scale demand) in the first half of FY2010, dominated by the industrial and commercial sectors, posted a substantial rise of 8.7% from a year earlier. Electricity demand from large-scale industrial users in the first half of the fiscal year logged a sharp increase of 11.4% from a year earlier on a production recovery in all manufacturing industries including steel, ceramics and machinery. In the second half, electricity demand growth is expected to decelerate on an economic slowdown attributable to the termination of eco-friendly car subsidies and the reduction of the eco-point system for electrical appliances. But the substantial growth in the first half may allow non-household electricity demand (including specified-scale demand) in the whole of FY2010 to record a 5.5% increase from the previous year. Electricity demand from large-scale industrial users in the year may also log a sharp rise of 7.0%.
In FY2011, we expect to see a rising number of all-electric households and a growing switch from kerosene heaters to air conditioners. As we assume a temperature pattern (a cooler summer and a slightly warmer winter than in FY2010) based on the average over the past 10 years, however,
FY2008 FY2009 (Actual) FY2010 (Forecast) FY2011
(Actual) 1H 2H Total 1H 2H Total (Forecast)
Household demand 285.3 132.6 152.4 285.0 146.2 153.7 299.9 295.5
(-1.5) (-1.3) (1.0) (-0.1) (10.2) (0.9) (5.2) (-1.5)
Industrial demand 635.5 303.6 300.8 604.4 330.1 307.6 637.6 643.9
(incl. specified scale demand) (-4.4) (-10.4) (1.4) (-4.9) (8.7) (2.2) (5.5) (1.0)
Total 920.8 436.2 453.2 889.4 476.2 461.3 937.5 939.4
(incl. specified scale demand) (-3.6) (-7.8) (1.2) (-3.4) (9.2) (1.8) (5.4) (0.2)
(Regrouped) 299.9 138.1 142.8 280.9 153.9 146.8 300.6 305.2
Large-scale industrial users (-6.4) (-15.8) (5.1) (-6.3) (11.4) (2.8) (7.0) (1.5)
Chemicals 30.0 12.9 13.8 26.7 14.2 13.9 28.1 28.5
(-8.1) (-21.8) (2.4) (-10.9) (10.0) (1.0) (5.4) (1.2)
Iron & steel 51.2 21.6 24.7 46.3 26.5 26.3 52.8 53.1
(-10.7) (-25.4) (10.8) (-9.7) (22.9) (6.4) (14.1) (0.6)
Machinery 76.2 34.1 35.4 69.5 38.7 37.6 76.4 78.6
(-8.2) (-20.3) (6.0) (-8.8) (13.6) (6.3) (9.9) (2.9)
Total 250.9 113.3 118.8 232.1 128.5 122.6 251.0 255.5
(-7.4) (-18.5) (6.1) (-7.5) (13.4) (3.1) (8.2) (1.8)
E
lec
tric
ity
de
m
a
n
d
(
b
illio
n k
W
h
)
Table 2-4 Outlook on Electricity Demand (Electric Power Utilities, by Use) (Base Case)
Notes :
1. Bracketed figures indicate year-to-year percentage changes.
2. The data include specified supplies by electric power utilities and exclude captive consumption. But captive consumption at Tobata Co-operative Thermal Power Company, Inc. and Oita Co-operative Thermal Power Company, Inc. is treated as specified supplies.
3. We estimated demand in and after FY2010 in accordance with the categorization before an institutional change to secure the continuity of the statistics.
air-conditioning demand is expected to sharply plunge in reaction to the previous year’s increase on the summer heat waves. Eventually, household electricity demand in FY2011 is projected to decline 1.5% from the previous year. Non-household electricity demand (including specified-scale demand) is expected to increase 1.0% on a continuous recovery in production and services activities, although air-conditioning demand in the commercial sector is likely to decline in reaction to the sharp rise in the previous year. Large-scale industrial users are expected to decelerate their production recovery. While their exports are likely to increase, domestic demand is expected to decline on the expiration of effects of economic stimulus measures. Electricity demand growth in FY2011 may be limited to 2.9% in the machinery and appliance industry and to 0.6% in the steel industry. As the electricity demand recovery is predicted to slow down in a wide range of industries, we expect that non-household electricity demand growth in FY2011 may be limited to 1.5%. Given these factors, Japan’s total electricity sales in FY2011 are expected to increase 0.2% from the previous year.
2-3-2 Town Gas
Japan’s town gas sales (by gas utilities) in FY 2010 are expected to increase 4.4% from the previous year due to a substantial rise in air-conditioning demand under lower-than-usual spring temperatures and summer heat waves, as well as an expansion in industrial gas demand on a production rebound backed by an economic recovery.
Town gas demand in the residential sector in the first half of FY2010 grew 3.0% from a year earlier on greater hot-water demand under lower-than-usual spring temperatures, although consumption per household declined on a fall in the average number of persons per household and improvements in gas equipment efficiency. As we assume a colder winter than a year earlier for the second half as a gas demand season, heating and hot-water demand is expected to grow. Town gas sales in the whole of FY2010 are expected to increase 1.0% from the previous year.
In the commercial sector, demand in the first half of FY2010 increased 5.0% from a year earlier due to a substantial rise in air-conditioning demand under lower-than-usual spring temperatures and summer heat waves, as well as an expansion in services activities on an economic recovery. As a colder winter than in the previous year and a recovery in services activities are assumed for the second half of FY2010, the commercial sector’s town gas demand in the whole of FY2010 may increase 3.2%. In the “other” sector (hospitals, public facilities, etc.) that is sensitive to temperature changes, town gas demand in the first half of FY2010 posted a substantial increase of 13.2% from a year earlier, indicating a huge impact from record summer heat waves. Heating demand is predicted to rise in the second half. The “other” sector’s town gas demand in the whole of FY2010 is likely to grow 7.0% from the previous year.
Industrial sector demand for town gas in the first half of FY2010 logged a substantial increase of 11.0% from a year earlier in reaction to a sharp year-earlier fall as production rebounded on an economic recovery. As a production recovery is expected to continue in the second half, the industrial sector’s town gas demand in the whole of FY2010 is projected to expand 6.3% from the previous year.
year, town gas sales in the coming year are likely to undergo reactionary downward pressure. Even under such pressure, the residential sector’s town gas demand is projected to increase 0.9% on a firm increase in the number of town gas contracts and a household income expansion under a moderate economic recovery. The commercial sector’s town gas demand in FY2011 is estimated to increase 1.5% on a recovery in services activities and a firm rise in new contracts, even under the downward pressure of ambient temperature changes. But the “other” sector’s gas demand is projected to decline 0.7% due to the ambient temperature changes, although market exploration is expected to make progress. Gas demand in the industrial sector is forecast to rise 3.5% on a continuous production recovery working to boost gas consumption under existing gas service contracts and on a fuel switch from oil to gas through gas sales promotion efforts. Given these factors, town gas sales as a whole in FY2011 are estimated to increase 2.2% from the previous year.
Table 2-5 Outlook on Town Gas Sales (Base Case)
Notes :
1. Bracketed figures indicate year-to-year percentage changes. 2. Converted at 2. 1m3=41.8605MJ (10,000kcal)
Sources : Actual results data prepared from METI’s “Monthly Gas Industry Statistics,” forecast by IEEJ
2-3-3 Oil
For FY2010, fuel oil sales are projected to limit their decline to 0.6% from the previous year on the strength of an increase in industrial and other demand and a summer expansion in automobile fuel sales (gasoline and diesel oil) under heat waves, decelerating a downward trend over the past years amid a fuel switch.
Sales of gasoline, used mainly as automobile fuel, have basically followed a downtrend due to fuel efficiency improvements and shorter travel distances. In the first half of FY2010, however, gasoline sales increased 2.7% from a year earlier as fuel efficiency deteriorated on record summer heat waves. Diesel oil sales in the first half of the fiscal year increased 2.8% from a year earlier due to a cargo transportation demand increase amid an economic recovery and the fuel efficiency deterioration under the record summer heat waves, although diesel car and truck ownership followed a downward trend. As gasoline sales are expected to return to a downward trend in the
FY2008 FY2009 (Actual) FY2010 (Forecast) FY2011
(Actual) 1H 2H Total 1H 2H Total (Forecast)
Household 9,646 3,694 5,934 9,629 3,806 5,915 9,721 9,810
(-2.3) (-1.4) (0.6) (-0.2) (3.0) (-0.3) (1.0) (0.9) Commercial 4,760 2,361 2,255 4,616 2,480 2,285 4,765 4,838
(-3.7) (-4.4) (-1.5) (-3.0) (5.0) (1.3) (3.2) (1.5) Industrial 17,247 7,870 8,837 16,707 8,733 9,025 17,758 18,382
(-5.0) (-13.7) (8.8) (-3.1) (11.0) (2.1) (6.3) (3.5)
Others 2,852 1,373 1,513 2,886 1,555 1,533 3,088 3,068
(-2.6) (0.2) (2.1) (1.2) (13.2) (1.4) (7.0) (-0.7)
Total 34,505 15,299 18,539 33,837 16,574 18,758 35,332 36,098
(-3.9) (-8.5) (4.2) (-1.9) (8.3) (1.2) (4.4) (2.2)
T
o
w
n
g
a
s s
a
les
(
m
illio
n m
3
second half, gasoline sales in the whole of FY2010 are projected to increase 0.1% from the previous year. Diesel oil sales are also expected to return to a downward trend in the second, although transportation activities are likely to continue recovery. In the whole of FY2010, diesel oil sales are projected to increase 0.3% from the previous year.
Sales of naphtha, a raw material for petrochemical products, in the first half of FY2010 declined 0.6% from a year earlier as ethylene output decreased on the concentration of regular petrochemical plant repairs. Although ethylene output is likely to firm in the second half, naphtha sales in the whole of FY2010 are forecast to fall 0.2% from the previous year.
Kerosene sales in the first half of FY2010 posted a significant increase of 10.7% from a year earlier on an industrial production increase amid an economic recovery and lower-than-usual spring temperatures, although both the consumer and industrial sectors promoted a fuel switch from kerosene to electricity or town gas. For the second half of the fiscal year, in which about 70% of annual demand is usually expected, we can anticipate a heating demand increase on lower temperatures than a year earlier. But the promotion of the fuel switch may work to reduce kerosene sales in the whole of FY2010 1.5% from the previous year.
Demand for fuel oil A from the industrial and consumer sectors has been significantly affected by a fuel switch from fuel oil to town gas. Under the impact of the fuel switch, fuel oil A sales in the first half of FY2010 declined 3.4%, although an industrial production increase amid the economic recovery worked to expand demand for fuel oil A. The fuel switch may continue despite a demand increase caused by the economic recovery in the second half. Fuel oil A sales in the whole of FY2010 are projected to decrease 4.7% from the previous year.
Demand for fuel oil C as power generation fuel in the first half of FY2010 fell 11.4% from a year earlier as crude oil expanded its share of fuels for oil thermal power generation that increased under the summer heat waves. Fuel oil C was the only thermal power generation fuel to post a demand drop in the period. But fuel oil C demand from the industrial and transportation sectors increased substantially on growth in production and cargoes for shipping amid an economic recovery. As a result, overall fuel oil C demand in the first half scored a 4.0% rise from a year earlier. In the second half, demand for fuel oil C for power generation may decrease on an increase in nuclear power generation. Fuel oil C demand from industrial and other sectors may return to a downward trend due to a fuel switch as well as a slower economic recovery. Overall fuel oil C demand in the whole of FY2010 is projected to decline 2.6%. LPG sales for household consumption and town gas services increased on lower-than-usual spring temperatures. Those for the industrial sector also expanded amid an economic recovery. But LPG sales for chemical materials decreased substantially. Overall LPG demand in the first half of FY2010 dropped 1.0%. In the second half, LPG sales for chemical materials may recover and those for the industrial sector may firm. But LPG sales for the residential and transportation sectors may continue a downward trend. In the whole of FY2010, LPG sales are projected to decrease 0.2%.
In FY2011, gasoline sales are predicted to decline 3% from the previous year due to auto fuel efficiency improvements amid the diffusion of eco-friendly cars and a shift to fuel-efficient minivehicles, as well as a reaction to the previous year’s summer heat waves. (A global warming
prevention tax and an expressway toll system change are not taken into account.) Diesel oil sales in the year are also expected to decrease 2.4% from the previous year despite a cargo transportation recovery, as demand from the transportation sector plunges on transportation efficiency improvements and a reaction to the previous year’s summer heat waves. Naphtha sales in FY2011 are projected to increase 2.1% from the previous year as ethylene output expands after regular repairs of many plants in FY2010. Kerosene sales are forecast to decline 4.3% on a heating demand decline under our ambient temperature assumption and households’ switch to electricity for heating. Although production and transportation activities are expected to recover, fuel oil A sales are predicted to decline 3.7% on a fuel switch from fuel oil A to town gas. Fuel oil C sales for power generation may decrease on an increase in operations of nuclear power plants. Those for industrial uses, like fuel oil A for such uses, are likely to continue a downward trend on a fuel switch. Overall fuel oil C sales in FY2011 are estimated to fall 4.4% from the previous year. Given all of these factors, we predict overall fuel oil sales in FY2011 to decrease 1.9% from the previous year. LPG sales are expected to decline for the consumer sector while increasing for the industrial sector and chemical materials. Overall LPG sales in FY2011 are forecast to increase 0.3% from the previous year.
Table 2-6 Outlook on Fuel Oil Sales (Base Case)
FY2008 FY2009 (Actual) FY2010 (Forecast) FY2011
(Actual) 1H 2H Total 1H 2H Total (Forecast)
Gasoline 57,497 29,100 28,469 57,569 29,892 27,746 57,639 55,893
(-2.7) (-0.0) (0.3) (0.1) (2.7) (-2.5) (0.1) (-3.0)
Naphtha 42,861 22,301 25,009 47,310 22,178 25,037 47,215 48,184
(-11.7) (0.2) (21.3) (10.4) (-0.6) (0.1) (-0.2) (2.1)
Jet fuel 5,676 2,586 2,734 5,319 2,737 2,769 5,506 5,510
(-3.0) (-9.0) (-3.6) (-6.3) (5.9) (1.3) (3.5) (0.1)
Kerosene 20,249 4,965 15,081 20,045 5,494 14,258 19,752 18,897
(-10.7) (-3.3) (-0.2) (-1.0) (10.7) (-5.5) (-1.5) (-4.3)
Diesel oil 33,728 15,624 16,633 32,257 16,059 16,304 32,363 31,576
(-5.2) (-8.1) (-0.6) (-4.4) (2.8) (-2.0) (0.3) (-2.4) Fuel oil A 17,891 6,944 9,099 16,043 6,709 8,572 15,281 14,716
(-16.3) (-16.1) (-5.4) (-10.3) (-3.4) (-5.8) (-4.7) (-3.7)
Fuel oil B/C 23,159 8,355 8,035 16,390 8,686 7,276 15,962 15,264
(-8.7) (-31.7) (-26.5) (-29.2) (4.0) (-9.4) (-2.6) (-4.4) For power generation 12,823 3,959 3,257 7,216 3,506 2,990 6,497 6,198
(-10.0) (-44.8) (-42.4) (-43.7) (-11.4) (-8.2) (-10.0) (-4.6) For other uses 10,336 4,396 4,778 9,174 5,180 4,286 9,465 9,066
(-7.0) (-13.2) (-9.4) (-11.2) (17.8) (-10.3) (3.2) (-4.2)
Total 201,060 89,875 105,059 194,934 91,755 101,963 193,718 190,040
(-7.9) (-7.2) (0.8) (-3.0) (2.1) (-2.9) (-0.6) (-1.9)
LPG sales 17,367 7,691 8,728 16,419 7,616 8,771 16,387 16,438
(1,000 tons) (-6.9) (-7.6) (-3.4) (-5.5) (-1.0) (0.5) (-0.2) (0.3)
F
uel
oil s
a
les
(
1
,000 k
l)
Note : Bracketed figures indicate year-to-year percentage changes.
Sources : Actual results data prepared from METI, “Monthly Resources and Energy Statistics” Petroleum Association of Japan, “Monthly Oil Statistics,” and Japan LP Gas Association, “LP Gas Receipt and Delivery Monthly Report;” forecast by IEEJ
3.
Evaluating Possible Impacts of Factors Affecting Energy Supply and
Demand in FY2011
To evaluate possible impacts of factors that may affect energy supply and demand, we have performed a sensitivity analysis on our forecasts for FY2011. In a sensitivity analysis, we analyze variations from the base case in terms of differences in the outputs (forecasts) resulting from a change in only one of the assumptions (exogenous variables). This allows impacts of such change to be measured quantitatively. In this case, we have focused on the crude oil price and real GDP, which appear to be very uncertain over the short term, in order to identify how variations in these factors may affect our forecasts of economic activities and energy supply and demand in FY2011. In addition, we have quantitatively evaluated possible impacts of ambient temperature changes, which tend to affect energy demand.
3-1
Possible Impacts of Crude Oil Price Changes
3Crude oil prices are now on an upward trend amid a world economy recovery after a steep fall on the global financial crisis. Future crude oil prices as well as future world economic conditions and relevant expectations are uncertain. The CIF-based crude oil import price that we assumed for the base case is based on “Prospects for the International Oil Market and Crude Oil Prices in 2011” by Ken Koyama. We have assumed that the mean crude oil
price in FY2011 will be $85/barrel, the same level as seen at the end of 2010. We have evaluated the possible impacts of a higher or lower crude oil price, based on analyses of the higher and lower crude oil price cases in the above paper. For the higher-price case, the mean crude oil price for FY2011 is assumed at $95/barrel, $10 higher than in the base case. For the lower-price case, the mean price is put at $75/barrel, $10 lower than in the base case.
(Impacts that would be exerted on the Japanese economy from differences in views about the world economy behind the two cases are not taken into account here. We have purely focused on impacts of the crude oil price change alone.)
3
Natural gas and coal price changes responding to crude oil price changes are taken into account.
FY2011:GDP growth=1.4%,C.I.F. crude oil price =about $85/bbl
Base case
Impact of economic changes
・Import price = about $95/bbl ($10 higher than in base case)
・Import price = about $75/bbl ($10 lower than in base case)
・GDP growth change from base case
+1.0 percentage point
-1.0 percentage point
・Temperature: Up 1℃(July-September)・・Hotter summer Down 1℃(January-March)・・Colder winter Impact of crude price changes
Impact of temperature changes
The crude oil price is based on Ken Koyama, International Oil Situation and Oil Price Outlook for 2011,
December 22, 2010
Fig. 3-1 Structure of Analysis of Inpact