European Small Business Finance Outlook
Roger
Kelly
Helmut
Kraemer-Eis
Working Paper 2011/10 EIF Research & Market Analysis
Authors
Helmut Kraemer-Eis
Head of EIF’s Research & Market Analysis Contact: h.kraemer-eis@eif.org
Tel.: +352 42 66 88 394 Roger Kelly,
Research and Market Analysis, EIF. Contact: r.kelly@eif.org
Tel.: +352 42 66 88 396
Editor
Helmut Kraemer-Eis, Head of EIF’s Research & Market Analysis Contact:
European Investment Fund
96, Blvd Konrad Adenauer, L-2968 Luxembourg Tel.: +352 42 66 88 1
Fax: +352 42 66 88 280 www.eif.org
Luxembourg, June 2011
Disclaimer:
The information in this working paper does not constitute the provision of investment, legal, or tax advice. Any views expressed reflect the current views of the author(s), which do not necessarily correspond to the opinions of the European Investment Fund or the European Investment Bank Group. Opinions expressed may change without notice. Opinions expressed may differ from views set out in other documents, including other research published by the EIF. The information in this working paper is provided for informational purposes only and without any obligation. No warranty or representation is made as to the correctness, completeness and accuracy of the information given or the assessments made.
Executive summary
This European Small Business Finance Outlook provides an overview of the main markets relevant
to EIF (equity1, securitisation, microfinance). We start by discussing the general market
environment, then look at the main aspects of equity finance and the SME Securitisation (SMESec) market. Finally, we briefly highlight important aspects of microfinance in Europe.
There are signs that the global recovery is consolidating, with private demand filling the
gap left as public stimulus is removed. The risk of a double-dip recession has receded significantly. However, ongoing uncertainties have been magnified by geopolitical problems in the Middle East and North Africa region and the natural disaster in Japan.
Inflation remains an issue and policymakers continue to tread a fine line between
remaining accomodative and ensuring that price rises do not translate into second round wage and price pressures.
Investor sentiment in the eurozone remains fragile, after Portugal followed Greece and
Ireland to become the third country to seek international assistance in the face of unsustainable bond yields.
Surveys indicate that SMEs have encountered a moderate improvement in access to
external financial sources in recent months, although the terms on which lending has been offered has deteriorated a little. This may reflect liquidity issues and increased risk perceptions reported by banks.
The economic recovery of the past year has been reflected in insolvency figures, which
have been steadily falling, albeit with significant regional disparities.
Venture capital (VC) investment has remained in the doldrums, despite the recovery in
overall private equity: to a degree this reflects the greater extent to which buyouts suffered during the economic slowdown. Some of the gap left by the fall in venture investment has been filled by increased business angel activity; their proximity to the market has been beneficial during this difficult period.
Venture fundraising has continued to be restricted. In 2010 funds raised were around half
the level of fundraising in 2008. And the average fund size has fallen considerably across all VC sectors, which may be a cause for concern given the relationship between funds size and performance.
Divestments have increased by over 50% year on year in 2010, although this is due to a
pickup at the buyout end of the scale. Venture exits were in fact slightly lower in 2010 than in 2009. Encouragingly, write-offs are no longer the principal form of exit.
1 We are using the term “equity finance” to combine linguistically the areas of Venture Capital (VC) and Private Equity (PE). However, if we refer here to equity activities, we only consider the activities of EIF’s investment focus which neither includes Leveraged Buy-outs (LBOs) nor Public Equity activities. The reader can find a Private Equity glossary in Annex 1.
Venture performance has remained weak, apart from those in the top quartile, emphasising the importance of careful selection by investors.
Turning to SME securitisation, following a year without the public placement of an SME
transaction, in 2010 the SME securitisation market has shown some signs of reopening (with two benchmark transactions closed in UK and Germany). However, deal flow is expected to remain well below pre-crisis levels for some time.
During the crisis there was a wave of downgrades in SMESec transactions; this has
continued in 2010, in which almost half of the Moody’s downgrades were concentrated in SMESec transactions.
Looking forward, regulatory reforms will impact the securitisation market. Investors will
only return in volume if they regain confidence in the quality of transactions and if there is satisfactory secondary market liquidity. Originators will return if transactions are economically feasible.
Microfinance institutions have been affected by the crisis, through higher bad debt rates
among their clients, and in some cases through increased difficulties in accessing external sources of funding. While these risks have abated somewhat recently, they have been replaced by larger concerns about the future direction of the microfinance industry, in particular in the face of over-indebtedness of microfinance customers.
Table of contents
1 Introduction ...6
2 European economic environment ...6
3 Small business environment ...9
3.1
Bank lending activity...9
3.2
Access to finance ...10
3.3
Insolvencies ...12
4 European private equity market ...13
4.1
Investment activity ...13
4.2
Fundraising activity...15
4.3
Divestment activity...17
4.4
Performance trends and outlook...18
5 European SME Securitisation...21
5.1
Market activity...21
5.2
Performance trends and outlook...24
6 Microfinance...28
7 Concluding remarks...31
ANNEX ...33
Annex 1: PE Glossary ...33
Annex 2: Securitsation Glossary ...36
Annex 3: List of acronyms ...37
References...38
About … ...39
… the European Investment Fund...39
… EIF’s Research & Market Analysis ...39
1
Introduction
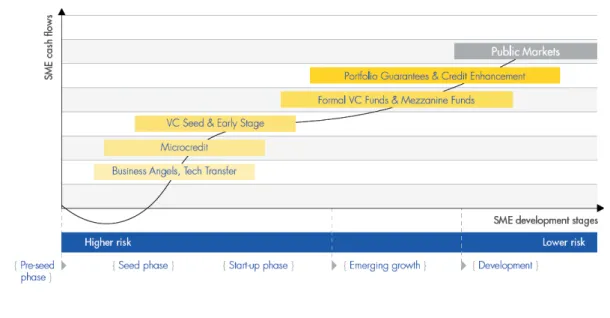
The EIF is the EIB Group’s specialist provider of risk financing for entrepreneurship and innovation across Europe, delivering a full spectrum of financing solutions through financial intermediaries (i.e. equity instruments, guarantee and credit enhancement instruments, as well as microfinance). The following figure shows the range of EIF’s activities:
Figure 1: EIF tool kit for SMEs
Source: EIF
The EIF focuses on the whole range of micro- to medium-sized enterprises, starting from the pre-seed, seed-, and startup-phase (technology transfer, business angel financing, microfinance, early stage VC) to the growth and development segment (formal VC funds, mezzanine funds, portfolio guarantees/credit enhancement).
Against this background this European Small Business Finance Outlook provides an overview of
the main markets relevant to EIF (equity2, securitisation, microfinance). We start by discussing the
general market environment, then look at the main aspects of equity finance and the SME Securitisation (SMESec) market. Finally, we briefly highlight important aspects of microfinance in Europe.
2
European economic environment
With spring come green shoots, and it appears to be true for the global economy too. The IMF (IMF, 2011) recently raised its 2011 global growth forecasts, with a forecast for global growth of 4.5% in 2011 and similar for 2012, which is back around the global average for 2004-8. They perceive that the ongoing divergence between growth in advanced and emerging economies will persist, with a forecast of 2.5% growth in advanced economies in 2011, compared to 6.5% in emerging economies. The Economist Intelligence Unit’s growth forecasts predict growth of a similar magnitude (EIU, 2011).
2 We are using the term “equity finance” to combine linguistically the areas of Venture Capital (VC) and Private Equity (PE). However, if we refer here to equity activities, we only consider the activities of EIF’s investment focus which does neither include Leveraged Buy-outs (LBOs) nor Public Equity activities.
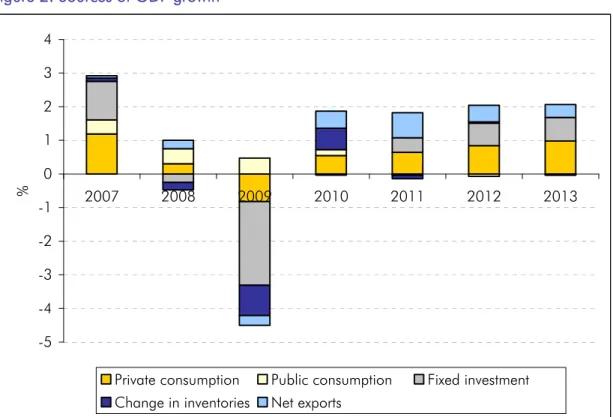
There had been concerns that 2011 would see a slow down in growth as base effects3 dissipated, the effects of fiscal stimulus waned, and fiscal austerity measures were implemented. In fact, the global recovery seems to be consolidating, and there are signs that the recovery is becoming self-sustaining, with consumer and (non-financial) business demand taking up the slack left by the withdrawal of government stimulus. Non-financial corporate balance sheets look increasingly healthy, which should lead to increased private investment, and although unemployment remains high in certain advanced economies, labour markets seem to be improving, resulting in increased private consumption (see figure 2). This relatively smooth transition from public to private demand has helped alleviate concerns of a double dip recession.
Figure 2: Sources of GDP growth
-5 -4 -3 -2 -1 0 1 2 3 4 2007 2008 2009 2010 2011 2012 2013 %
Private consumption Public consumption Fixed investment Change in inventories Net exports
Source: IMF (2011)
However, in spite of this positive news, uncertainty, which had arisen due to rapid growth (and the associated risk of overheating) in emerging economies, weakness in developed economies and resurging inflation, has been magnified somewhat by geopolitical uncertainty in the Middle East and North Africa, and the natural disasters in Japan. In addition to these issues, there are a number of other downside risks to global growth in 2011. First, increases in oil prices, which, if sustained, could impact growth. At present, there is sufficient spare capacity for the impact on economic activity to be mild. Second, concerns surrounding the large funding requirements of sovereigns and banks, in particular in the eurozone periphery. Finally, housing markets in many countries remain weak.
3 Base effects are best explained using an example: if GDP is unusually low in year 1 but reverts to trend in year 2, GDP growth between years 1 and 2 will be high due to lower GDP in the base year rather than high GDP in the second year. If GDP remains at trend in year 3, GDP growth will be weaker between years 2 and 3 than it was between years 1 and 2.
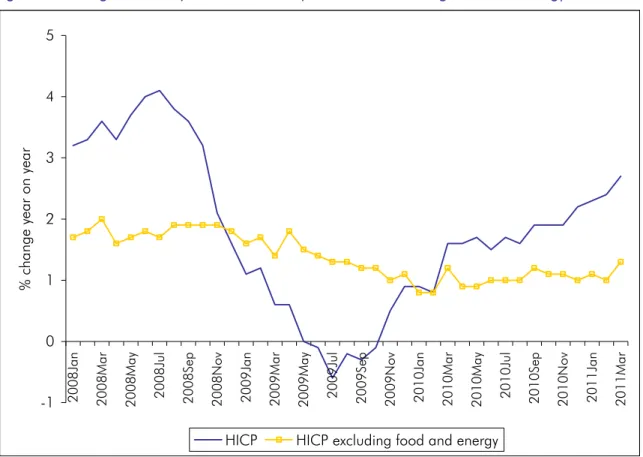
Inflation also remains an issue. Headline inflation is picking up due to rising commodity prices and increases in indirect tax and administered prices (see figure below). And more worryingly, inflation expectations have been rising; it will be a particular concern if this is a sign that they have
become de-anchored4. The nascent recovery requires monetary policy to remain accommodative
but at the same time it is important that price rises do not translate into ‘second round’ wage and price pressures – hence the importance that inflation expectations remain anchored. So far, underlying inflation remains under control due to excess capacity in labour and product markets – although beginning to decline, at a projected 8.5% in 2011 (IMF, 2011), unemployment remains high in the eurozone. Although the European Central Bank (ECB) decision to raise rates in April was generally regarded as a symbolic gesture to keep expectations anchored, rather than the start of a series of increases, there have been suggestions from influential sources, not least the new President of the Bundesbank, that it is time to return to ‘normal’ monetary policy. April’s increase, alongside rate increases in a number of other regions of the world, will restrain eurozone growth somewhat, particularly in the second half of the year.
Figure 3: Change in HICP (headline inflation) and HICP excluding food and energy5
-1 0 1 2 3 4 5 2008J an 2008M ar 2008M ay 2008 Ju l 2008Sep 2008N ov 2009J an 2009M ar 2009M ay 2009 Ju l 2009Sep 2009N ov 2010J an 2010M ar 2010M ay 2010 Ju l 2010Sep 2010N ov 2011J an 2011M ar % cha nge y ear o n y ear
HICP HICP excluding food and energy
Source: European Central Bank Statistical Database
4 For a discussion of the causal relationship between inflation and inflation expectations, see Kelly, R. (2008).
5 Consumer price inflation in the euro area is measured by the Harmonised Index of Consumer Prices (HICP). The HICP aims to be representative of the developments in the prices of all goods and services available for purchase within the euro area for the purposes of directly satisfying consumer needs. It measures the average change over time in the prices paid by households for a specific, regularly updated basket of consumer goods and services. For more information, please see:
Turning specifically to the eurozone, elevated bond yields in the periphery have shown that investor sentiment remains fragile. The response to address the region’s debt burden received a positive reaction when it was announced in February, however when the details of the package were revealed in March, there was disappointment. The measures were seen as lacklustre, and failed to provide a solution to the solvency crisis in the periphery. Following Greece and Ireland’s lead, in April Portugal became the third eurozone country to turn to the European Commission and IMF for assistance, in the face of unsustainable bond yields. Matters will become more serious on this front if Spain’s government and banks look to face difficulties in meeting their large financing needs in 2011.
3
Small business environment
3.1
Bank lending activity
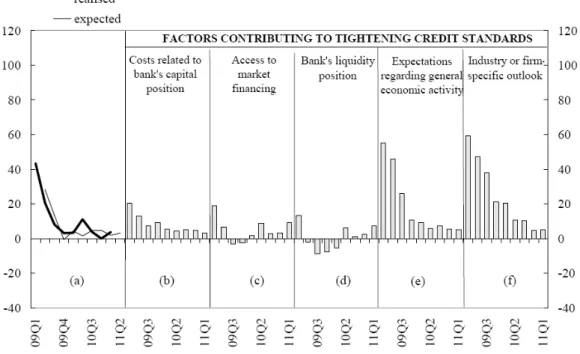
For information about the current status of bank lending, we use the latest ECB Bank Lending Survey (BLS), which reports changes during the first quarter of 2011 and expectations of changes in the second quarter (European Central Bank, 2011b). The survey was conducted on 124 euro area banks.
Figure 4: Changes in credit standards applied to the approval of loans or credit lines to enterprises6
Source: European Central Bank (2011a)
6 The figure shows net percentages of banks contributing to tightening standards; they are the difference between the sum of the percentages of banks responding “tightened considerably” and “tightened somewhat” and the sum of the percentages of banks responding “eased somewhat” and “eased considerably”. The net percentages for responses to questions related to the factors are defined as the difference between the percentage of banks reporting that the given factor contributed to a tightening and the percentage reporting that it contributed to an easing. “Realised” values refer to changes that have occurred, while “expected” values are changes anticipated by banks.
The survey reports a slight overall tightening of credit standards to non-financial corporations (NFCs) by Euro area banks; a net 4% of banks reported a tightening in Q1/2011, compared to 0% in the previous quarter. However, the banks reported that this tightening mostly affected large firms; the net figure for SMEs was 3% in both quarters. Credit standards on short term loans continued to be loosened, while those on long term loans were tightened, the latter on account of difficulties encountered in accessing market financing. Also a number of banks reported liquidity issues, and increased risk perceptions which caused them to tighten credit access.
In fact, although there was a feeling of tightening of credit standards, non-price terms and conditions reported by euro area banks were tightened less than in previous surveys. Margins on riskier loans were raised slightly, those on average loans were reduced.
On the demand side, 19% of banks reported an increase in demand for loans to NFCs in Q1/2011 compared to 10% in the previous quarter. The pick up appeared to reflect the overall economic recovery, being driven by a pick up in financing needs for inventories and working capital, and for the first time in two years, positive developments in fixed investments.
Looking forward, euro area banks expect a slight tightening of credit standards in the second quarter of 2011 (3% in net terms), which will primarily affect longer term loans. They anticipate that demand for corporate loans to continue to rise in Q2/2011, particularly for SMEs, and for short-term loans.
3.2
Access to finance
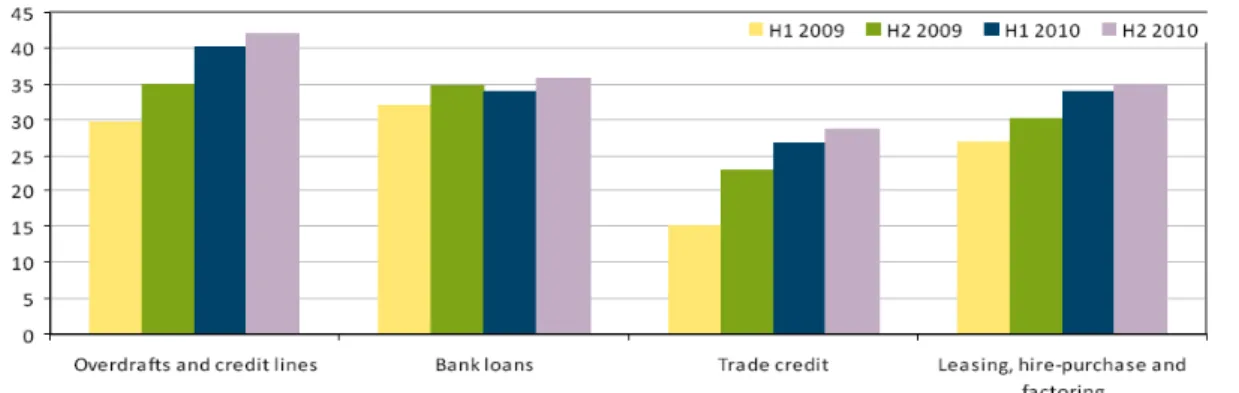
According to the ECB’s survey on the access to finance of SMEs in the euro area, covering September 2010 to February 2011 (European Central Bank, 2011b), there has been a slight increase in the percentage of SMEs using external sources of finance from all sources; in fact, as the figure below shows, the number of respondents using finance from all sources is higher than it has been at any time over the past two years. The increase has been particularly noticeable among larger SMEs.
Figure 5: Sources of external financing of euro area SMEs
(over the preceding six months; percentage of respondents)
Source: European Central Bank (2011b)
Encouragingly, according to the survey, the increase was driven both by demand side factors and improvements in availability. The latter is particularly welcome given the reluctance of lenders to extend credit since the financial crisis, and is a sure sign of the improving economic climate. In
terms of what is driving the demand for financing, the survey finds a pretty even split between financing fixed investment and financing inventory and working capital.
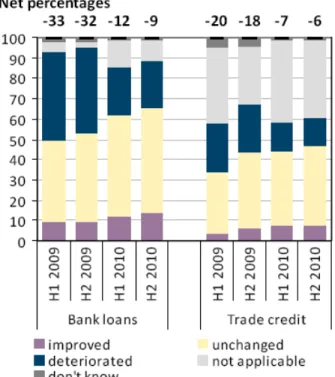
Overall, surveyed firms reported a moderate improvement in access to external financing sources, in particular bank loans. Figure 6 shows the difference between the number of SMEs that felt that access to bank loans and trade credit had deteriorated and those that thought access had improved.
Figure 6: Change in the availability of external financing for euro area SMEs (over the preceding six months; percentage of respondents)
Source: European Central Bank (2011b)
This is positive news, but it should be borne in mind that the figure of -9% means that it remains the case that more SMEs felt that access to bank loans had deteriorated than thought access had improved; the improvement is simply the fact that the gap between these two figures is not as great as it was previously. According to the survey, the main factors positively impacting availability of external finance were SMEs’ own capital positions and credit histories; general economic and firm-specific outlooks were still regarded as having a negative effect on credit availability and the supply of credit was judged to have remained unchanged.
Numbers of SMEs applying for bank loans remained relatively constant, at around 25%. Whilst the rejection rate remained similar to that of the previous period, at around 11%, the number of SMEs receiving the full amount they applied for continued to increase, reaching 66%. The terms on which loans were offered were reported to have deteriorated – more than half the sampled SMEs reported increases in interest rates charged and other costs of financing – however there was an improvement in the requirements related to collateral and loan covenants. The latter would reflect an expectation on the part of banks that credit risk has reduced somewhat, while the former would reflect increased demand and expectations of interest rate increases in the medium term, all of which are consistent with expectations of economic recovery.
From a geographical perspective, a higher proportion of firms in some countries, particularly Italy and Spain, reported a deterioration in the availability of internal funds as a reason for them to turn towards external financing. The survey results from Germany and Italy suggest an improvement in the availability of bank loans, while those from Spain and France suggested a continued deterioration in bank loan availability. Generally, firms in those countries reporting a deterioration associate it with a more negative assessment of the general economic and firm specific outlook.
3.3
Insolvencies
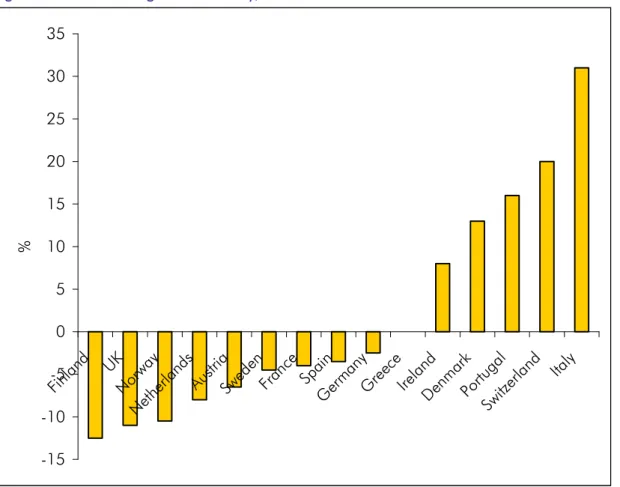
The gradual recovery in the global economy in 2010 saw the first fall in the Euler-Hermes Global Insolvency Index (EulerHermes, 2010), which analyses changes in business insolvency across the world, after two record years of increase. And it seems that at a European level, the economic recovery over the past year has been reflected in insolvency figures, which have been steadily falling. That said, the number of corporate insolvencies remains high, only 1.4% lower than the 10 year high recorded in 2009. And the overall picture hides some significant regional disparities, as indicated in the figure below.
Figure 7: Rate of change in insolvency, 2009-20107
-15 -10 -5 0 5 10 15 20 25 30 35 Finland UK Norwa y Neth erlan ds Austri a Swede n Franc e Spain Germ any Gree ce Irelan d Denm ark Portug al Switz erlan d Italy % Source: Creditreform (2011)
7 Please note that often national insolvency statistics are not completely comparable. For example, in some countries insolvent firms are less likely to initiate bankruptcy proceedings and opt instead for “voluntary” closures which are not included in the insolvency statistics.
Perhaps unsurprisingly, the number of corporate collapses increased in peripheral Europe, notably Italy, Ireland and Portugal, while the UK, the Netherlands and Scandinavia all recorded significant falls. There are some surprising results, for example the heavy increase in Switzerland, which is only partly explained by a technical legal change. Creditreform notes that it is often during an economic upturn that the weaknesses of many companies are exposed; and the difficulties encountered in obtaining business finance in 2010 meant that insolvencies did not fall as rapidly as the economic recovery might have led one to expect (Creditreform, 2011).
The continued economic recovery in 2011 should allow the decline in insolvencies experienced in 2010 to continue, although this will be tempered by the slowing in the rate of economic growth. It is likely that some countries with a difficult economic environment will continue to show (or in the case of Spain and Greece, start to show) heavy levels of insolvencies due to ongoing financial difficulties in the countries.
4
European private equity market
4.1
Investment activity
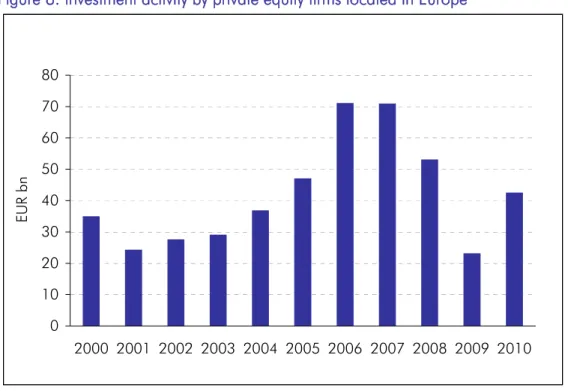
The statistics from EVCA indicate that there has been a strong recovery in overall private equity investment activity, with total investment amounting to EUR 39bn in 2010 compared to EUR 24bn in 2009.
Figure 8: Investment activity by private equity firms located in Europe
0 10 20 30 40 50 60 70 80 2000 2001 2002 2003 2004 2005 2006 2007 2008 2009 2010 EU R bn Source: EVCA
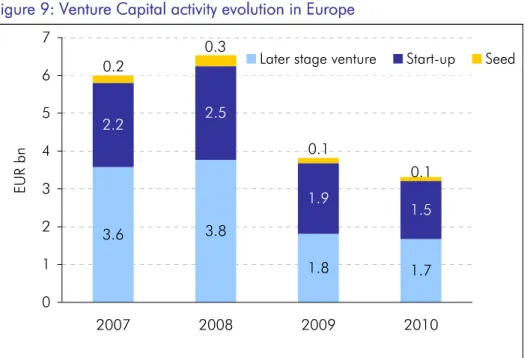
Although lower than in the boom years of 2006/2007, in fact this is not far off the EUR 41m average investment for the past decade. However, there is not much cause for cheer for the venture sector: the lion’s share of the increase in investment activity occurred in the buyout sector; at around EUR 3bn, venture investment was in fact slightly lower in 2010 than in 2009. Figure 9 shows that the decline has been fairly evenly spread across all stages of venture.
Figure 9: Venture Capital activity evolution in Europe 3.6 3.8 1.8 1.7 2.2 2.5 1.9 1.5 0.2 0.3 0.1 0.1 0 1 2 3 4 5 6 7 2007 2008 2009 2010 EU R bn
Later stage venture Start-up Seed
Source: EVCA
It is also interesting to note that the number of companies benefiting from PE investment was actually lower in 2010 than 2009: consequently the average investment almost doubled in size. Again this was driven by buyout activity: the average size of venture investments remained about the same. Of course one would expect trends in buyout activity to drive trends in overall investment activity, given its relative importance, but it is interesting to note the stability of venture activity compared to buyout, both in terms of overall amounts and size of investments. Figure 10 also seems to confirm the stability of venture, this time in terms of the sectors targeted. Life sciences, computer and consumer electronics remain the most important - followed by communications.
Figure 10: Venture investment by sector – 2010 versus 2007
0.0 0.5 1.0 1.5 Life Scien ce Compute r & cons. electroni cs Commun ications Energy & environm ent Business &
ind. prod ucts Consum er goods & retail Business & ind. se rvices Fin. servi ces Consum er service s: other Chemica ls & mate rials Transpor tation Construc tion EU R b n 2010 2007 Source: EVCA
Box 1: Business Angel activity
Business Angels are an important investor class in the field of equity finance. They tend to invest their own money directly in unquoted businesses, either alone or in a formal or informal syndicate. They differ from VC funds, who primarily invest funds granted to them by others (e.g. institutional investors). Typically companies that receive BA financing are smaller than VC backed companies. And are held for a shorter period – the median holding period for an investment is around four years for a profitable exit.
The economic climate of the past three years has seen an increase in business angel investment in early stage high growth companies as VC funds have migrated to less risky, later stage investments. They offer a number of advantages over VC:
They can make smaller investments as their transaction costs are lower;
They are more geographically dispersed, and stay closer to their markets;
They are very hands-on investors
There are potential difficulties in measuring the size of the Business Angel community, the main ones being identification and definition. Business angels have a desire for anonymity, and their investing tends to be undocumented. And there is nothing to stop an individual identifying themselves as a ‘virgin’ angel, yet they may never make an investment. Others may have acted as angels but are no longer actively looking to invest.
These difficulties must be borne in mind when describing the market. According to the European Business Angel Network (EBAN, 2010), the number of angel investors active both within networks and on an independent basis (individual activity or in syndicates) is estimated to be around 75k in Europe. In terms of overall investment, the amount invested by angels annually is EUR 4bn in the EU, although this has been impacted to a degree by the global financial crisis. Regarding size of investment, Business Angels, working together in syndicates, invest on average EUR 200k per deal in Europe, with individual angel investments ranging from EUR 15k to EUR 400k. Among angel networks in Europe, most (61%) investment is in early stage companies, with 21% going to seed and 13% going to expansion capital investments. There are almost 400 Business Angel networks in Europe (including Turkey and Russia), with around 17k investors; the median number of investors in a typical European business angel network is 79.
4.2
Fundraising activity
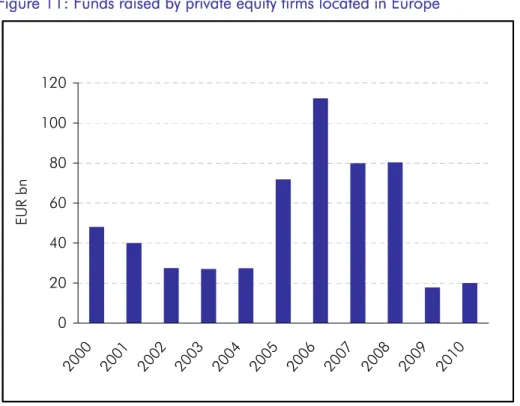
According to EVCA figures for 2010, fundraising remained in the doldrums in 2010, only fractionally above the sums raised in 2009. That said, the biggest falls have been in the buyout, growth and mezzanine sectors where funds raised in 2010 were 20% of the amounts raised in 2008; venture has seen less of a decline, albeit from a much smaller base. At EUR 3bn Funds raised in 2010 were around half the amount raised in 2008, and around the same level as funds raised in 2009.
Figure 11: Funds raised by private equity firms located in Europe 0 20 40 60 80 100 120 2000 2001 2002 2003 2004 2005 2006 2007 2008 2009 2010 EU R bn Source: EVCA
There are also indications that the average fund size has fallen considerably across all VC sectors (see figure below), and given evidence in previous studies that indicates that small fund size is one of the reasons for poor European venture capital performance (Kelly, 2011), this may be a cause for concern.
Figure 12: Average VC fund size
0 20,000 40,000 60,000 80,000 100,000 120,000 140,000 Early-Stage Later Stage Venture
Balanced All Venture
E
u
r'
000
2008 Average fund size 2009 Average fund size 2010 Average fund size
Having increased steadily since the onset of the crisis, there is evidence that the amount of time spent fundraising is coming down (see figure 13). There is a clear link between investor sentiment and the amount of time it takes to close a fund: thus the fact that funds closed in Q1/2011 had been on the road around 14 months is encouraging, as it indicates that the industry is heading back to where it was before the crisis.
Figure 13: Average time spent fundraising by funds to achieve a final close
0 5 10 15 20 25 2005 2006 2007 2008 2009 2010 Q1 2011 mo nt hs Source: Preqin
4.3
Divestment activity
Divestments increased by over 50% in 2010 compared to 2009 (see figure 14). This was wholly due to a pickup at the buyout end of the scale: in fact, at just over EUR 2bn, venture exits were 10% lower in 2010 than in 2009.
Figure 14: Divestments by private equity firms located in Europe
0 5 10 15 20 25 30 35 2000 2001 2002 2003 2004 2005 2006 2007 2008 2009 2010 EU R bn Source: EVCA
Some comfort can be taken from figure 15 which shows that write-offs are no longer the principal form of exit for private equity as a whole, as they were in 2009. Of course, the high proportion of write-offs in 2009 partly reflected the weak exit market at this time, in which only those forced to exit would do so. In fact this may also partly explain the lower divestment figure for venture in 2010 than 2009: write-offs were around half the level that they were in 2009; looking at non-write-off exits, venture divestment volumes by amount were about the same in 2010 as in 2009. Trade sales are also significantly lower in 2010, and most of the increase is seen in a surge in sales to other PE players. This is mainly accounted for by the pickup in the buyout market, in which this is a very popular form of exit. Trade sales remain the most important form of exit for venture, with over 35% of exits taking this form in 2010. Whilst 12% of venture exits were through a public offering, this is still far below the 23% in 2007, before the crisis took hold.
Figure 15: Divestment (by amount at cost divested)
0.0 5.0 10.0 15.0 20.0 25.0 30.0 35.0 40.0 Trade S ale Public Offe ring Write -Off Repa yment of Silent Partners hip Repayment of Pr incipal L oans Sale t o Ano ther PE Playe r Sale to Fina ncial I nstitut ion MBO Othe r Mean s % Overall exits 2009 Overall exits 2010 Venture exits 2010 Buyout exits 2010 Source: EVCA
4.4
Performance trends and outlook
The improving economic environment and the easier exit market mentioned above have both impacted on the short term performance of private equity funds, as measured in the one-year rolling IRR, which was 17.4% for venture in 2010.
However, looking at short term performance is not really relevant for private equity, which sells itself as a long-term asset class. If we look at the 3, 5, and 10 year returns, shown in figure 16, we get a better picture, and it is here that we can see the impact of the boom-bust investment periods that have characterised venture capital over the past decade. At 31 December 2010, the
3 year pooled IRR of European venture capital was 4.3%; and even at 10 years the IRR was -3.8%. Only at the 20 year horizon does the IRR become positive, and even then it is barely so, at a mere 0.3%.
Figure 16: Rolling horizon IRR European Venture Capital (in %)
-20.00 -15.00 -10.00 -5.00 0.00 5.00 10.00 15.00 20.00 25.00 30.00 1999 2000 2001 2002 2003 2004 2005 2006 2007 2008 2009 2010 3 years 5 years 10 years Source: EVCA
It is true that the performance of European venture has lagged that of the US, and that of European buyouts for a number of years now, and there are a number of possible explanations for this (see Kelly, 2011). What is eminently clear is that selection is key: ‘successful’ venture funds (i.e. those in the top quartile) have shown a remarkable resilience and strong performance, with top quartile venture funds reported a since inception pooled average IRR of 13.4% in 2010. Furthermore, there is evidence that performance in the US, at least on a 10 year IRR basis, has suffered more than performance in Europe. US VC returns have been on a sharp decline since the over-exuberance exhibited during the internet bubble, and since March 2010 US VC 10 year IRRs have been below those in Europe.
Figure 17: US and European PE performance-10-year net horizon IRRs (in %) -10.00 -5.00 0.00 5.00 10.00 15.00 20.00 25.00 30.00 35.00 40.00 19 99 20 00 20 01 20 02 20 03 20 04 20 05 20 06 20 07 20 08 20 09 20 10 VC - Europe PE - Europe VC - US PE - US
Source: Thomson Reuters/EVCA
In the medium term it is likely that the market will pick up – indeed there are already signs that this is occurring. However, in the longer term a stable funding base is necessary for such enterprises to flourish. This requires the venture capital industry to reach a critical mass, in other words a size that is sufficient for it to be able to function without the need for government intervention, as is arguably the case in the US.
5
European SME Securitisation
85.1
Market activity
9Over the past decade SME Loan Securitisation (SMESec) has become an important element of the financing of Small and Medium sized Enterprises in Europe with growing significance in some European markets such as Spain, Germany, the UK and Italy. However, the near-collapse of the European structured finance market, in tandem with the other markets around the globe more
generally, has profoundly affected the status and outlook of SMESec.10
Box 2: Contagion Effects
While there is no doubt that parts of the structured finance markets have significantly contributed to the financial and subsequently economic crisis worldwide, many asset classes within structured finance have performed relatively well. Whereas some areas such as subprime mortgages have been built on inflated asset prices, the market segment SMESec is suffering by and large from contagion effects – economically, but also with regard to the public perception.
Securitisation per se is not good or bad - it is a toolbox, an instrument, a technique. As such it is value-free; but its aggressive, opaque, and overly complex use has negative consequences for ultimately both issuers as well as investors. Negative repercussions are however also created by an overly simplified discussion where everything related to structured finance is lumped together and dismissed or branded as “toxic”, as sometimes stated in the press.
The instrument SMESec is neither “toxic” nor is the underlying asset (SME loans!) “toxic waste”. On the contrary – loans to SMEs are a key driver for the functioning of the economy and, properly applied, the securitisation technique is a replicable tool that can enhance access to finance for SMEs. Using this instrument in developed capital markets, public sector support for SMEs (e.g. guaranteeing mezzanine tranches) can create multiplier effects - and hence it is an efficient use of public resources, which is especially important against the background of a high public debt burden in many key countries. Policy makers need to withdraw from the expensive crisis-driven support measures and securitisation can help to cushion negative effects.
The European Structured Finance market grew steadily from the beginning of the decade until the outbreak of the crisis. In 2010, the total issuance was EUR 380bn, with the main activity in the Netherlands (around EUR 140bn) and UK (around EUR 100bn). In terms of volumes, the overall market is dominated by RMBS (see figure 18). In 2010, most of the total issuance (around 80%) was AAA, only 3% was rated BBB or below.
8 The reader can find a Securitisation glossary in Annex 2. 9 If not flagged otherwise, the data source is AFME/ESF.
10 For background information with regard to the importance of SME securitisation see: Kraemer-Eis et. al. (2010).
Figure 18: European Securitisation Issuance by collateral in 2010 (bn EUR) 31.3 29.5 6.1 271.7 36.9 4.5 ABS CDO CMBS RMBS SME WBS
Source: Based on data from AFME/ESF (2011)
With regard to the outstanding transactions the picture is similar (see figure 19). However, in terms of volumes, UK ranks first (almost 30% of the EUR 2,090bn), followed by the Netherlands (15%), Spain (14%) and Italy (10%). In terms of Moody’s ratings, 73% of the outstanding (rated by Moody’s) was AAA; 95% was investment grade and 5% was classified as non-investment grade (Ba or below).
Figure 19: European outstanding securitisation transactions (end of 2010, bn EUR)
Source: Based on data from AFME/ESF (2011
200.8 231.0 143.4 1,298.8 163.4 52.5 ABS CDO CMBS RMBS SME WBS
If we break down the EUR 163bn of outstanding SMESec by country (end of 2010), the picture shows the significance of the Spanish market:
Figure 20: European SMESec outstanding by country (end of 2010, bn EUR)
14.6 0.1 1.9 12.2 12.7 4.5 15.1 6.5 85.7 3.6 6.0 0.0 10.0 20.0 30.0 40.0 50.0 60.0 70.0 80.0 90.0 100.0 Belgiu m Finlan d France Germa ny
Greece Italy Netherla nds Portug al Spain UK Multin ation al bn E U R
Source: Based on data from AFME/ESF (2011)
During the crisis, issuance remained at high levels, but these volumes were almost exclusively driven by the eligibility of Asset Backed Securities (ABS) as collateral for European Central Bank
liquidity operations11. Also in 2010, most of the transactions have been retained for ECB
re-financing purposes (see figure 21). For the full year 2010 the retention was at around 78%. According to data from SIFMA, in Q1/2011, the picture was so far almost the same (on average 78% retention).
Figure 21: European securitisation issuance by retention (bn EUR)
0 20 40 60 80 100 120 140 160 180 2009 :Q1 2009 :Q2 2009 :Q3 2009 :Q4 2010 :Q1 2010 :Q2 2010 :Q3 2010 :Q4 Quarter bn EU R Retained Placed
Source: Based on data from AFME/ESF (2011)
11 The ECB’s asset repurchase or "repo" facility allows (among other assets) Asset Backed Securities to be used as collateral for funding.
SME securitisation has remained a relatively limited but important segment of the European structured finance market (between 6% and 16% of total yearly issuance during the decade), see figure 22 below.
Figure 22: SMESec volumes in Europe (SMESec and share of SMESec in total securitisation)
0 10 20 30 40 50 60 70 80 2001 2002 2003 2004 2005 2006 2007 2008 2009 2010 bn EU R 0 2 4 6 8 10 12 14 16 18 % o f total se curi tisati on
SMESec (lhs) Share of SMESec in Total Sec (rhs)
Source: authors, based on data from AFME/ESF and KfW
Following the year 2009 in which there was no the public placement of an SME transaction, in 2010 the SME securitisation market has shown some signs of reopening, with two benchmark
transactions successfully closed in UK and Germany12. However, the SME securitisation deal flow -
both in terms of number of transactions and volumes placed with market investors - is expected to remain well below pre-crisis levels for some time. According to data from SIFMA, European SME issuance in Q1/2011 was slightly stronger than in Q1/2010 (+ 16%), being in the area of EUR 15bn (SIFMA, 2011).
5.2
Performance trends and outlook
Figure 23 shows cumulative credit events (or defaults) on original balance by vintage. It mirrors
the bad performance of 2006 vintages.
12 In both cases EIF played a key role in facilitating the placement of the notes and thus supporting the re-launching of effective fund raising through securitisation for bank originators and their SME debtors.
Figure 23: EMEA ABS SME cumulative credit events or defaults on original balance (seasoning by vintage; January 2011)13
-0.50 1.00 1.50 2.00 2.50 3.00 3.50 4.00 1 3 5 7 9 11 13 1517 19 21 23 2527 29 31 33 3537 39 41 43 4547 49 51 53 5557 59 Months Since Closing
C um ul ati ve D ef aul ts [% of OB ] 2000 2001 2002 2003 2004 2005 2006 2007 2008 2009
Source: Moody's Investors Service, Moody's Performance Data Service, periodic investor/servicer reports
During the crisis there was a wave of downgrades in SMESec transactions. There were 4 main reasons for this development:
Impact of general economic downturn
Changes in the rating methodologies of the Rating Agencies (without grandfathering),
Spain is historically a strong SME securitisation market and has gone into a severe recession,
and
Fourthly, there are non-typical SMESec transactions (i.e. the already mentioned German
Mezzanine CDOs) that have suffered significantly and have featured the most severe downgradings.
Similar to 2009, also in 2010 almost half of the Moody’s downgrades were concentrated in SMESec transactions and the sector had the largest share in all downgrades (21% of the in total 299 downgrades of EMEA CDOs, much higher than its proportion in outstanding ratings). For example, the Moody’s 12-month downgrade rate for EMEA SME CLOs was in 2009 at 84.5%,
13 The “EMEA region” includes Europe, Middle East, and Africa; with regard to Structured Finance most of the transactions in this region are in Europe. There is a cut off after five years of seasoning. These vintage seasoning charts might move unexpectedly for the last few data points. This is because transactions start at different points in time within a vintage and therefore some transactions may be more seasoned than others. For example, as of Q4/2009, a transaction with a closing date in January 2008 would have been 23 months seasoned, whereas a transaction closed in December 2008 would only be 12 months seasoned. As Moody’s uses the latest data point up to the maximum seasoning of a vintage for terminated transactions, this effect should decline over time and explains the different behaviour of the last few data points.
and for 2010 still on 57.7%; the historical average is at 28% (Moody’s (2011).14
The latest available rating transition data shows that the continued downgrade pressure is across
all tranche levels. The following example shows a most recent 1-year transition matrix.15
Table 1: Moody’s 1 year EMEA CLO SME rating transitions (29.04.2010-29.04.2011)
ENDING RATING
Aaa Aa A Baa Ba B Caa Ca/C WR
# Tr. Wgtd Notch Δ Aaa 66.7% 22.2% 11.1% 9 -1.1 Aa 25.0% 25.0% 25.0% 25.0% 12 -4.3 A 21.4% 28.6% 21.4% 14.3% 7.1% 7.1% 14 -4.8 Baa 16.7% 33.3% 33.3% 16.7% 12 -4.6 Ba 20.0% 40.0% 40.0% 10 -4.1 B 60.0% 40.0% 10 -4 Caa 42.1% 57.9% 19 -1.5 STA RT RA TING Ca/C 100% 13 -0.4 # Tranches 6 5 7 9 12 10 21 28 1 99 -3
Source: Moody's Investors Service, CLO and CDO Quick Check.
Currently the SMESec market remains difficult despite some promising first attempts to revive the asset class. In general, a continuation of the gradual recovery of the European Structured Finance market is expected, however this will not only depend on the development of market fundamentals and the enhancement of investors’ confidence but also strongly on the direct and indirect impact from regulatory preferences.
At the moment, the precise effects of the regulatory adjustments on the securitisation are not yet clear, but the reforms, i.e. with regard to Basel III, Capital Requirements Directive (CRD), and Solvency II are going to impact the securitisation market. On the supply side, for example, the CRD2 amendments will require originators to keep a minimum of 5% of the net economic interest a portfolio (retention rule). Moreover, CRD 2 and 3 require additional disclosure of information (for both, investor and originator) and impose requirements to perform rigorous assessments of their positions on an ongoing basis. Other examples are the specific CRD3 rules for securitised products held in the trading book and future liquidity ratio regulation, which might shift demand
from the securitisation market to the covered bond markets (European Central Bank, 2011a).
Other important securitisation investors, like insurance companies and pension funds, are also impacted by Solvency II. According to the ECB, market commentators say that the ABS related Solvency II rules might make it less attractive for these investor classes to invest in ABS - and instead in more attractive covered bonds, bank floating rate notes or senior unsecured bonds (European Central Bank, 2011a).
14 The downgrade (upgrade) rate is the number of securities downgraded (upgraded) divided by the total number of outstanding securities at the beginning of the time period. If we focus on the highest classes, among all AAA-downgrades in Europe in 2010, Deutsche Bank (Deutsche Bank, 2011a and 2011b) registered a share of 7% for SME CDOs in Europe (top: leveraged loan CDOs 62%, prime ABS 12%). In 2011 so far (year-to-date data, 10.05.2011), this share for SME transactions remained the same (7%; top: prime RMBS: 73%, CMBS: 11%).
15 Example: Of the 9 AAA rated transactions at the beginning of the period where 66.7% still AAA-rated at the end of the period, 22.2% have been downgraded to Aa and 11.1% have been downgraded to A.
Investors will only return in volume if they regain trust in the quality of the transactions and if there is satisfactory secondary market liquidity. Originators will return if transactions are economically feasible. For both, a stable and reliable regulatory framework is a key precondition as well. Moreover, improved transparency is going to be important. In this context, the ECB intends to establish a loan-by-loan level data warehouse to process, verify and distribute standardised securitisation information to market participants. Following the general decision announced on 16.12.2010 to establish loan-by-loan information requirements for ABSs in the Eurosystem collateral framework, the Governing Council of the ECB intends to introduce these requirements for SME transactions accepted in the Eurosystem collateral framework within a timeframe of 1.5 years. Loan-level data for this asset class will be provided in accordance with the templates available on the ECB’s website. The Eurosystem will continue to accept securities not meeting the new information requirements until the obligation to submit loan-level data comes into force (European Central Bank, 2011d).
Going forward, it may be expected that SME securitisation (excluding pure ECB-related transactions) will mostly restart from the more sophisticated markets, i.e. in the “traditional” countries (UK, Germany, Benelux, Italy etc.). Poland and Turkey have significant potential as they both exhibit strong fundamentals (i.e. critical mass, important domestic/SME market, potential economic growth due to catching-up effect with the neighbouring countries, securitisation laws in place), which would make securitisation an efficient tool for banks to meet the growing domestic credit demand.
6
Microfinance
SMEs constitute the majority of all European companies, irrespective of national boundaries. The majority of these companies are micro enterprises; in the EU-27, 91% of the companies have less than 10 employees. The ability of a financial system to reach such small entities is crucial for the achievement of general socio-economic improvement. Against this background and the fact, that microfinance is for EIF an emerging business line, we present here as well a chapter on this important topic. However, we are not going to explain in general microfinance in Europe here.
Compared to the microfinance markets in South Asia, South America or Africa, the European
microfinance market is a young, highly heterogeneous but growing market segment, notably in new Member States and some western countries, usually when the regulatory framework is conducive to this activity, with micro-credit institutions aiming at self sustainability, increased micro-lending capacity and, in some cases, transformation into banks. For more details on the
general overview we refer e.g. to Kraemer-Eis and Conforti (2009).16
The results of the latest regular EMN survey amongst microfinance actors17 in Europe provide a
picture of the market (Jayo et al, 2010):
Typically, microfinance is provided by either
small organisations or bigger organisations (where microfinance represents only a small part of the overall activities).
57% of the microfinance organisation
provided less than 50 loans in 2009 (typically in France, Germany, Spain); only 13% provided more than 400 loans (Eastern Europe, i.e. Bulgaria, Hungary, Romania, Poland).
Microloan sizes vary between EUR 220 and
EUR 37k18 with banks, non bank financial
institutions and government bodies offering larger loans than credit unions, NGOs, savings banks and foundations.
There is a tendency of cross selling as around
50% of respondents offering other financial services to their microfinance clients (debt counselling, savings, insurance, mortgages, money transfer).
The most pressing problem for the microfinance provider is the lack of access to long-term
funding.
16 For an overview at national level, please visit:
http://www.european-microfinance.org/microfinance-par-pays_en.php
17 Development agencies, microbanks, banks (incl. savings banks, and cooperative banks), and non-bank financial institutions.
18 Although strictly speaking the latter is not anymore a microloan.
Box 3: What is “micro”?
Microcredit is defined by the European Commission, as a loan
or lease under € 25,000 to support
the development of self-employment and micro-enterprises. It has a double impact: an economic impact as it allows the creation of income generating activities and a social impact as it contributes to the social inclusion and therefore to the financial inclusion of individuals.
A Microenterprise is any enterprise with less than 10 employees and a turnover under EUR 2 million (as defined in the Commission Recommendation 2003/361/EC of 6 May 2003, as amended).
According to the survey, there is also diversity with regard to the final beneficiaries: many providers target people excluded from mainstream financial services (47% of respondents of the survey) and women (44%); moreover ethnic minorities and/or immigrants (41%), youth (29%) and disabled people (21%) are amongst the top ranks.
These priorities show the high social focus of microfinance in Europe, sometimes referred to as the two sides of the microfinance coin. The causes and consequences of financial exclusion can contribute to social exclusion. Those unable to access finance for enterprise creation/development have greater difficulty in integrating into the financial system. This can affect their participation to mainstream social activities and those events specific to their cultural reference group.
MFIs have been affected by the adverse macro-economic conditions during the recent crisis, generally through significantly higher bad debt rates among their clients and in some cases through increased difficulties in accessing external sources of funding. According to the latest CSFI microfinance survey (CSFI, 2011), the immediate risks for the microfinance industry, posed by the global economic crisis, have receded. However, these risks have been replaced by larger concerns abut the future direction of the microfinance industry. I.e. the fast growing problem of overindebtedness of microfinance customers (and consequently a potential for large microfinance loan losses) are going to impact the microfinance industry in some parts of the world directly, and indirectly (via reputation issues). Main reasons behind this development are widely seen to be the increased intensity of competition in the microloan markets combined with institutional weaknesses (CSFI, 2011). However, these concerns are mainly related to the traditional microfinance markets (i.e. developping countries) and to a lesser extend to the emerging microfinance markets in Europe.
The target group for microfinance, namely the financially excluded but economically active, is faced with tightening credit supply by mainstream banks due to higher risk aversion and de-leveraging balance sheets. This creates an opportunity for microfinance, but also underlines the paramount importance of credit risk management in an industry that, in Western Europe at least, continues to be driven by socially motivated investors and entities providing microfinance as part of their social responsibility initiatives. This has a significant impact on the pricing of financing instruments to such type of entities, sometimes undermining the development of viable microfinance models in terms of self-sustainability. Hence, the impact of the crisis further increases the market failure and underlines the need of public support for the emerging microfinance sector in Europe.19
Figures 24 and 25 below show two indicators of social welfare. The first shows the unemployment rate against the long term unemployment rate – it is clear that the unemployment rate is currently significantly higher than the long term rate in all the countries for which data is available, in the aftermath of the financial crisis and ensuing recession. In particular the incidence of Eastern European countries towards the right hand side of the chart (with higher long term unemployment)
19 Standardised, regularly available indicators to explain market developments for microfinance in Europe do not yet exist, or focus on Eastern Europe. The Economist Intelligence Unit’s analyses the business environment for microfinance, but focuses on developing countries. Eurostat’s primary and secondary indicators for social inclusion provide an overview over the framework conditions for microfinance. However, this topic is too broad to be covered in such a brief market overview. The indicators can accessed here: http://epp.eurostat.ec.europa.eu/portal/page/portal/statistics/search_database
is noticeable, and this is in part why there is a tendency for microfinance to be for social purposes in this region. Of course, there are some surprising exceptions, for example Romania, however this is likely to be due to the generally larger size of the informal economy in countries of Eastern Europe, and the less widespread incidence of benefits, making people less likely to register as unemployed.
Figure 24: Unemployment rate (long term and annual average)
0.0 5.0 10.0 15.0 20.0 25.0 Norwa y Austria Neth erlan ds Cypru s Luxe mbour g DenmarkSw eden FinlandRoman
ia Unite d King domTurkey Czec h Repu blic PolandMal ta German y* Slove nia Fran ce Belgiu m Italy Bulgar ia Croat ia Hungar y GreecePortu
gal Irelan d Spain Lithu ania Estoni a Latvia Slova kia % Unemployment rate
(long term average) Unemployment rate
Source: Eurostat
*incl. former GDR from 1991
Figure 25 shows the share of persons with an equivalised disposable income below the risk-of-poverty threshold in the current year (in this case 2009) and in at least two of the preceding three years. The threshold is 60% of the national median equivalised disposable income. This is a standard measure to show the proportion of the population who are impoverished on a persistent basis. Again, we see that it is Eastern Europe where the incidence of persistent poverty is greatest, although the difference between the EU15 and EU27 figure is relatively small.
Figure 24: Persistent at-risk of poverty rate 0 5 10 15 20 25 30 35 40 45 50 Iceland Czech Repu blic Netherl ands Norwa y Swed en Finla nd Austri a Sloveni a Switze rland Denma rk Luxem
bourgFrance SlovGermaakia
ny BelgiumMal ta EU 1 5 United King domCyprusEU 27 Eston ia SpainItaly Portu gal Irelan d Greec e Polan d Lithua nia HungaryLatv ia Roma nia Bulga ria
%
Source: Eurostat7
Concluding remarks
We showed above that there are significant challenges for the financing of small business. Overall, and in addition to traditional structural issues, small business finance is still suffering from the repercussions of the financial crisis.
In this context, public support is very important but it is also important to realise that public support cannot be the only solution – it needs to play a catalytic role to attract private finance, to crowd-in private investors.
It is a key priority for the EIF to help establish a well functioning, liquid equity market that attracts a wide range of private sector investors, and develop new and pioneering financing instruments in order to reach to parts of the market currently not accessible through EIF’s existing instruments. The objective is to leverage EIF’s activity and seize market opportunities in all areas of the equity eco-system which are relevant for the sustainable development of the industry.
With regard to the securitisation market, the revitalization and further development of SMESec is
pivotal for the future growth of SME financing. Properly applied SMESec can enhance access to finance for SMEs and it is a replicable tool for SME support that provides a multiplier effect; i.e.
the investing in/guaranteeing of relatively small (mezzanine) tranches facilitates the securitisation of much higher volumes and is as such an efficient way of deploying public sector support.
Microfinance is a crucial tool to overcome the effects of the financial crisis and to support inclusive
growth and EIF provides providing funding, guarantees and technical assistance to a broad range of financial intermediaries, from small non-bank financial institutions to well established microfinance banks to make microfinance a fully-fledged segment of the European financial sector.
ANNEX
Annex 1: PE Glossary
(selection, from EVCA) Buyout: A buyout is a transaction financed by a mix of debt and equity, in which a business, a business
unit or a company is acquired with the help of a financial investor from the current shareholders (the vendor). See management buyout (MBO), management buyin (MBI), institutional buyout (IBO), leveraged buyout (LBO).
Buyout fund: Funds whose strategy is to acquire other businesses; this may also include mezzanine debt
funds which provide (generally subordinated) debt to facilitate financing buyouts, frequently alongside a right to some of the equity upside.
Capital weighted average IRR: The average IRR weighted by fund size.
Captive Fund : A fund in which the main shareholder of the management company contributes most of
the capital, i.e. where parent organisation allocates money to a captive fund from its own internal sources and reinvests realised capital gains into the fund.
Carried interest: A share of the profit accruing to an investment fund management company or
individual members of the fund management team, as a compensation for the own capital invested and their risk taken. Carried interest (typically up to 20% of the profits of the fund) becomes payable once the limited partners have achieved repayment of their original investment in the fund plus a defined hurdle rate.
Closing: A closing is reached when a certain amount of money has been committed to a private equity
fund. Several intermediary closings can occur before the final closing of a fund is reached.
Commitment: A limited partner’s obligation to provide a certain amount of capital to a private equity
fund when the general partner asks for capital.
Deal flow: The number of investment opportunities available to a private equity house.
Disbursement: The flow of investment funds from private equity funds into portfolio companies.
Distribution: The amount disbursed to the limited partners in a private equity fund.
Divestment: See exit.
Drawdown: When investors commit themselves to back a private equity fund, all the funding may not be
needed at once. Some is used as drawn down later. The amount that is drawn down is defined as contributed capital.
Early stage: Seed and start-up stages of a business.
Early stage fund: Venture capital funds focused on investing in companies in the early part of their lives.
Exit: Liquidation of holdings by a private equity fund. Among the various methods of exiting an
investment are: trade sale; sale by public offering (including IPO); write-offs; repayment of preference shares/loans; sale to another venture capitalist; sale to a financial institution.
Expansion capital: Also called development capital. Financing provided for the growth and expansion
of a company, which may or may not break even or trade profitably. Capital may be used to: finance increased production capacity; market or product development; provide additional working capital.
Follow-on investment: An additional investment in a portfolio company which has already received
funding from a private equity firm.
Fund: A private equity investment fund is a vehicle for enabling pooled investment by a number of
investors in equity and equity-related securities of companies (investee companies). These are generally private companies whose shares are not quoted on any stock exchange. The fund can take the form either of a company or of an unincorporated arrangement such as a limited partnership. See limited partnership.
Fund of Funds: A fund that takes equity positions in other funds. A fund of fund that primarily invests in
new funds is a Primary or Primaries fund of funds. One that focuses on investing in existing funds is referred to as a Secondary fund of funds.
Fundraising: The process in which venture capitalists themselves raise money to create an investment fund. These funds are raised from private, corporate or institutional investors, who make commitments to the fund which will be invested by the general partner.
General Partner: A partner in a private equity management company who has unlimited personal
liability for the debts and obligations of the limited partnership and the right to participate in its management.
General Partner’s commitment: Fund managers typically invest their personal capital right alongside
their investors capital, which often works to instil a higher level of confidence in the fund. The limited partners look for a meaningful general partner investment of 1% to 3% of the fund.
Generalist fund: Funds with either a stated focus of investing in all stages of private equity investment,
or funds with a broad area of investment activity.
Holding period: The length of time an investment remains in a portfolio. Can also mean the length of
time an investment must be held in order to qualify for Capital Gains Tax benefits.
Horizon IRR: The Horizon IRR allows for an indication of performance trends in the industry. It uses the
fund’s net asset value at the beginning of the period as an initial cash outflow and the Residual Value at the end of the period as the terminal cash flow. The IRR is calculated using those values plus any cash actually received into or paid by the fund from or to investors in the defined time period (i.e. horizon).
Hurdle rate: A return ceiling that a private equity fund management company needs to return to the
fund’s investors in addition to the repayment of their initial commitment, before fund managers become entitled to carried interest payments from the fund.
Inception: The starting point at which IRR calculations for a fund are calculated; the vintage year or
date of first capital drawdown.
Institutional investor: An organization such as a bank, investment company, mutual fund, insurance
company, pension fund or endowment fund, which professionally invest, substantial assets in international capital markets.
Internal rate of return (IRR): The IRR is the interim net return earned by investors (Limited Partners), from
the fund from inception to a stated date. The IRR is calculated as an annualised effective compounded rate of return using monthly cash flows to and from investors, together with the Residual Value as a terminal cash flow to investors. The IRR is therefore net, i.e. after deduction of all fees and carried interest. In cases of captive or semi-captive investment vehicles without fees or carried interest, the IRR is adjusted to created a synthetic net return using assumed fees and carried interest.
IPO (Initial public offering): The sale or distribution of a company’s shares to the public for the first
time. An IPO of the investee company’s shares is one the ways in which a private equity fund can exit from an investment.
Later stage: Expansion, replacement capital and buyout stages of investment.
Leverage buyout (LBO): A buyout in which the NewCo’s capital structure incorporates a particularly
high level of debt, much of which is normally secured against the company’s assets.
Limited Partnership: The legal structure used by most venture and private equity funds. The partnership
is usually a fixed-life investment vehicle, and consists of a general partner (the management firm, which has unlimited liability) and limited partners (the investors, who have limited liability and are not involved with the day-to-day operations). The general partner receives a management fee and a percentage of the profits. The limited partners receive income, capital gains, and tax benefits. The general partner (management firm) manages the partnership using policy laid down in a Partnership Agreement. The agreement also covers, terms, fees, structures and other items agreed between the limited partners and the general partner.
Management fees: Fee received by a private equity fund management company from its limited
partners, to cover the fund’s overhead costs, allowing for the proper management of the company. This annual management charge is equal to a certain percentage of the investors’ commitments to the fund.
Mezzanine finance: Loan finance that is halfway between equity and secured debt, either unsecured or
with junior access to security. Typically, some of the return on the instrument is deferred in the form of rolled-up payment-in-kind (PIK) interest and/or an equity kicker. A mezzanine fund is a fund focusing on
Multiples or relative valuation: This estimates the value of an asset by looking at the pricing of “comparable” assets relative to a variable such as earnings, cash flows, book value or sales.
Pooled IRR: The IRR obtained by taking cash flows from inception together with the Residual Value for
each fund and aggregating them into a pool as if they were a single fund. This is superior to either the average, which can be skewed by large returns on relatively small investments, or the capital weighted IRR which weights each IRR by capital committed. This latter measure would be accurate only if all investments were made at once at the beginning of the funds life.
Portfolio company: The company or entity into which a private equity fund invests directly.
Pre seed stage: The investment stage before a company is at the seed level. Pre-seed investments are
mainly linked to universities and to the financing of research projects, with the aim of building a commercial company around it later on.
Private Equity: Private equity provides equity capital to enterprises not quoted on a stock market. Private
equity can be used to develop new products and technologies (also called venture capital), to expand working capital, to make acquisitions, or to strengthen a company’s balance sheet. It can also resolve ownership and management issues. A succession in family-owned companies, or the buyout and buyin of a business by experienced managers may be achieved by using private equity funding.
Private Equity Fund: A private equity investment fund is a vehicle for enabling pooled investment by a
number of investors in equity and equity-related securities of companies. These are generally private companies whose shares are not quoted on a stock exchange. The fund can take the form of either a company or an unincorporated arrangement such as a Limited Partnership.
Quartile: The IRR which lies a quarter from the bottom (lower quartile point) or top (upper quartile
point) of the table ranking the individual fund IRRs.
Rounds: Stages of financing of a company. A first round of financing is the initial raising of outside
capital. Successive rounds may attract different types of investors as companies mature.
Secondary investment: An investment where a fund buys either, a portfolio of direct investments of an
existing private equity fund or limited partner's positions in these funds.
Seed stage: Financing provided to research, assess and develop an initial concept before a business
has reached the start-up phase.
Start-up: Companies that are in the process of being set up or may have been in business for a short
time, but have not sold their product commercially.
Target company: The company that the offeror is considering investing in. In the context of a
public-to-private deal this company will be the listed company that an offeror is considering investing in with the objective of bringing the company back into private ownership.
Top Quarter: Comprises funds with an IRR equal to or above the upper quartile point.
Track record: A private equity management house’s experience, history and past performance.
Venture Capital: Professional equity co-invested with the entrepreneur to fund an early-stage (seed and
start-up) or expansion venture. Offsetting the high risk the investor takes is the expectation of higher than average return on the investment. Venture capital is a subset of private equity.
Venture Capitalist: The manager of private equity fund who has responsibility for the management of
the fund’s investment in a particular portfolio company. In the hands-on approach (the general model for private equity investment), the venture capitalist brings in not only moneys as equity capital (i.e. without security/charge on assets), but also extremely valuable domain knowledge, business contacts, brand-equity, strategic advice, etc.
Vintage year: The year of fund formation and first drawdown of capital.
Volatility: The volatility of a stock describes the extent of its variance over time.
Write-off: The write-down of a portfolio company’s value to zero. The value of the investment is