SHARE Boston BOF @Lunch & Learn August 2, 2010
Performance and Capacity
Management Best Practices
Ivan Gelb, GIS Corp. Phone:732-303-1333
© 2010 Gelb Information Systems Corp. - www.gelbis.com 2
Think Fasterwith Gelb Information
TRADEMARKS
The following are trade or service marks of the IBM
Corporation: CICS, CICS TS , CICSPlex, DB2, IBM, MVS, OS/390, z/OS, Sysplex, Parallel Sysplex. Any omissions are purely unintended.
© 2002-10 Gelb Information Systems Corp. URL: www.gelbis.com
Phone: 732-303-1333
No part of this material can be reproduced by any means without prior written permission from the author and with proper attribution displayed.
MOTHER OF ALL DISCLAIMERS (MOAD )
All of the information in this document is tried and true.
However, this fact alone cannot guarantee that you can get the same results at your place and with your skills. In fact, some of this advice can be hurtful if it is misused and
misunderstood. As with all kinds of analysis, anything you may hear or read can be understood and misunderstood in many ways that may seem contradictory to you. Gelb
Information Systems Corporation, Ivan Gelb and any one found anywhere assume no responsibility for this
information’s accuracy, completeness or suitability for any purpose. Anyone attempting to adapt these techniques to their own environments anywhere do so completely at their own risk.
© 2010 Gelb Information Systems Corp. - www.gelbis.com 4
Think Fasterwith Gelb Information
Agenda
Best Practices
Critical Success Factors
Selected “Hot Topics”
Q & A Anytime
Ask your questions at any time for best results today.
© 2010 Gelb Information Systems Corp. - www.gelbis.com 6
Think Fasterwith Gelb Information
Best Practices / Recommendations - 1
Always communicate with management in
common business terms: orders, deliveries,
customers served, and effect on total cost.
Always avoid technical jargon and acronyms
when communicating with business people.
“Good For ALL” Report Example
Best: “Capacity of our
configuration increased
from 100 to 123
orders/second without
any increase in
spending.”
Very Good: “The order
entry application can
handle 23% more
volume without any
increase in spending.”
0 50 100 150 Before AfterProject Results
Orders/Sec© 2010 Gelb Information Systems Corp. - www.gelbis.com 8
Think Fasterwith Gelb Information
Best Practices / Recommendations - 2
Service Level Agreements (SLA) are the
foundation for effective Capacity Planning (CP)
and Performance Management (PM).
“Say no more. Say no more. Wink, wink.”
*One of the Monthy Python Characters
The SLA’s three key statements:
Service level,
Stated business activity level, and
Best Practices / Recommendations - 3
Effective Capacity Planning (CP) and
Performance Management (PM) will yield
required service level quantity and quality for
least total cost.
Design WLM service policy to mirror
business activity – this enables the most
effective CP & PM activities. You will know
when you need to do something, and what you
may need to pay closer attention to.
© 2010 Gelb Information Systems Corp. - www.gelbis.com 10
Think Fasterwith Gelb Information
Best Practices / Recommendations - 4
Given less time and more data to analyze,
choose your tools and techniques so
YOUR
effectiveness is improved
Practice routinely scheduled z/OS Workload
Manager (WLM) service policy health checks.
Ask:
“Is it still working as intended?”
Best Practices / Recommendations - 5
Choose tools and techniques that enable
analysis of each workload independently and in
combination with present and future workloads
For capacity planning studies, insure that you
isolate workloads not just along business
importance but also based on key attributes that
affect scalability: physical disk I/O intensity,
virtual storage needs, use of z/OS services,
total CPU time in applications code, network
services, etc...etc…
© 2010 Gelb Information Systems Corp. - www.gelbis.com 12
Think Fasterwith Gelb Information
My Favorite Tools
Free (i.e. zPCR)
Recycled from…
Borrowed for free
Critical Success Factors (CSF)
The enablers
Business services mapped to all IT components
Business data
Technical data
Service Level Agreements (SLA)
Known IT Total Cost of Ownership (TCO)
Established value of IT services
© 2010 Gelb Information Systems Corp. - www.gelbis.com 14
Think Fasterwith Gelb Information
The Enablers
Leadership (and the politics of it all)
People with skills
Governance
Tactical plans
Strategic plans
Resources
Technical Enablers
Complete synergy between all IT Service
Management (ITSM) components
Symbiotic relationships among:
Quality assurance / Change management
Load /Stress testing
Performance management
Capacity planning
Finance
© 2010 Gelb Information Systems Corp. - www.gelbis.com 16
Think Fasterwith Gelb Information
Business and Technical Data
Current and planned business activity
IT services metrics / business unit of work
collected during critical periods of activity:
Processor
Disk I/O
All other I/O
Required SLA
Required Service Level Objectives (SLO) to
meet the SLA
© 2010 Gelb Information Systems Corp. - www.gelbis.com 18
Think Fasterwith Gelb Information
Selected “Hot Topics”
Variable Workload License (VWLC) Charging
z/OS Workload Manager (WLM)
PR/SM Considerations
Variable Workload License
(VWLC) Charging Method
for Software
Audience Poll:1. Sub-capacity licensed now with IBM? 2. Sub-capacity licensed now with other
© 2010 Gelb Information Systems Corp. - www.gelbis.com 20
Think Fasterwith Gelb Information
VWLC Overview - 1
Variable workload license (VWLC) charging
method available in USA since March 2001 for
selected IBM software products. Examples: z/OS,
COBOL, CICS, DB2, CICS, IMS, MQSeries plus
over 25 more
Started sub-capacity software licensing trend
Software license capacity can be dramatically
lower than installed hardware capacity.
Concept moving ahead very slowly, or not at all, in
the independent software vendors’ (ISV) world.
VWLC Overview - 2
Basis for sub-capacity of VWLC products is LPAR
utilization
Monthly charge based on highest rolling 4 hour
average by product summed for LPARs w. software present in them
Product isolation into LPARs for software capacity
planning is a potentially cost saving activity
5 – 15% monthly software cost savings are possible
LPAR’s total capacity may be capped via PR/SM to
© 2010 Gelb Information Systems Corp. - www.gelbis.com 22
Think Fasterwith Gelb Information
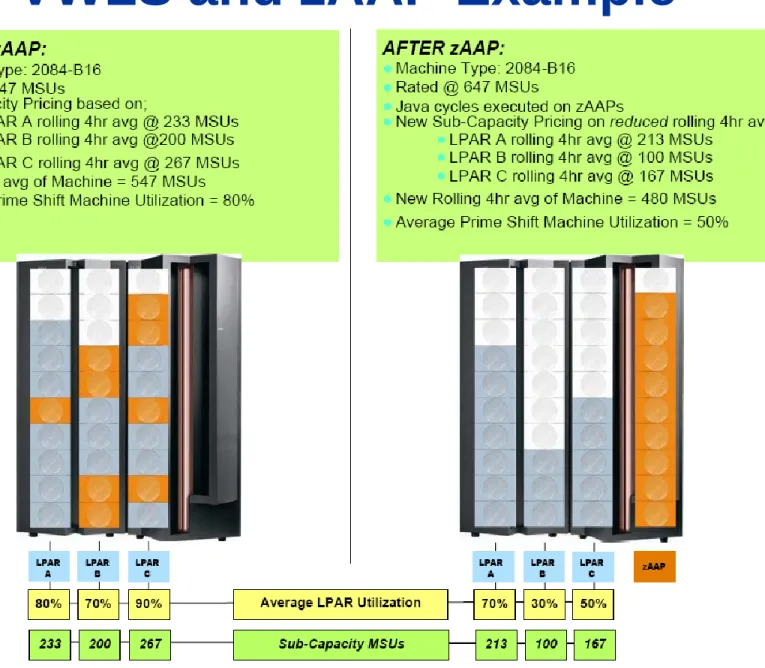
VWLS and zAAP Example
Workload Manager
(WLM)
Audience Poll:
1. Does WLM Goal mode deliver the service levels you hoped for, and protect the most important work?
2. Do you schedule WLM service policy “checkups” at regular interval, or you wait until…..you must!
© 2010 Gelb Information Systems Corp. - www.gelbis.com 24
Think Fasterwith Gelb Information
WLM Advice - 1
Recommendation
: Create service
classes aligned with the business
importance of the work within them.
Example
: A service class can be, and we
recommend that it should be, a single
WLM Advice - 2
Recommendation
: Create resource
groups for any workload you wish to
control regardless of processor utilization
level.
Example
: Service class can be limited to
maximum of 1 service unit / second rate
(this is the “sleeper hold” of WLM)
© 2010 Gelb Information Systems Corp. - www.gelbis.com 26
Think Fasterwith Gelb Information
WLM Role in CP and PM
WLM is single most critical success factor (CSF) for CP and PM
Insure that critical business workloads are captured in service policy so they are easy to observe and analyze.
WLM exercises control on following:
WHAT? HOW?
CPU access priority Task dispatch priority guided by importance and service level goal CPU time limits Defined via resource groups
I/O performance Workload Priority propagation to the I/O controller & PAV-s (parallel access vol.) Enclaves for DDF, stored
procedures, etc…
Coded min/max service level definitions
Dynamic batch initiators Goal and resource driven controls Storage paging Isolation to protect working set size
WLM Definitions Do-s and Don’t-s
Service Definition Coefficients
Percentile Response Time
Average Response Time
© 2010 Gelb Information Systems Corp. - www.gelbis.com 28
Think Fasterwith Gelb Information
Service Definition Coefficients
Recommended service definition coefficients:
MSO = 0.0
CPU = 1.0
SRB = 1.0
IOC = 1.0 or less by orders of 10 (0.1 or 0.01; IBM
recommends 0.5)
Note 1: Potential impact on chargeback
algorithms if they use MSO service units in their calculations
Note 2: Non-zero MSO value will cause unstable performance under most conditions and regardless of key factors such as CPU or I/O activity
Percentile Response Time
The recommended way to manage the business critical CICS, DB2, and IMS production work
Stated as:
90% of transactions with < 1 sec. Resp.
If properly defined, prevents service problems caused by long running or never ending transactions
Region level goals may be lower WLM CPU overhead than CICS Transaction level goals, but…? ? ?
Just what has to be managed?
© 2010 Gelb Information Systems Corp. - www.gelbis.com 30
Think Fasterwith Gelb Information
Average Response Time
Can work if workload is homogeneous (this is rare
indeed!) – different units of work require very similar amounts of computer resources and similar service goals
Stated as:
ALL transactions < 1 sec. AVG. Resp.
Problem:
“Fooled” by long running transactions ending in the
Velocity Goals
“Execution velocity is an abstract mathematical
description with no objectively measurable metric.” --John Arwe, WLM Developer at IBM
Velocity goals do not determine the actual CPU
dispatching priority
Application systems velocities fluctuate severely due
to factors like work mix, total utilization, service policy, virtual storage management activities, non-zero WLM MSO service definition coefficient, etc…
© 2010 Gelb Information Systems Corp. - www.gelbis.com 32
Think Fasterwith Gelb Information
Velocity Goals – 2
Recommendation
: Use for
non-transactional, or seldom- never-ending work
Recommendation
: Use for work that needs
a limiter
Recommendation
: Consider use of resource
group with velocity goals to impose an absolute
limit if needed for vWLC
Velocity goals may require lower WLM CPU to
manage, but response time goals provide better
overall CP and PM tools
Case Study: The Butler Did It
Capacity plan blamed for very unstable performance
If CPU utilization increased to over 95% during any 30
minute period, DB2 response time would begin to wildly fluctuate.
CICS, DB2 involved
Significant DB2 activity generated directly from
© 2010 Gelb Information Systems Corp. - www.gelbis.com 34
Think Fasterwith Gelb Information
Case Study: The Butler Did It
– 2
Some of the evidence:
CPU activity reports from various sources
Showed that utilization was at 100% a lot of the time
Degradation analysis reports from various incidents
of degradation showed virtually every task within the system as THE suspect cause of the problem
IO activity reports did not show any unusual activity
Case Study: The Butler Did It
– 3
So who done it? The Butler of course! In plain view!
WLM Service policy did it!
All service classes regardless of importance, had
velocity goals, and
The sum of velocity goals of the active service
class periods exceeded processor capacity
The fix:
Introduced response time goals for some service
classes
Used CPU Critical attribute for importance 1
work service classes
© 2010 Gelb Information Systems Corp. - www.gelbis.com 36
Think Fasterwith Gelb Information
PR/SM Considerations
If PR/SM overhead greater than 1.5% or so, try to
figure out what is causing it and is it worth it.
Recommendation: Minimize number of LPARS
The ISSUE! Some important LPAR’s performance
suffers or some lower importance LPAR customers
complain whenever PR/SM enforces the specified
LPAR weights (a. k. a. CPU share)
When does it happen?
The 80/20 of Disk I/O Analysis
Our experience shows IO activity tuning is
95/05 rather than an 80/20 proposition
Most benefits achieved within 5% of the
selection list candidates from the many files
Examples:
Data & Index tables with highest total time in use
Volumes at or near practical capacity limits
Transaction with highest total disk I/O
© 2010 Gelb Information Systems Corp. - www.gelbis.com 38
Think Fasterwith Gelb Information
Case Study: “Analyze This” I/O
Plan Name Total Elapsed
Total CPU
CPU /
Elapsed Total Run
Total I/O Time @25% I/O Time Saved P09GI0032 120 18 15% 100 12,000 -2,550 P09GI0003 240 44 18% 100 24,000 -4,900 P09GI0009 80 48 60% 1000 80,000 -8,000 P09GI0018 310 53 17% 100 31,000 -6,425
What order would you focus your I/O tuning efforts? Why?
How many votes for the sequence of 18, 3, 32, 9?
Need / Want to Know More
Start at:
www.ibm.com/servers/eserver/zseries/
Large Systems Performance Reference: http://www-1.ibm.com/servers/
eserver/zseries/lspr/
“HOT TOPICS” a z/OS newsletter:
www.ibm.com/servers/s390/os390/bkserv/ hot_topics.html
Computer Measurement Group (CMG):
www.cmg.org
© 2010 Gelb Information Systems Corp. - www.gelbis.com 40
Think Fasterwith Gelb Information