Landcom’s Triple Bottom Line
TABLE OF CONTENT
1. INTRODUCTION 3
2. LANDCOM’S TRIPLE BOTTOM LINE PROGRAM 3
3. STAKEHOLDER CONSULTATION 5
T
ABLE1
- K
EYL
ANDCOMB
USINESSA
SPECTS ANDP
RELIMINARYTBL I
NDICATORSI
DENTIFIEDTHROUGH STAKEHOLDER CONSULTATION
6
4. VALIDATION PROCESS 9
5. GAP ANALYSIS 10
6. PROPOSED DRAFT TRIPLE BOTTOM LINE INDICATORS 11
T
ABLE2
- P
ROJECTI
NDICATORS11
T
ABLE3
- C
ORPORATEI
NDICATORS16
7. REPORTING THE INDICATORS & SETTING TARGETS 19
1. Introduction
Landcom’s mission statement commits the organisation to being “the leader in the delivery of
quality urban developments that are socially, environmentally and economically sustainable.”
Accordingly, Landcom developments have become benchmarks in urban design and
community development. Landcom’s vision has resulted in innovative residential estates
such as Victoria Park, Stanhope Gardens and the Forest Glade Smart Housing Estate at
Parklea, amongst many others.
While there is plenty of evidence that Landcom is moving toward sustainability, there is a
need to be able to quantify Landcom’s progress and ensure that Landcom is on the right
path.
This report presents a suite of indicators which allows Landcom to monitor and improve its
sustainability.
2. Landcom’s Triple Bottom Line (TBL) Program
The development of an integrated framework to achieve sustainability is known as the Triple
Bottom Line approach. The Triple Bottom Line is about economic, social and environmental
sustainability, not only for current communities, but also for future generations. The Triple
Bottom Line approach requires integration of these elements into a single framework and
demands a far more complex understanding of interdependence than has previously been
needed. The purpose of the TBL indicators is to measure Landcom’s sustainability
performance to better understand Landcom’s strengths and weaknesses and hence act to
improve its future performance.
Landcom’s TBL Program is far more challenging than existing reporting frameworks and it
has the potential to deliver improved transparency, accountability and performance
management. Similarly, it is anticipated that increased disclosure will facilitate better
dialogue between Landcom and its key stakeholders.
The key to measuring Landcom’s sustainability performance is through the selection of a set
of relevant and suitable indicators.
Landcom has adopted the following steps to identify and select suitable indicators and
implement its TBL program:
1.
Internal awareness raising
2.
Forming an internal reference group to guide the development of the TBL program
3.
Clarifying the purpose of the TBL program and identifying shared values and a vision
4.
Reviewing Landcom’s existing reporting requirements
5.
Reviewing best practice reporting models and principles
6. Identifying
key
stakeholders
7.
Identifying a preliminary list of TBL indicators through consultation with internal and key
external stakeholders
8.
Seeking comments from key stakeholders on the preliminary indicators
9.
Convening a selection and validation process for refining the preliminary indicators
10. Performing a gap analysis to identify gaps in existing data and reporting mechanisms
11. Adopting the proposed draft indicators
12. Consulting with key stakeholders
14. Finalising the indicators
15. Publishing and promoting the Towards Sustainability Report in October 2002
16. Implementing suitable data collection and evaluation systems
17. Collecting and collating the data
18. Consulting with key stakeholders with regard to presentation of the data
19. Publishing Landcom’s first TBL Report for the financial year 2002-03
20. Reviewing the applicability and relevance of the indicators annually through
consultation with key stakeholders
21. Updating the TBL report annually
Landcom examined existing sustainability reporting models and principles and decided to
follow the Global Reporting Initiative (GRI) Guidelines where applicable. A plan was
established to deliver Landcom’s Towards Sustainability Report in October 2002.
A preliminary set of indicators was then drafted in consultation with Landcom employees and
key external stakeholders. The results of the consultation workshops are described in
Section 3.
The preliminary indicators were then tested using a validation process and gap analysis.
These exercises are discussed in Sections 4 & 5.
Landcom has now reached Step 13. The revised draft indicators have been adopted and
form the basis of this report. Your comments are now invited on the proposed draft TBL
indicators prior to their finalisation and subsequent annual publication in the Towards
Sustainability Report.
Please note that the purpose of Landcom’s Towards Sustainability Report is to explain the
process of developing the TBL program and indicators. The Report will not contain data on
the indicators. Data for the selected indicators will be reported in Landcom’s first TBL Report
for the financial year 2002-03.
3. Stakeholder Consultation
Landcom began its consultation process with its internal stakeholders ranging from the
Board, Senior Executive, middle and line managers and staff representatives from every
business unit. Following internal consultation, key external stakeholders were identified from
State and Local Government organisations, non-government organisations, community
groups and industry partners.
Stakeholder workshops were held between September and November 2001. The following
stakeholders accepted Landcom’s invitation to participate:
State and Local Government Organisations
Campbelltown Council
Camden Council
CSIRO – Building Construction and Engineering
Department of Land and Water Conservation
Department of Public Works and Services
Environment Protection Authority
Healthy Rivers Commission
Integral Energy
Local Government and Shires Association
PlanningNSW
National Parks and Wildlife Service
NSW Coastal Council
NSW Heritage Office
NSW State Forests
Sustainable Energy Development Authority (SEDA)
Sydney Water
Treasury
Non-government Organisations
Council of Social Services of NSW
Nature Conservation Council (NCC)
Sustainable Population Australia
Total Environment Centre
Wilderness Society
Community Groups
Narellan Community Care
Northwest Community Care
Industry Partners
Master Builders Association
St Hilliers Pty Ltd
The workshops were structured to allow the attendees to express their expectations of
Landcom and to nominate key business aspects that are relevant to Landcom’s core
activities. From the list of key business aspects, the workshop participants compiled a
comprehensive list of over 80 preliminary indicators.
Table 1 - details the comprehensive list of preliminary indicators that formed the basis of
Landcom’s proposed draft TBL indicators (presented for public exhibition – see Section 6).
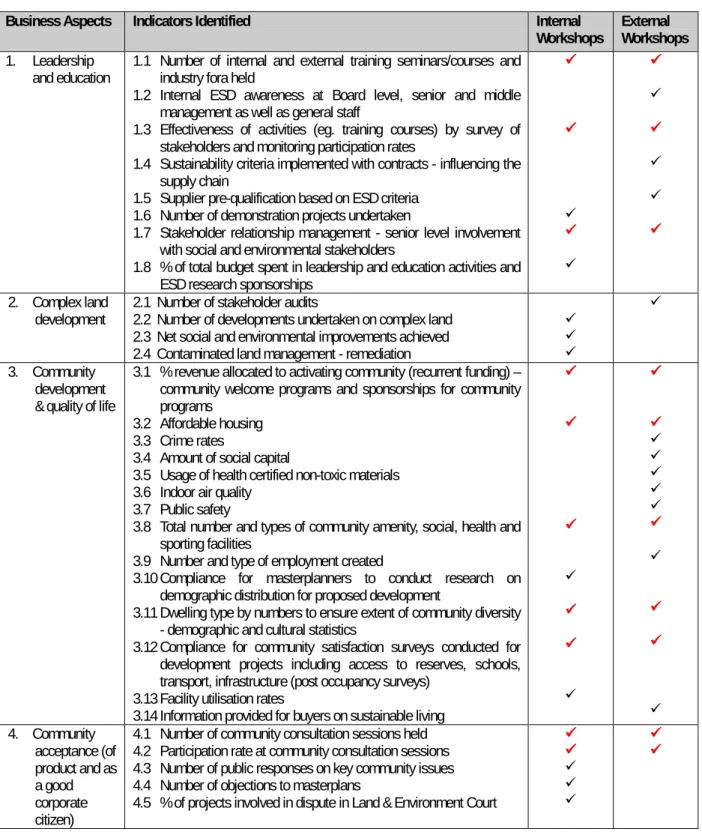
Table 1 - Key Landcom Business Aspects and Preliminary TBL Indicators Identified through
stakeholder consultation (not in any order of priority)
Business Aspects Indicators Identified Internal
Workshops ExternalWorkshops
1. Leadership
and education 1.1 Number of internal and external training seminars/courses andindustry fora held 1.2 Internal ESD awareness at Board level, senior and middle
management as well as general staff
1.3 Effectiveness of activities (eg. training courses) by survey of stakeholders and monitoring participation rates
1.4 Sustainability criteria implemented with contracts - influencing the supply chain
1.5 Supplier pre-qualification based on ESD criteria 1.6 Number of demonstration projects undertaken
1.7 Stakeholder relationship management - senior level involvement with social and environmental stakeholders
1.8 % of total budget spent in leadership and education activities and ESD research sponsorships
2. Complex land development
2.1 Number of stakeholder audits
2.2 Number of developments undertaken on complex land 2.3 Net social and environmental improvements achieved 2.4 Contaminated land management - remediation
3. Community development & quality of life
3.1 % revenue allocated to activating community (recurrent funding) – community welcome programs and sponsorships for community programs
3.2 Affordable housing 3.3 Crime rates
3.4 Amount of social capital
3.5 Usage of health certified non-toxic materials 3.6 Indoor air quality
3.7 Public safety
3.8 Total number and types of community amenity, social, health and sporting facilities
3.9 Number and type of employment created
3.10Compliance for masterplanners to conduct research on demographic distribution for proposed development
3.11Dwelling type by numbers to ensure extent of community diversity - demographic and cultural statistics
3.12Compliance for community satisfaction surveys conducted for development projects including access to reserves, schools, transport, infrastructure (post occupancy surveys)
3.13Facility utilisation rates
3.14Information provided for buyers on sustainable living
4. Community acceptance (of product and as a good corporate citizen)
4.1 Number of community consultation sessions held 4.2 Participation rate at community consultation sessions 4.3 Number of public responses on key community issues 4.4 Number of objections to masterplans
4.5 % of projects involved in dispute in Land & Environment Court
Business Aspects Indicators Identified Internal
Workshops ExternalWorkshops
5. Resource
management 5.15.2 NatHERS house energy rating - % with five star ratingQuantity of energy used and greenhouse gas emissions
5.3 % renewable energy used in developments and associated greenhouse savings
5.4 % new development
5.5 New materials used per dwelling (volume or mass/tonnage) 5.6 Volume of water imported and exported per dwelling - post
occupation.
5.7 Types and quantities of recycled and recyclable materials used 5.8 % of recycled and recyclable materials used in buildings 5.9 Post development waste sorting and recycling facilities
5.10Volume of total waste generated in development projects per year 5.11% demolition materials reused on-site and elsewhere
5.12Total cost of waste management in transport and disposal
6 Human resource management
6.1 Number or % of Landcom staff versus contractors 6.2 Length of employment of Landcom staff and contractors 6.3 Employee satisfaction
6.4 Initiatives for creating a culture of socially responsible work environment 7. Facilitating operating cost 7.1 % cost recovery 8. Heritage
conservation 8.28.1 Conservation of cultural heritage valuesConservation of heritage buildings and values 9. Local job
creation 9.19.2 Number and types of local jobs createdNumber of residents employed locally within 10 km or less
10. Water cycle
management 10.1Urban water quality (runoff quality control) – during constructionand post-development 10.2Stormwater quantity (on-site water capture, water sensitive urban
design)
10.3On-site detention - number of stormwater retention tanks located on-site per project
10.4Public domain water demands
10.5Extent of natural drainage solutions compared to engineered solutions
10.6Use of water quality controls (ie. wetlands) in projects
11. Sustainable
product design 11.111.2 Energy efficiency rating implementation ratesEcological footprint 11.3 Sustainable design scorecard
12. Conservation & enhancement of natural features and biodiversity
12.1 Area of estate devoted to wildlife corridors 12.2 % indigenous planting
12.3 Introduced flora and fauna species 12.4 Threatening processes
12.5 Flora and fauna conservation 12.6 Area cleared and habitat lost
12.7 Area enhanced/regenerated and habitat gained 12.8 Types of species cleared
12.9 % beyond compliance of conservation conditions specific to projects
12.10 $ spent in regeneration of vegetation
12.11 Linear metres of creek rehabilitated or enhanced
13. Efficient use of
land resources 13.113.2 Density of land useRemediation of contaminated land to residential standards
14. Regulatory
compliance 14.1 % regulatory compliance by Landcom with development consentconditions 14.2 % non-compliance of conservation conditions specific to projects 14.3 % compliance with specific stakeholders requirements (eg.
meetings with Aboriginal Land Council)
Business Aspects Indicators Identified Internal
Workshops ExternalWorkshops
15. True cost
accounting 15.115.2 Environmental and social accounting% total dollar allocated to “added value items” 15.3 “Extent” of subsidies as a base of revenue
16. Return on asset
16.1 Profit derived as % of current market land value
17. Balanced
profitability 17.1 Commercial viability and profitability 18. Facilitating and
optimising public infrastructure
18.1 % dwellings within 1 km of public transport infrastructures 18.2 % land allocation to alternative transport (ie. cycleways etc) 18.3 Maximum opportunity to link to public transport
18.4 Synergistic relationship between various infrastructure types (eg. water and energy)
19. Regional economic growth
19.1 Number and types of jobs created
19.2 Rate based capital increase of surrounding areas 19.3 Increase in capital value of properties in neighbourhood
19.4 Monetary value added to government assets before & after developments
Landcom rigorously reports on its financial performance and acknowledges that indicators
such as profit are integral to the Triple Bottom Line. However, they have not been included
within this report as the financial indicators represent part of a common institutional reporting
regime and therefore do not require further revision within the current TBL initiative.
Nevertheless, the financial indicators will be reported alongside the new TBL indicators in the
resultant
Towards Sustainability Report
and the following annual TBL reports
to allow an
effective comparison and to construct a holistic understanding of Landcom’s complete Triple
Bottom Line.
Landcom’s financial indicators are:
•
Revenues
•
Sales
margin
•
Return on sales
•
Earnings Before Interest and Taxes
•
Net debt to total equity
•
Return on equity
•
Return on assets
The preliminary indicators shown in Table 1 were then tested using the validation process
and gap analysis discussed in Sections 4 and 5.
4. Validation Process
During the
validation process
and subsequent
gap analysis
the indicators were assessed
against a set of standard selection criteria. The criteria were of equal weight and were
chosen to ensure that the final indicators would be robust and reliable.
The selection criteria related to:
1.
the significance and relevance of the indicator to the organisation
2.
the ability to show changes over time (suitable for annual reporting)
3.
whether Landcom has direct control and/or influence over the indicators
4.
whether they are understandable and communicable
5.
whether they establish targets and promote remedial action
6.
the availability of the data
7.
the cost of retrieval of the data.
Failure to consider each of the criteria would have generated indicators which lack rigor,
create data collection and interpretation problems and poorly inform or mislead the decision
making process. Common mistakes in developing a TBL reporting process include selecting
indicators that:
•
do not show changes over time;
•
possess insufficient or prohibitively costly data sources; and
•
do not readily promote remedial action.
Notwithstanding this, Landcom or its stakeholders may still choose an indicator that does not
satisfy the above criteria because it is considered that disclosure of the associated data will
still provide some insight into Landcom’s activities. This choice remains valid and is a
reflection of the dynamic and participatory nature of the indicator selection process.
More advanced criteria were also applied to the preliminary TBL indicators shown in Table 1
to refine their suitability for the task. Being aware of the following attributes of an indicator
enabled Landcom to refine the definition and improve the indicator’s application.
Valuable indicators are predictive and discuss outputs.
Predictive indicators are superior to lag indicators because they give the decision-maker
some insight into what will happen and allow organisations to avert any adverse conditions.
Alternatively, lag indicators only tell the decision-maker what has already occurred. If this
information reports a state that is deleterious to the organisation, then there will be a further
delay before any remedial strategies can take effect.
For example, profit, while a valuable indicator, is a lag indicator. If the organisation has made
a loss then it will take time to implement remedial strategies. However, predictive indicators
such as consumer confidence and business confidence, allow the decision-maker to
anticipate changes in the market place and modify its behaviour. A combination of both
predictive and lag indicators is needed to depict a balanced picture of an organisation’s
performance.
Another indicator attribute, which is fundamental to the quality and meaning of the data is
whether the data describes inputs or outputs. For example, an input indictor would be the
amount of money invested in training programs whereas an output indicator would measure
the effect of staff training on the organisation’s performance and productivity.
The majority of Landcom’s proposed draft TBL indicators report on outputs; some are
predictive and some are lag indicators. No indicator alone can demonstrate sustainability or
convey the condition of the Triple Bottom Line. The indicators must be assessed as a set.
There is a temptation to make indicators do too much. Each indicator can only show a small
picture. Together they give a bigger picture but not the whole picture. Interpretation and
understanding of the indicators will always be influenced by the perception of the analyst and
changing external circumstances. For example, benchmarks will vary over time in
accordance with changing community, government, employee and board attitudes. It is
through the contrast and weighting of outcomes that broader picture can be developed to
assess performance.
The TBL indicators shown in Table 1 were subjected to a filtering process using the selection
criteria and the indicator types. As a result, a number of indicators were eliminated. The
next step involved a gap analysis to determine the availability and suitability of the data
source for each remaining indicator.
5. Gap Analysis
The gap analysis used a standard methodology to determine how practical it would be to
collect data and report on each of the preliminary indicators. The gap analysis was
essentially a search for information that would yield a better understanding of the available
data and how relevant it was to the respective indicator. Accordingly, the gap analysis
identified:
1.
what type of baseline information was available
2.
who collected the information
3.
how frequently the information was collected
4.
how accurate the information was
5.
how the information was stored
6.
how the information was presented
7.
how much it cost annually to collect or buy the information.
Large data gaps would ordinarily mean that an indicator should be abandoned or
alternatively, kept and declared unmeasurable or not-yet-measured. In other cases, a new,
but entirely appropriate indicator may appear.
The gap analysis revealed that most preliminary indicators did not possess any existing data
and that new mechanisms for data collection would have to be funded and implemented.
Consequently, Landcom has committed itself to expanding its data collection obligations in an
effort to meet the requirements of those indicators chosen by its stakeholders. These new
data pathways applied principally to project reporting and once implemented will generate
substantial amounts of information about the environmental, social and economic impacts
and benefits of Landcom’s urban development and renewal programs.
The gap analysis, in combination with the validation process, enabled Landcom to refine the
list of preliminary TBL indicators. Accordingly, some indicators were eliminated, some
amalgamated and some added depending on the relevance of the indicator to Landcom’s
core business and the bounds of Landcom’s control and/or influence over that indicator.
Landcom sought to ensure that all the indicators were understandable and communicable
and therefore consideration was given to the final reporting and presentation of the
respective indicators. Accordingly, the proposed draft indicators contained in section 6 were
considered to be a true and comprehensive representation of Landcom’s Triple Bottom Line.
6. Proposed Draft Triple Bottom Line Indicators
In addition to its financial indicators, Landcom has adopted 24 proposed draft TBL indicators
for public exhibition.
The indicators have been separated for reporting purposes into project and corporate
indicators. The classification was determined by the data source. Project indicators refer
explicitly to data collated from individual Masterplans, Development Applications, project
delivery reports and post project reviews. Corporate indicators rely on data sources that are
maintained centrally by Landcom.
The proposed draft TBL indicators are a combination of qualitative (marked
✹
) and
quantitative indicators.
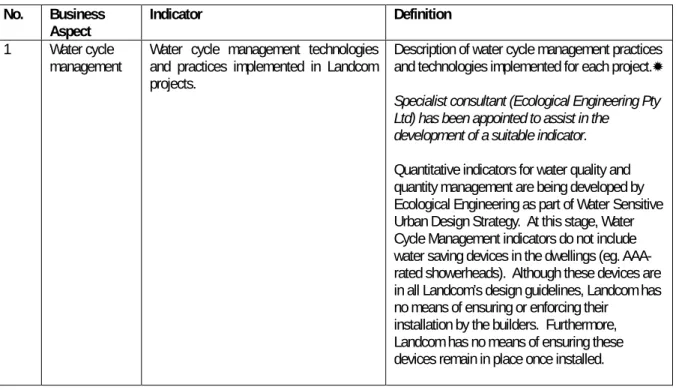
Table 2 - Project Indicators (not in any order of priority)
No. Business
Aspect Indicator Definition
1 Water cycle
management Water cycle management technologiesand practices implemented in Landcom projects.
Description of water cycle management practices and technologies implemented for each project.✹
Specialist consultant (Ecological Engineering Pty Ltd) has been appointed to assist in the
development of a suitable indicator.
Quantitative indicators for water quality and quantity management are being developed by Ecological Engineering as part of Water Sensitive Urban Design Strategy. At this stage, Water Cycle Management indicators do not include water saving devices in the dwellings (eg. AAA-rated showerheads). Although these devices are in all Landcom’s design guidelines, Landcom has no means of ensuring or enforcing their
installation by the builders. Furthermore, Landcom has no means of ensuring these devices remain in place once installed.
No. Business
Aspect Indicator Definition
2 Community consultation & community development
Moderate Income Housing provision. Moderate Income Housing means housing product, either a dwelling unit or residential allotment, that is marketed at a price affordable to moderate income earners. Moderate income is currently defined as 80% -130% of the Sydney median household income in any year according to the ABS. For product outside the Sydney Region (including Wyong), the NSW median household income should be used.
Annual moderate-income yield expressed as a proportion of total yield. Yield is represented by the sum of lots, house/land packages and dwelling units.
3 Community consultation & community development
Effectiveness of community consultation. Development of a structured stakeholder consultation plan for all Landcom projects. Measurement of percentage of identified stakeholders actively participating in consultation activities.
Implementation of a variety of techniques to inform and involve stakeholders.
4 Community consultation & community development
Community facilities – schools, passive and active recreational spaces, community centres (eg. swimming pools, tennis courts, children’s playgrounds, community halls, etc).
Number and size of schools, total area of passive and active recreational spaces (including multi-use open space, vegetation conservation areas and riparian conservation areas), number and size of other community facilities included in each estate.
5 Community consultation & community development
Welcome programs for both Urban Development and Urban Renewal projects.
Welcome programs are designed to help new residents settle into their new community and establish and activate community networks by initiating various events that bring the community together. Community Associations also play a similar role.
Number of new homes welcomed (visited) annually.
Time elapsed between home occupation and welcoming.
Number of residents attending the community events.
6 Resources
management Percentage of construction anddemolition materials reused on-site and elsewhere.
Quantity (in tonnes) of itemised construction and demolition (C&D) materials that are reused on-site or elsewhere annually. The recycled proportion is expressed as a percentage of the total weight of the construction and demolition waste measured in tonnes.
No. Business
Aspect Indicator Definition
7 Resources
management Energy efficient design (residential &commercial buildings). Note: energy efficient design is a demand-side energy management indicator. That is, energy efficient design reduces the use of energy and greenhouse gas emissions but it does not replace non-renewable energy sources.
The proportion of Landcom houses and dwelling units that achieve a 3.5, 4, 4.5 and 5 star rating under the National Housing Energy Rating Scheme (NatHERS). The result is calculated as a percentage of all houses and dwelling units constructed by Landcom in a given year and reported as projected reduction in greenhouse gas emissions.
Commercial building star rating is calculated as per SEDA guidelines for non-residential building energy rating guidelines. The result will be reported as projected reduction in greenhouse gas emissions.
8 Influencing
Design Design Guidelines for built form (egguidelines for courtyard lots, corner lots etc).
Influence of Landcom’s design guidelines on the final built form.
Number of lots per project that Landcom directly influence through design guidelines.
Note: Design guidelines are a way of influencing the urban outcome and the built form where Landcom does not have direct control over the built product.
9 Resources
management Sustainable energy technology use. Note: This indicator is a supply-side energy management indicator. That is, it measures performance based on renewable or sustainable energy supply.
Proportion of houses and dwelling units that have gas-boosted solar or heat pump hot water systems. The result is calculated as a percentage of all houses and dwelling units constructed by Landcom in a given year. And (if any)
Sustainable energy generation technologies installed at project level. Sustainable energy technologies include, Photovoltaic cell (PV) arrays, gas turbines, co-generation, micro gas turbines, wind power, etc. The benefit of these technologies will be measured by their energy & greenhouse gas savings. This is an on-going indicator – ie. the savings will continue every year.
No. Business
Aspect Indicator Definition
10 Conservation &
enhancement of biodiversity
Native vegetation management (net loss
or gain). Area of threatened species or communities asdetailed in flora & fauna reports or Species Impact Statements (SIS) and approved by NPWS for clearing annually presented in contrast to the area of vegetation/bushland enhanced and regenerated annually on Landcom estates. Data to be presented as total vegetation net loss or gain and the component communities (and type of species) cleared.
Area measured in hectares (ha). Provision of an appropriate Vegetation Management Plan for the organisation responsible for the ongoing maintenance of the vegetation (eg. local council).
11 Conservation &
enhancement of biodiversity
Riparian corridor management (net loss
or gain). Total length and width of creekline rehabilitatedand/or destroyed (as per DLWC approval) by Landcom annually expressed as the net loss or gain of riparian corridor.
Provision of an appropriate Riparian Corridor Management Plan for the organisation responsible for the ongoing maintenance of the riparian corridor (eg. local council).
For the purposes of this indicator, a creek is defined as a natural perennial or ephemeral stream of water flowing in a narrow natural channel. The net loss or gain of riparian corridor is expressed in linear metres.
12 Heritage
conservation Conservation of indigenous and non-indigenous heritage items. Total number of indigenous and non-indigenousheritage items identified and subsequently protected by Landcom annually as a proportion of all indigenous and non-indigenous heritage items identified on Landcom estates in the same year. Indigenous sites defined by National Parks and Wildlife Service (NPWS) and non-indigenous heritage defined by Heritage Council or Australian Heritage Office.
No. Business
Aspect Indicator Definition
13 Regulatory
compliance Number and nature of non-compliances. Number of breaches of legislation by Landcomannually that incur a financial penalty and/or require a court appearance.
And (if any)
Number of occasions per year that Landcom has received formal notification from development consent authorities that it has failed to comply with development consent conditions. Formal notification includes Penalty Infringement Notices issued by the EPA. The EPA is Landcom’s Appropriate Regulatory Authority (ARA) under the POEO Act 1997.
Percentage of projects audited through the Performance Improvement Review (PIR) process.
Total number of projects that achieve a PIR score of 75% or greater in a given year.
Total number of projects that achieve a PIR score of less than 50%.
Please note that the PIRs and the associated site audit program are Landcom initiatives and not required under any legislation.
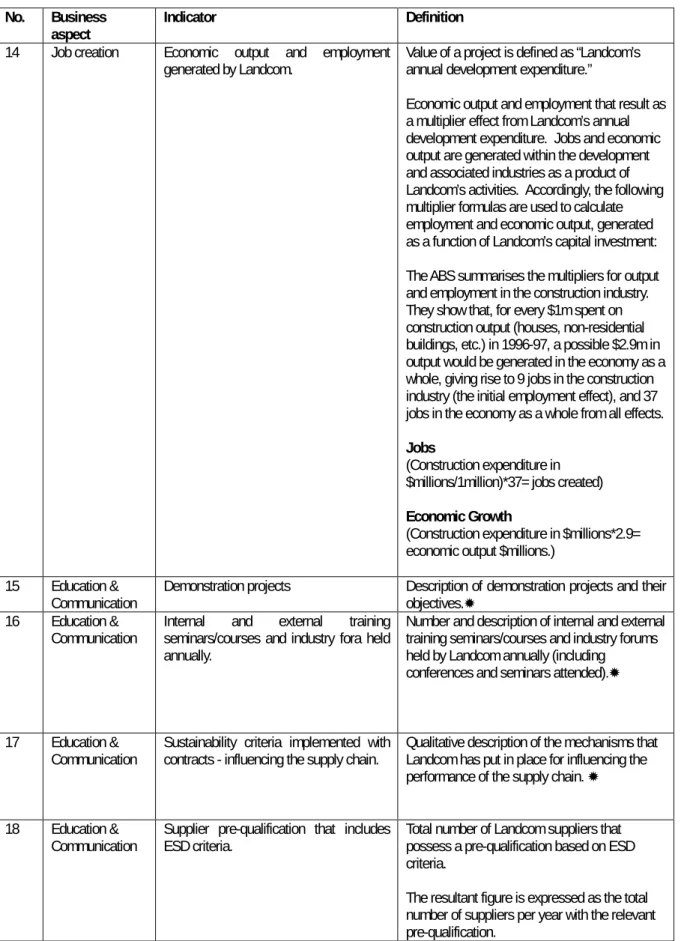
Table 3 - Corporate Indicators (not in any order of priority)
No. Business
aspect Indicator Definition
14 Job creation Economic output and employment
generated by Landcom. Value of a project is defined as “Landcom’sannual development expenditure.” Economic output and employment that result as a multiplier effect from Landcom’s annual development expenditure. Jobs and economic output are generated within the development and associated industries as a product of Landcom’s activities. Accordingly, the following multiplier formulas are used to calculate employment and economic output, generated as a function of Landcom’s capital investment: The ABS summarises the multipliers for output and employment in the construction industry. They show that, for every $1m spent on construction output (houses, non-residential buildings, etc.) in 1996-97, a possible $2.9m in output would be generated in the economy as a whole, giving rise to 9 jobs in the construction industry (the initial employment effect), and 37 jobs in the economy as a whole from all effects.
Jobs
(Construction expenditure in $millions/1million)*37= jobs created)
Economic Growth
(Construction expenditure in $millions*2.9= economic output $millions.)
15 Education &
Communication Demonstration projects Description of demonstration projects and theirobjectives.✹ 16 Education &
Communication Internal and external trainingseminars/courses and industry fora held annually.
Number and description of internal and external training seminars/courses and industry forums held by Landcom annually (including
conferences and seminars attended).✹
17 Education &
Communication Sustainability criteria implemented withcontracts - influencing the supply chain. Qualitative description of the mechanisms thatLandcom has put in place for influencing the performance of the supply chain. ✹
18 Education &
Communication Supplier pre-qualification that includesESD criteria. Total number of Landcom suppliers thatpossess a pre-qualification based on ESD criteria.
The resultant figure is expressed as the total number of suppliers per year with the relevant
No. Business
aspect Indicator Definition
19 Education &
Communication Stakeholder relationship management -senior level involvement with social and environmental stakeholders.
Qualitative description of engagement program.✹
Landcom senior management to brief key government and non-government stakeholders biennially.
20 Human resources management
Aboriginal employment opportunity. Establishment of a cadetship program for students with Aboriginal or Torres-Strait Island background. The program will combine tertiary education, in a related field to Landcom’s operation, with working at Landcom. 21 Human
resources management
Employee satisfaction. Qualitative assessment of overall employee satisfaction expressed by Landcom staff. Includes permanent and long-term contract employees.✹
22 Human resources management
Employee retention rate. Percentage annual employee retention expressed as the inverse of the number of permanent staff who left in the previous year eg. 15% left therefore retention 85%. 23 Resources
management
Quantity of energy used and greenhouse gas emissions.
The total amount of energy used by Landcom annually and the resultant greenhouse emissions calculated as a function of office electricity use and motor vehicle fuel consumption.
Energy use is measured in kilowatt-hours (kWh) of electricity.
Fuel consumption is measured in kilolitres (kL) Greenhouse gas production is measured in tonnes of carbon dioxide (t CO2 )
Electricity conversion formula for NSW is: kWh * 0.92 kg/kWh= kg CO2 / 1000 = t CO2 Petroleum fuel consumption conversion formula:
{volume of fuel used (kL) * energy fuel content GJ/kL} * CO2 emission factor kg/GJ /1000 = tonnes CO2 emissions
formula with coefficients:
{Volume (kL) * 34.2 GJ/kL} * 71.3 kg/GJ /1000 = tonnes CO2 emissions
No. Business
aspect Indicator Definition
24 Strategic and/or Complex development
Number of developments that are
strategic and/or complex. Annual number of new Landcom developmentscommenced that are strategic and/or complex.
Complex
Projects that necessitate government involvement to overcome and secure against significant constraints and risks associated with the subject land. Risk could be the result of one or more of the following:
• fragmented land ownership (private and public);
• multiple land use and zoning;
• multiple regulatory authority involvement (issues such as protection of high value flora and fauna, protection of sensitive riverine corridors, remediation of heavily contaminated soil, etc);
• multiple community stakeholder groups (different priorities);
• comparatively high cost of up-front infrastructure investment; • multiple constraints – first time
demonstration projects;
• significant local sensitivity and profile.
Strategic
Projects that give force to Government urban management policy and planning and act as a catalyst for future urban development on a regional scale. Strategic projects may include town centre developments, large-scale inner city gentrification, best practice urban design, sustainable development, affordable housing and community development. Furthermore, strategic projects may:
• unlock a range of significant development opportunities and public interest benefits at local and regional levels;
• provide solutions to longstanding, unresolved issues; or
• possess qualities of intrinsic importance to government and the local community.