[email protected] [email protected] [email protected]
Keith Weiss, CFA
+1 212 761-4149
Sanjit K Singh
+1 415 576-2060
Josh Baer, CFA
+1 212 761-4223
Red Hat, Inc.
( RHT.N, RHT US )
Software / United States of America Stock RatingStock Rating OverweightOverweight
Industry View
Industry View AttractiveAttractive
Price target
Price target $80.00$80.00
Shr price, close (Mar 15, 2016) $71.55
Mkt cap, curr (mm) $13,326
52-Week Range $84.43-59.61
Fiscal Year Ending 02/15 02/16e 02/17e 02/18e
ModelWare EPS ($)
ModelWare EPS ($) 1.851.85 2.182.18 2.502.50 2.882.88
Prior ModelWare EPS Prior ModelWare EPS ($) ($) -- -- -- --P/E P/E 37.437.4 30.030.0 28.628.6 24.824.8 Consensus EPS ($)§ Consensus EPS ($)§ 1.581.58 1.861.86 2.182.18 2.542.54 Div yld (%) 0.0 0.0 0.0 0.0
U n less oth erwise n oted, all m etric s are based on M organ Stan ley M odelWare fram ework § = Con sen su s data is provided by Th om son Reu ters Estim ates
e = M organ Stan ley Researc h estim ates
QUARTERLY MODELWARE EPS ($)
2016e 2016e 2017e 2017e
Quarter 2015 Prior Current Prior Current
Q1 0.39 - 0.51a - 0.57
Q2 0.48 - 0.55a - 0.61
Q3 0.47 - 0.56a - 0.65
Q4 0.51 - 0.55 - 0.68
e = M organ Stan ley Researc h estim ates, a = Ac tu al Com pan y reported data
Industry View
Attractive
Stock Rating
Overweight
Price Target
$80.00
Red Hat, Inc.
Red Hat, Inc.
4Q16 Preview: Linux Going Full Steam
Ahead Into the Enterprise
Our confidence in 15%+ billings growth increases given a bullish
tone from the channel, highlighted by RHEL's growing traction in the
enterprise which pulls through sales of new products. At 13x our
CY17e Adj FCF, valuation remains compelling. RHT remains our top
idea in infrastructure software.
Expecting a Strong Q4
.
Conversations with Red Hat resellers point to a
robust demand environment as enterprise customers are increasingly moving
to Red Hat Enterprise Linux (RHEL) as a way to lower costs and take advantage
of modern development technologies. Accordingly, our thesis of a virtuous
cycle — whereby a growing RHEL customer base proves fertile ground for
upselling emerging technologies, while at the same time rising demand for
these emerging technologies actually draws in new customers to the Red Hat
ecosystem — continues to unfold, in our view. As a result, despite the toughest
cc comps of FY16, we expect Red Hat to top consensus revenue and billings
expectations in Q4. With demand trends strengthening and comps easing
significantly in 1H17, we see Red Hat well-positioned to sustain 15%+ billings
growth into FY17, keeping us Overweight on the name.
Channel Feedback: Linux Reaching Mainstream Status in the Enterprise.
Conversations with Red Hat partners ($40M cumulative annual revenue)
clearly point to a healthy spending environment. The majority of partners
exceeded targets in CQ4, while noting that deal activity accelerated in January
and February, leaving partners in a strong position as CQ1 comes to a close.
The outlook for CY16 was also bullish with partners targeting growth in a
range of 13-50% YoY. Supporting their positive outlook, is sustained demand
for Red Hat Enterprise Linux (RHEL) as partners noted that the "value
proposition of a Red Hat subscription is clearly increasing". Our contacts cited
1) lower cost, 2) share gains from Windows, 3) new customer adoption and 4)
the desire to take advantage of new technologies as the primary factors behind
the durable growth trends. Growing adoption of the RHEL platform is also
resulting in halo effects across the product portfolio including:
Morgan Stanley does and seeks to do business with
companies covered in Morgan Stanley Research. As a result,
investors should be aware that the firm may have a conflict
JBoss/Mobile:
Continued strong growth driven by share gains from IBM
Reseller Survey: Improving Results.
84% of resellers met or exceeded
targets vs. 76% last quarter and 64% in CY1Q15. In addition, 89% of resellers
indicated that JBoss sales met or exceeded plan in the quarter, vs. 77% last
quarter and 78% in CY1Q15. Overall, large resellers saw 13% growth (4%
overall) in the past three months and expect 13% growth in 2016 (4% overall).
However, we note that resellers located in APAC negatively skewed overall
expectations, with the average APAC reseller expecting 23% for CY16 and
-20% for CY17. Ex-APAC, expected growth is +6% in CY16 and +9% in CY17.
4Q16 Setup: Tough Comps Embedded in Estimates.
4Q16 estimates look
achievable despite facing a cc billings comparison that is 400 bps tougher, but
this appears well factored into consensus estimates which assumes that cc
billings growth decelerates >650 bps from 3Q16 to 4Q16. Consensus Q4
billings of $770M implies QoQ growth of 24%, just below 5-year avg.
seasonality of 25%, and implies cc billings growth of 14% – a deceleration
from 20% cc growth in 3Q16. Lower YoY contract durations (~22 months vs.
guidance of ~21 months) results in a 2 ppt drag on billings growth. Cons. Q4
revenue of $537M (within guidance of $535-539M) represents 18% cc growth.
Public Cloud: a Blessing and a (Slight) Curse.
The public cloud business
has been the fastest growing product area and recently crossed the $100M
annualized run rate threshold. With 150+ cloud partners including recently
expanded relationships with Azure and Google Compute, Red Hat's cloud
business is likely to sustain rapid growth. However, cloud can act as a drag on
billings given that it is billed monthly in arrears resulting in little deferred
revenue versus the core subscription business. That said, we think a ramping
cloud business is incremental as cloud workloads are largely net-new.
FY17 Guidance: History Points to Likely Conservatism.
Our FY17
billings/revenue/OCF/EPS estimates of $2,679M/$2,333M/$880M/$2.16
compares to consensus of $2,641M/$2,356M/$774M/$2.19. On a cc basis, our
FY17 billings/revenue estimates imply growth of 15%/13%, which represents a
deceleration from expected FY16 billings/revenue growth of 17%/21%,
respectively. Management will introduce FY17 revenue guidance on the 4Q16
call, which we expect to be conservative. Over the last 3 years, the midpoint of
initial full year revenue guidance has fallen short of consensus by an avg. of
1%. However, actual full year results have exceeded initial guidance by an
average of 2%. Management will also provide total backlog and off-balance
sheet backlog which grew 19%/41% in FY15.
What About Margins?
Margins have declined for 4 straight years, reflecting
several acquisitions, investments in data centers and in sales to grow new
product categories. With top-line growth sustaining and several opportunities
in front of it, management may choose to invest resulting in little upside to
FY17 cons. operating margins of 23.9%. This could prove disappointing given
investor appetite for improving profitability in the current market.
interest in OpenShift which appears to be benefitting from the growing
adoption of RHEL/JBoss technologies.
Storage / Virtualization:
Partners cite a growing emphasis on cost
reduction and an increasingly favorable competitive environment for an
uptick in sales of Red Hat Enterprise Virtualization (RHEV), as well as,
storage virtualization.
Morgan Stanley is acting as financial advisor to The Weather Company, LLC
(“The Weather Company”) in relation to its definitive agreement with IBM
under which IBM will acquire The Weather Company’s Product and
Technology Business. The Weather Company has agreed to pay fees to
Morgan Stanley for its financial services. Please refer to the notes at the end of
the report.
Morgan Stanley is currently acting as lead financial advisor to EMC
Corporation (“EMC”) with respect to its definitive agreement to be acquired by
Dell Inc., and Dell’s owners, Michael S. Dell, MSD Partners L.P., and Silver Lake,
as announced on October 12, 2015. The proposed acquisition is subject to
customary conditions, including receipt of required regulatory and EMC
stockholder approvals. This report and the information provided herein is not
intended to (i) provide voting advice, (ii) serve as an endorsement of the
proposed transaction, or (iii) result in the procurement, withholding or
revocation of a proxy or any other action by a security holder. EMC has agreed
to pay fees to Morgan Stanley for its financial advice, including transaction
fees that are contingent upon the consummation of the proposed transaction.
Please refer to the notes at the end of the report.
Avg. Over Past 3 Years
-4% -2% 0% 2% 4% 6% 8% 10% 12% $0 $300 $600 $900 $1,200 $1,500 $1,800 $2,100 $2,400
FY10 FY11 FY12 FY13 FY14 FY15 FY16e
Initial Annual Rev Guidance vs. Cons. vs Actual
Mid Pt of Annual Guidance Consensus at Initial Guide Actual % Actual Vs. Initial % Above/Below Cons.
Price Target $80
Derived from Base Case of $85/share
Bull $101
EV/FCF = ~17x CY17e
Adjusted FCF of $5.58/share
plus ~$6 in net cash
Market Share Gains Accelerate, Emergence as a Major Player
in Cloud.
Red Hat continues to gain share in the OS and
middleware markets, while new technologies gain traction and
cloud investments see strong early results, significantly raising
ASPs and opening new market opportunities. New product
strength and momentum in Linux drives high-teens billings growth
through CY17, resulting in 25% OM by CY17 and sustaining OCF
and FCF growth >20%. Stock trades at ~17x our CY17 adj. FCF est
of $5.58 per share, plus ~$6 in net cash.
Base
$80
EV/FCF = ~15x CY17e
Adjusted FCF of $4.90/share
plus ~$6 in net cash
Linux Resilience and Growing Contribution from Broadened
Product Portfolio Sustains Growth.
Growing acceptance of open
source solutions, continued traction with middleware solutions,
and contribution from storage and cloud portfolio helps sustain
mid-teens billings growth through CY18. Top line growth helps
offset continued investments in cloud helping op. margins stabilize
at 24% by CY17. Overall, Red Hat sees 15% OCF growth in CY17
despite headwinds from growing cloud provider business and FX,
with lower capex yielding a ~18% FCF growth CAGR. Stock trades
at ~15x our CY17 adj. FCF estimate of $4.90 per share, plus ~$6
in net cash.
Investment Thesis
Investment Thesis
RHT’s low cost open source technology platform,
broadening product portfolio and subscription
model should sustain double-digit billings growth
as newer products gain scale and Linux grows
share in cloud environments. Investments from the
past few years in new businesses should start to
show leverage, resulting in modest margin
expansion driving stronger FCF growth.
While the RHEL business continues to mature, we
see several offsetting factors including: a faster
growing renewal base, ASP increases, JBoss
strength, an emerging storage business, new cloud
and virtualization offerings and improving
renewals.
Recently released storage and cloud technology is
not a material contributor today, but along with
OpenStack offerings, could represent compelling
call options in the long-term to current estimates
and could drive RHT shares towards our bull case.
Key Value Drivers
Key Value Drivers
Share gains by Linux within the overall OS base,
increasing conversion of free users to paid
subscription, and adoption of higher priced SKUs.
Traction of products outside the core RHEL
business, such as JBoss, Storage, PaaS and
OpenStack
Potential Catalysts
Potential Catalysts
4Q16 Earnings Results.
Growing market acceptance towards open source
platforms for large scale production environments.
Demand for new applications and toolsets native
to the Linux OS.
Risks to Achieving Price Target
Risks to Achieving Price Target
Microsoft Windows Server product cycle.
Further deceleration in core Linux drivers.
Lack of payoff from heavy investments in acquired
technologies.
Bear
$41
EV/FCF = ~8x CY17e
Adjusted FCF of $4.39/share
plus $6 in net cash
Linux Share Gains Slow, Investments Fail to Pay Dividends.
Weak server growth in CY16/CY17 and intense competition in
cloud impact RHT’s core business, while middleware portfolio stalls
and new storage portfolio fails to gain traction. Slowing growth in
RHEL are unable to be offset by PaaS/IaaS offerings. As a result,
total billings CAGR slows to 10% in CY17 as investments keep
margins relatively flat. The stock trades at ~8x our CY17 adjusted
FCF of $4.39, at the low-end of large-cap infrastructure peers, plus
~$6 in net cash per share.
Risk Reward
Risk Reward
Favorable Environment for Open Source Suggests Solid Growth Ahead
$80.00 (+12%) $71.55 $41.00 (-43%) $101.00 (+41%) 0 20 40 60 80 100 120
Mar-14 Sep-14 Mar-15 Sep-15 Mar-16 Sep-16 Mar-17
$
WARNINGDONOTEDIT_RRS4RL~RHT.N~
Price Target (Mar-17) Historical Stock Performance Current Stock Price
Analysis
Analysis
Exhibit 2:
Exhibit 2:
Morgan Stanley and Consensus 4Q16/1Q17/FY17
So u rce : Th o mso n R e u te rs, M o rg a n Sta n le y R e se a rch
Exhibit 3:
Exhibit 3:
Our Q4 Billings Forecast of 24% QoQ is Sightly Below the 5-Year Historical Average of 25%
Exhibit 4:
Exhibit 4:
Q4 Historical Billings Seasonality
So u rce : C o mp a n y d a ta , M o rg a n Sta n le y R e se a rch
Exhibit 5:
Exhibit 5:
We Model ~2% Revenue FX Headwind in 4Q16
So u rce : Th o mso n R e u te rs, M o rg a n Sta n le y R e se a rch
Exhibit 6:
Exhibit 6:
Tough YoY Comparison for Constant Currency Billings, But Our Estimates Assume a Modest
Deceleration in YoY cc Growth to ~14% from +20% cc Last Quarter
Reseller Survey Results
Reseller Survey Results
Exhibit 7:
Exhibit 7:
Reseller Performance was Balanced With an Equal Percentage Indicating Above and Below Target
Expectations; ~84% of Resellers Indicated In-line or Above Target Expectations
So u rce : M o rg a n Sta n le y R e se a rch , Pa rtn e r Su rve y, N= 32
Exhibit 8:
Exhibit 8:
Resellers Report 4% Growth in CQ1, and Expect 4% Growth YoY in CY16 and 7% Growth in CY17;
Large Resellers Project +13% for CY16 – More In-Line With Our Revenue Estimate of +15%
Exhibit 9:
Exhibit 9:
February Demand Levels in Red Hat Business Were Strong, Rebounding from January
So u rce : M o rg a n Sta n le y R e se a rch , Pa rtn e r Su rve y, N= 32
Exhibit 10:
Exhibit 10:
Median Current Quarter Growth Remained at 0% This Quarter; Average Growth Increased to
+4%, Skewed Negatively by Smaller Resellers. Resellers >$1M Reported Avg. Growth +13%
So u rce : M o rg a n Sta n le y R e se a rch , Pa rtn e r Su rve y, N= 32
Exhibit 11:
Exhibit 12:
Exhibit 12:
Net-New Server and Unix Replacements Growth Expected to Be the Primary Drivers of RHEL
Growth
So u rce : M o rg a n Sta n le y R e se a rch , Pa rtn e r Su rve y, N= 32
Exhibit 13:
Exhibit 13:
JBoss: 89% of Respondents Reporting In-line or Above Target Expectations
So u rce : M o rg a n Sta n le y R e se a rch , Pa rtn e r Su rve y, N= 19
Exhibit 14:
Exhibit 14:
RHEV Performance Declined Slightly in CQ1 With~68% Indicating They Met or Exceeded
Expectations vs. 75% Previously
to 41% from 55% Last Quarter
Exhibit 16:
Exhibit 16:
RHT: Income Statement
Exhibit 17:
Exhibit 17:
RHT: Billings Model
Exhibit 18:
Exhibit 18:
RHT: Balance Sheet
Exhibit 19:
Exhibit 19:
RHT: Cash Flow Statement
Disclosure Section
The information and opinions in Morgan Stanley Research were prepared by Morgan Stanley & Co. LLC, and/or Morgan Stanley C.T.V.M. S.A., and/or Morgan Stanley Mexico, Casa de Bolsa, S.A. de C.V., and/or Morgan Stanley Canada Limited. As used in this disclosure section, "Morgan Stanley" includes Morgan Stanley & Co. LLC, Morgan Stanley C.T.V.M. S.A., Morgan Stanley Mexico, Casa de Bolsa, S.A. de C.V., Morgan Stanley Canada Limited and their affiliates as necessary.
For important disclosures, stock price charts and equity rating histories regarding companies that are the subject of this report, please see the Morgan Stanley Research Disclosure Website at www.morganstanley.com/researchdisclosures, or contact your investment representative or Morgan Stanley Research at 1585 Broadway, (Attention: Research Management), New York, NY, 10036 USA.
For valuation methodology and risks associated with any price targets referenced in this research report, please contact the Client Support Team as follows: US/Canada +1 800 303-2495; Hong Kong +852 2848-5999; Latin America +1 718 754-5444 (U.S.); London +44 (0)20-7425-8169; Singapore +65 6834-6860; Sydney +61 (0)2-9770-1505; Tokyo +81 (0)3-6836-9000. Alternatively you may contact your investment representative or Morgan Stanley Research at 1585 Broadway, (Attention: Research Management), New York, NY 10036 USA.
Analyst Certification
The following analysts hereby certify that their views about the companies and their securities discussed in this report are accurately expressed and that they have not received and will not receive direct or indirect compensation in exchange for expressing specific recommendations or views in this report: Keith Weiss, CFA.
Unless otherwise stated, the individuals listed on the cover page of this report are research analysts.
Global Research Conflict Management Policy
Morgan Stanley Research has been published in accordance with our conflict management policy, which is available at www.morganstanley.com/institutional/research/conflictpolicies.
Important US Regulatory Disclosures on Subject Companies
As of February 29, 2016, Morgan Stanley beneficially owned 1% or more of a class of common equity securities of the following companies covered in Morgan Stanley Research: Atlassian Corporation PLC, AVG Technologies, Box Inc, FireEye Inc, MINDBODY INC, Opower Inc, Palo Alto Networks Inc, Salesforce.com, ServiceNow Inc, Splunk Inc, Tableau Software, Travelport Worldwide Limited, Varonis Systems, Inc., Veeva Systems Inc, Workday, Workiva Inc, Zendesk, Inc.
Within the last 12 months, Morgan Stanley managed or co-managed a public offering (or 144A offering) of securities of Apigee Corporation, AppFolio Inc, Atlassian Corporation PLC, Autodesk, FireEye Inc, GoDaddy Inc, HubSpot, Inc., Instructure Inc, MINDBODY INC, Nuance Communications Inc., Oracle Corporation, Rapid7 Inc, Sabre Corp, Shopify Inc, Travelport Worldwide Limited, Zendesk, Inc.
Within the last 12 months, Morgan Stanley has received compensation for investment banking services from Apigee Corporation, AppFolio Inc, Atlassian Corporation PLC, Autodesk, Box Inc, CDK Global Inc, FireEye Inc, Fortinet Inc., GoDaddy Inc, HubSpot, Inc., Imperva Inc., Instructure Inc, Intuit, MINDBODY INC, Nuance Communications Inc., Oracle Corporation, Rapid7 Inc, Sabre Corp, Shopify Inc, Splunk Inc, Travelport Worldwide Limited, Veeva Systems Inc, Zendesk, Inc.
In the next 3 months, Morgan Stanley expects to receive or intends to seek compensation for investment banking services from Adobe Systems, Akamai Technologies, Inc., Apigee Corporation, AppFolio Inc, Atlassian Corporation PLC, Autodesk, AVG Technologies, Barracuda Networks Inc, Bazaarvoice Inc, Box Inc, CDK Global Inc, Check Point Software Technologies Ltd., Citrix Systems Inc, Cvent, Descartes Systems Group Inc, EnerNOC Inc, FireEye Inc, Fortinet Inc., GoDaddy Inc, HubSpot, Inc., Imperva Inc., Instructure Inc, Intuit, Jive Software Inc, Microsoft, MINDBODY INC, NetSuite, New Relic Inc, Nuance Communications Inc., Opower Inc, Oracle Corporation, Palo Alto Networks Inc, Proofpoint Inc, QLIK Technologies Inc., Rapid7 Inc, Red Hat, Inc., Sabre Corp, Salesforce.com, ServiceNow Inc, Shopify Inc, SolarWinds, Inc., Splunk Inc, Symantec, Tableau Software, Travelport Worldwide Limited, Varonis Systems, Inc., Veeva Systems Inc, VMware Inc, Workday, Workiva Inc, Zendesk, Inc.
Within the last 12 months, Morgan Stanley has received compensation for products and services other than investment banking services from Adobe Systems, Akamai Technologies, Inc., Autodesk, Check Point Software Technologies Ltd., Citrix Systems Inc, Fortinet Inc., Intuit, Microsoft, Nuance Communications Inc., Oracle Corporation, Red Hat, Inc., Sabre Corp, Salesforce.com, Symantec, Travelport Worldwide Limited.
Within the last 12 months, Morgan Stanley has provided or is providing investment banking services to, or has an investment banking client relationship with, the following company: Adobe Systems, Akamai Technologies, Inc., Apigee Corporation, AppFolio Inc, Atlassian Corporation PLC, Autodesk, AVG Technologies, Barracuda Networks Inc, Bazaarvoice Inc, Box Inc, CDK Global Inc, Check Point Software Technologies Ltd., Citrix Systems Inc, Cvent, Descartes Systems Group Inc, EnerNOC Inc, FireEye Inc, Fortinet Inc., GoDaddy Inc, HubSpot, Inc., Imperva Inc., Instructure Inc, Intuit, Jive Software Inc, Microsoft, MINDBODY INC, NetSuite, New Relic Inc, Nuance Communications Inc., Opower Inc, Oracle Corporation, Palo Alto Networks Inc, Proofpoint Inc, QLIK Technologies Inc., Rapid7 Inc, Red Hat, Inc., Sabre Corp, Salesforce.com, ServiceNow Inc, Shopify Inc, SolarWinds, Inc., Splunk Inc, Symantec, Tableau Software, Travelport Worldwide Limited, Varonis Systems, Inc., Veeva Systems Inc, VMware Inc, Workday, Workiva Inc, Zendesk, Inc.
Within the last 12 months, Morgan Stanley has either provided or is providing non-investment banking, securities-related services to and/or in the past has entered into an agreement to provide services or has a client relationship with the following company: Adobe Systems, Akamai Technologies, Inc., Autodesk, CDK Global Inc, Check Point Software Technologies Ltd., Citrix Systems Inc, EnerNOC Inc, FireEye Inc, Fortinet Inc., GoDaddy Inc, Intuit, Microsoft, Nuance Communications Inc., Oracle Corporation, Red Hat, Inc., Sabre Corp, Salesforce.com, ServiceNow Inc, Symantec, Travelport Worldwide Limited, Workday.
An employee, director or consultant of Morgan Stanley is a director of Workiva Inc. This person is not a research analyst or a member of a research analyst's household.
Morgan Stanley & Co. LLC makes a market in the securities of Adobe Systems, Akamai Technologies, Inc., Apigee Corporation, AppFolio Inc, Atlassian Corporation PLC, Autodesk, AVG Technologies, Barracuda Networks Inc, Bazaarvoice Inc, Box Inc, CDK Global Inc, Check Point Software Technologies Ltd., Citrix Systems Inc, Cvent, Descartes Systems Group Inc, EnerNOC Inc, FireEye Inc, Fortinet Inc., GoDaddy Inc, HubSpot, Inc., Imperva Inc., Instructure Inc, Intuit, Jive Software Inc, Microsoft, MINDBODY INC, NetSuite, New Relic Inc, Nuance Communications Inc., Opower Inc, Oracle Corporation, Palo Alto Networks Inc, Proofpoint Inc, QLIK Technologies Inc., Rapid7 Inc, Red Hat, Inc., Sabre Corp, Salesforce.com, ServiceNow Inc, Shopify Inc, Splunk Inc, Symantec, Tableau Software, Travelport Worldwide Limited, Varonis Systems, Inc., Veeva Systems Inc, VMware Inc, Workday, Workiva Inc, Zendesk, Inc.
The equity research analysts or strategists principally responsible for the preparation of Morgan Stanley Research have received compensation based upon various factors, including quality of research, investor client feedback, stock picking, competitive factors, firm revenues and overall investment banking revenues.
Morgan Stanley and its affiliates do business that relates to companies/instruments covered in Morgan Stanley Research, including market making, providing liquidity, fund management, commercial banking, extension of credit, investment services and investment banking. Morgan Stanley sells to and buys from customers the securities/instruments of companies covered in Morgan Stanley Research on a principal basis. Morgan Stanley may have a position in the debt of the Company or instruments discussed in this report.
Certain disclosures listed above are also for compliance with applicable regulations in non-US jurisdictions.
STOCK RATINGS
Morgan Stanley uses a relative rating system using terms such as Overweight, Equal-weight, Not-Rated or Underweight (see definitions below). Morgan Stanley does not assign ratings of Buy, Hold or Sell to the stocks we cover. Overweight, Equal-weight, Not-Rated and Underweight are not the equivalent of buy, hold and sell. Investors should carefully read the definitions of all ratings used in Morgan Stanley Research. In addition, since Morgan Stanley
to buy or sell a stock should depend on individual circumstances (such as the investor's existing holdings) and other considerations.
Global Stock Ratings Distribution
(as of February 29, 2016)
For disclosure purposes only (in accordance with NASD and NYSE requirements), we include the category headings of Buy, Hold, and Sell alongside our ratings of Overweight, Equal-weight, Not-Rated and Underweight. Morgan Stanley does not assign ratings of Buy, Hold or Sell to the stocks we cover. Overweight, Equal-weight, Not-Rated and Underweight are not the equivalent of buy, hold, and sell but represent recommended relative weightings (see definitions below). To satisfy regulatory requirements, we correspond Overweight, our most positive stock rating, with a buy recommendation; we correspond Equal-weight and Not-Rated to hold and Underweight to sell recommendations, respectively.
COVERAGE UNIVERSE INVESTMENT BANKING CLIENTS (IBC)
STOCK RATING CATEGORY COUNT % OF TOTAL COUNT % OF TOTAL
IBC % OF RATING CATEGORY
Overweight/Buy
1216
36%
320
44%
26%
Equal-weight/Hold
1399
42%
320
44%
23%
Not-Rated/Hold
69
2%
3
0%
4%
Underweight/Sell
671
20%
89
12%
13%
TOTAL
3,355
732
Data include common stock and ADRs currently assigned ratings. Investment Banking Clients are companies from whom Morgan Stanley received investment banking compensation in the last 12 months.
Analyst Stock Ratings
Overweight (O). The stock's total return is expected to exceed the average total return of the analyst's industry (or industry team's) coverage universe, on a risk-adjusted basis, over the next 12-18 months.
Equal-weight (E). The stock's total return is expected to be in line with the average total return of the analyst's industry (or industry team's) coverage universe, on a risk-adjusted basis, over the next 12-18 months.
Not-Rated (NR). Currently the analyst does not have adequate conviction about the stock's total return relative to the average total return of the analyst's industry (or industry team's) coverage universe, on a risk-adjusted basis, over the next 12-18 months.
Underweight (U). The stock's total return is expected to be below the average total return of the analyst's industry (or industry team's) coverage universe, on a risk-adjusted basis, over the next 12-18 months.
Unless otherwise specified, the time frame for price targets included in Morgan Stanley Research is 12 to 18 months.
Analyst Industry Views
Attractive (A): The analyst expects the performance of his or her industry coverage universe over the next 12-18 months to be attractive vs. the relevant broad market benchmark, as indicated below.
In-Line (I): The analyst expects the performance of his or her industry coverage universe over the next 12-18 months to be in line with the relevant broad market benchmark, as indicated below.
Cautious (C): The analyst views the performance of his or her industry coverage universe over the next 12-18 months with caution vs. the relevant broad market benchmark, as indicated below.
Benchmarks for each region are as follows: North America S&P 500; Latin America relevant MSCI country index or MSCI Latin America Index; Europe -MSCI Europe; Japan - TOPIX; Asia - relevant -MSCI country index or -MSCI sub-regional index or -MSCI AC Asia Pacific ex Japan Index.
Important Disclosures for Morgan Stanley Smith Barney LLC Customers
Important disclosures regarding the relationship between the companies that are the subject of Morgan Stanley Research and Morgan Stanley Smith Barney LLC or Morgan Stanley or any of their affiliates, are available on the Morgan Stanley Wealth Management disclosure website at
www.morganstanley.com/online/researchdisclosures. For Morgan Stanley specific disclosures, you may refer to www.morganstanley.com/researchdisclosures.
Each Morgan Stanley Equity Research report is reviewed and approved on behalf of Morgan Stanley Smith Barney LLC. This review and approval is conducted by the same person who reviews the Equity Research report on behalf of Morgan Stanley. This could create a conflict of interest.
Other Important Disclosures
Morgan Stanley & Co. International PLC and its affiliates have a significant financial interest in the debt securities of Adobe Systems, Autodesk,
Bazaarvoice Inc, CDK Global Inc, Citrix Systems Inc, Intuit, Microsoft, NetSuite, Nuance Communications Inc., Oracle Corporation, Palo Alto Networks Inc,
Red Hat, Inc., SolarWinds, Inc., Symantec.
Morgan Stanley is not acting as a municipal advisor and the opinions or views contained herein are not intended to be, and do not constitute, advice within the meaning of Section 975 of the Dodd-Frank Wall Street Reform and Consumer Protection Act.
Morgan Stanley produces an equity research product called a "Tactical Idea." Views contained in a "Tactical Idea" on a particular stock may be contrary to the recommendations or views expressed in research on the same stock. This may be the result of differing time horizons, methodologies, market events, or other factors. For all research available on a particular stock, please contact your sales representative or go to Matrix at
http://www.morganstanley.com/matrix.
Morgan Stanley Research is provided to our clients through our proprietary research portal on Matrix and also distributed electronically by Morgan Stanley to clients. Certain, but not all, Morgan Stanley Research products are also made available to clients through third-party vendors or redistributed to clients through alternate electronic means as a convenience. For access to all available Morgan Stanley Research, please contact your sales representative or go to Matrix at http://www.morganstanley.com/matrix.
Any access and/or use of Morgan Stanley Research is subject to Morgan Stanley's Terms of Use (http://www.morganstanley.com/terms.html). By accessing and/or using Morgan Stanley Research, you are indicating that you have read and agree to be bound by our Terms of Use
(http://www.morganstanley.com/terms.html). In addition you consent to Morgan Stanley processing your personal data and using cookies in accordance with our Privacy Policy and our Global Cookies Policy (http://www.morganstanley.com/privacy_pledge.html), including for the purposes of setting your preferences and to collect readership data so that we can deliver better and more personalized service and products to you. To find out more information about how Morgan Stanley processes personal data, how we use cookies and how to reject cookies see our Privacy Policy and our Global Cookies Policy (http://www.morganstanley.com/privacy_pledge.html).
If you do not agree to our Terms of Use and/or if you do not wish to provide your consent to Morgan Stanley processing your personal data or using cookies please do not access our research.
Morgan Stanley Research does not provide individually tailored investment advice. Morgan Stanley Research has been prepared without regard to the circumstances and objectives of those who receive it. Morgan Stanley recommends that investors independently evaluate particular investments and strategies, and encourages investors to seek the advice of a financial adviser. The appropriateness of an investment or strategy will depend on an investor's circumstances and objectives. The securities, instruments, or strategies discussed in Morgan Stanley Research may not be suitable for all investors, and certain investors may not be eligible to purchase or participate in some or all of them. Morgan Stanley Research is not an offer to buy or sell or the solicitation of an offer to buy or sell any security/instrument or to participate in any particular trading strategy. The value of and income from your investments may vary because of changes in interest rates, foreign exchange rates, default rates, prepayment rates, securities/instruments prices, market indexes, operational or financial conditions of companies or other factors. There may be time limitations on the exercise of options or other rights in securities/instruments transactions. Past performance is not necessarily a guide to future performance. Estimates of future performance are based on assumptions that may not be realized. If provided, and unless otherwise stated, the closing price on the cover page is that of the primary exchange for the
compensation based upon various factors, including quality, accuracy and value of research, firm profitability or revenues (which include fixed income trading and capital markets profitability or revenues), client feedback and competitive factors. Fixed Income Research analysts', strategists' or economists' compensation is not linked to investment banking or capital markets transactions performed by Morgan Stanley or the profitability or revenues of particular trading desks.
The "Important US Regulatory Disclosures on Subject Companies" section in Morgan Stanley Research lists all companies mentioned where Morgan Stanley owns 1% or more of a class of common equity securities of the companies. For all other companies mentioned in Morgan Stanley Research, Morgan Stanley may have an investment of less than 1% in securities/instruments or derivatives of securities/instruments of companies and may trade them in ways different from those discussed in Morgan Stanley Research. Employees of Morgan Stanley not involved in the preparation of Morgan Stanley Research may have investments in securities/instruments or derivatives of securities/instruments of companies mentioned and may trade them in ways different from those discussed in Morgan Stanley Research. Derivatives may be issued by Morgan Stanley or associated persons.
With the exception of information regarding Morgan Stanley, Morgan Stanley Research is based on public information. Morgan Stanley makes every effort to use reliable, comprehensive information, but we make no representation that it is accurate or complete. We have no obligation to tell you when opinions or information in Morgan Stanley Research change apart from when we intend to discontinue equity research coverage of a subject company. Facts and views presented in Morgan Stanley Research have not been reviewed by, and may not reflect information known to, professionals in other Morgan Stanley business areas, including investment banking personnel.
Morgan Stanley Research personnel may participate in company events such as site visits and are generally prohibited from accepting payment by the company of associated expenses unless pre-approved by authorized members of Research management.
Morgan Stanley may make investment decisions that are inconsistent with the recommendations or views in this report.
To our readers in Taiwan: Information on securities/instruments that trade in Taiwan is distributed by Morgan Stanley Taiwan Limited ("MSTL"). Such information is for your reference only. The reader should independently evaluate the investment risks and is solely responsible for their investment decisions. Morgan Stanley Research may not be distributed to the public media or quoted or used by the public media without the express written consent of Morgan Stanley. Information on securities/instruments that do not trade in Taiwan is for informational purposes only and is not to be construed as a recommendation or a solicitation to trade in such securities/instruments. MSTL may not execute transactions for clients in these securities/instruments. To our readers in Hong Kong: Information is distributed in Hong Kong by and on behalf of, and is attributable to, Morgan Stanley Asia Limited as part of its regulated activities in Hong Kong. If you have any queries concerning Morgan Stanley Research, please contact our Hong Kong sales representatives.
Morgan Stanley is not incorporated under PRC law and the research in relation to this report is conducted outside the PRC. Morgan Stanley Research does not constitute an offer to sell or the solicitation of an offer to buy any securities in the PRC. PRC investors shall have the relevant qualifications to invest in such securities and shall be responsible for obtaining all relevant approvals, licenses, verifications and/or registrations from the relevant governmental authorities themselves.
Morgan Stanley Research is disseminated in Brazil by Morgan Stanley C.T.V.M. S.A.; in Mexico by Morgan Stanley México, Casa de Bolsa, S.A. de C.V which is regulated by Comision Nacional Bancaria y de Valores. Paseo de los Tamarindos 90, Torre 1, Col. Bosques de las Lomas Floor 29, 05120 Mexico City; in Japan by Morgan Stanley MUFG Securities Co., Ltd. and, for Commodities related research reports only, Morgan Stanley Capital Group Japan Co., Ltd; in Hong Kong by Morgan Stanley Asia Limited (which accepts responsibility for its contents) and by Bank Morgan Stanley AG, Hong Kong Branch; in Singapore by Morgan Stanley Asia (Singapore) Pte. (Registration number 199206298Z) and/or Morgan Stanley Asia (Singapore) Securities Pte Ltd (Registration number 200008434H), regulated by the Monetary Authority of Singapore (which accepts legal responsibility for its contents and should be contacted with respect to any matters arising from, or in connection with, Morgan Stanley Research) and by Bank Morgan Stanley AG, Singapore Branch (Registration number T11FC0207F); in Australia to "wholesale clients" within the meaning of the Australian Corporations Act by Morgan Stanley Australia Limited A.B.N. 67 003 734 576, holder of Australian financial services license No. 233742, which accepts responsibility for its contents; in Australia to "wholesale clients" and "retail clients" within the meaning of the Australian Corporations Act by Morgan Stanley Wealth Management Australia Pty Ltd (A.B.N. 19 009 145 555, holder of Australian financial services license No. 240813, which accepts responsibility for its contents; in Korea by Morgan Stanley & Co International plc, Seoul Branch; in India by Morgan Stanley India Company Private Limited; in Indonesia by PT Morgan Stanley Asia Indonesia; in Canada by Morgan Stanley Canada Limited, which has approved of and takes responsibility for its contents in Canada; in Germany by Morgan Stanley Bank AG, Frankfurt am Main and Morgan Stanley Private Wealth Management Limited, Niederlassung Deutschland, regulated by Bundesanstalt fuer Finanzdienstleistungsaufsicht (BaFin); in Spain by Morgan Stanley, S.V., S.A., a Morgan Stanley group company, which is supervised by the Spanish Securities Markets Commission (CNMV) and states that Morgan Stanley Research has been written and distributed in accordance with the rules of conduct applicable to financial research as established under Spanish regulations; in the US by Morgan Stanley & Co. LLC, which accepts responsibility for its contents. Morgan Stanley & Co. International plc, authorized by the Prudential Regulatory Authority and regulated by the Financial Conduct Authority and the Prudential Regulatory Authority, disseminates in the UK research that it has prepared, and approves solely for the purposes of section 21 of the Financial Services and Markets Act 2000, research which has been prepared by any of its affiliates. RMB Morgan Stanley (Proprietary) Limited is a member of the JSE Limited and regulated by the Financial Services Board in South Africa. RMB Morgan Stanley (Proprietary) Limited is a joint venture owned equally by Morgan Stanley International Holdings Inc. and RMB Investment Advisory (Proprietary) Limited, which is wholly owned by FirstRand Limited. The information in Morgan Stanley Research is being disseminated by Morgan Stanley Saudi Arabia, regulated by the Capital Market Authority in the Kingdom of Saudi Arabia , and is directed at Sophisticated investors only.
The information in Morgan Stanley Research is being communicated by Morgan Stanley & Co. International plc (DIFC Branch), regulated by the Dubai Financial Services Authority (the DFSA), and is directed at Professional Clients only, as defined by the DFSA. The financial products or financial services to which this research relates will only be made available to a customer who we are satisfied meets the regulatory criteria to be a Professional Client. The information in Morgan Stanley Research is being communicated by Morgan Stanley & Co. International plc (QFC Branch), regulated by the Qatar Financial Centre Regulatory Authority (the QFCRA), and is directed at business customers and market counterparties only and is not intended for Retail Customers as defined by the QFCRA.
As required by the Capital Markets Board of Turkey, investment information, comments and recommendations stated here, are not within the scope of investment advisory activity. Investment advisory service is provided exclusively to persons based on their risk and income preferences by the authorized firms. Comments and recommendations stated here are general in nature. These opinions may not fit to your financial status, risk and return preferences. For this reason, to make an investment decision by relying solely to this information stated here may not bring about outcomes that fit your expectations. The trademarks and service marks contained in Morgan Stanley Research are the property of their respective owners. Third-party data providers make no warranties or representations relating to the accuracy, completeness, or timeliness of the data they provide and shall not have liability for any damages relating to such data. The Global Industry Classification Standard (GICS) was developed by and is the exclusive property of MSCI and S&P.
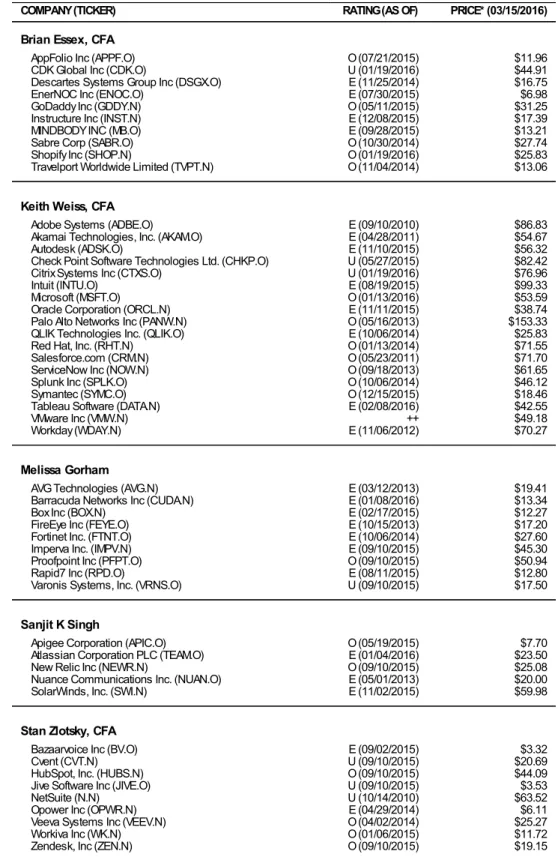
INDUSTRY COVERAGE: Software
COMPANY (TICKER) RATING (AS OF) PRICE* (03/15/2016)
Brian Essex, CFA
AppFolio Inc (APPF.O) O (07/21/2015) $11.96
CDK Global Inc (CDK.O) U (01/19/2016) $44.91
Descartes Systems Group Inc (DSGX.O) E (11/25/2014) $16.75
EnerNOC Inc (ENOC.O) E (07/30/2015) $6.98
GoDaddy Inc (GDDY.N) O (05/11/2015) $31.25
Instructure Inc (INST.N) E (12/08/2015) $17.39
MINDBODY INC (MB.O) E (09/28/2015) $13.21
Sabre Corp (SABR.O) O (10/30/2014) $27.74
Shopify Inc (SHOP.N) O (01/19/2016) $25.83
Travelport Worldwide Limited (TVPT.N) O (11/04/2014) $13.06
Keith Weiss, CFA
Adobe Systems (ADBE.O) E (09/10/2010) $86.83
Akamai Technologies, Inc. (AKAM.O) E (04/28/2011) $54.67
Autodesk (ADSK.O) E (11/10/2015) $56.32
Check Point Software Technologies Ltd. (CHKP.O) U (05/27/2015) $82.42
Citrix Systems Inc (CTXS.O) U (01/19/2016) $76.96
Intuit (INTU.O) E (08/19/2015) $99.33
Microsoft (MSFT.O) O (01/13/2016) $53.59
Oracle Corporation (ORCL.N) E (11/11/2015) $38.74
Palo Alto Networks Inc (PANW.N) O (05/16/2013) $153.33
QLIK Technologies Inc. (QLIK.O) E (10/06/2014) $25.83
Red Hat, Inc. (RHT.N) O (01/13/2014) $71.55
Salesforce.com (CRM.N) O (05/23/2011) $71.70
ServiceNow Inc (NOW.N) O (09/18/2013) $61.65
Splunk Inc (SPLK.O) O (10/06/2014) $46.12
Symantec (SYMC.O) O (12/15/2015) $18.46
Tableau Software (DATA.N) E (02/08/2016) $42.55
VMware Inc (VMW.N) ++ $49.18
Workday (WDAY.N) E (11/06/2012) $70.27
Melissa Gorham
AVG Technologies (AVG.N) E (03/12/2013) $19.41
Barracuda Networks Inc (CUDA.N) E (01/08/2016) $13.34
Box Inc (BOX.N) E (02/17/2015) $12.27
FireEye Inc (FEYE.O) E (10/15/2013) $17.20
Fortinet Inc. (FTNT.O) E (10/06/2014) $27.60
Imperva Inc. (IMPV.N) E (09/10/2015) $45.30
Proofpoint Inc (PFPT.O) O (09/10/2015) $50.94
Rapid7 Inc (RPD.O) E (08/11/2015) $12.80
Varonis Systems, Inc. (VRNS.O) U (09/10/2015) $17.50
Sanjit K Singh
Apigee Corporation (APIC.O) O (05/19/2015) $7.70
Atlassian Corporation PLC (TEAM.O) E (01/04/2016) $23.50
New Relic Inc (NEWR.N) O (09/10/2015) $25.08
Nuance Communications Inc. (NUAN.O) E (05/01/2013) $20.00
SolarWinds, Inc. (SWI.N) E (11/02/2015) $59.98
Stan Zlotsky, CFA
Bazaarvoice Inc (BV.O) E (09/02/2015) $3.32
Cvent (CVT.N) U (09/10/2015) $20.69
HubSpot, Inc. (HUBS.N) O (09/10/2015) $44.09
Jive Software Inc (JIVE.O) U (09/10/2015) $3.53
NetSuite (N.N) U (10/14/2010) $63.52
Opower Inc (OPWR.N) E (04/29/2014) $6.11
Veeva Systems Inc (VEEV.N) O (04/02/2014) $25.27
Workiva Inc (WK.N) O (01/06/2015) $11.72
Zendesk, Inc (ZEN.N) O (09/10/2015) $19.15
Stock Ratings are subject to change. Please see latest research for each company. * Historical prices are not split adjusted.