Welcome to Tableau Server
As a companion to Tableau Desktop Professional Edition, Tableau Server allows you and others to share discoveries through an interactive and collaborative web experience. People using Tableau Desktop can create visual representations of data to answer simple to complex questions. These representations are called views. With Tableau Server, authors can then publish workbooks full of views so that others can see and interact with the data.
How to Use the Help
When you need assistance, click theHelpmenu at the top of the page. A help menu with topics relevant to the page you are on opens.
Sign In
In most cases you must have an account on Tableau Server to both publish and browse. Additionally, you must be assigned a Viewer or Interactor license level. User accounts are set up by an administrator. They are either based on your Windows user account, using Active Directory, or on the Tableau Server internal user management system. Contact your administrator if you do not know your user name or password.
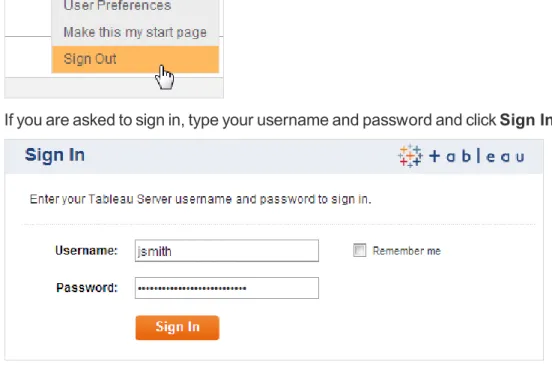
Sometimes, depending on how the server is configured, you will be automatically signed in. If you are automatically signed in as the wrong person, you can switch to your account by clicking Sign Outon the server menu in the upper right corner of the page:
If you are asked to sign in, type your username and password and clickSign In.
Remembering your User Name
Selecting theRemember mecheck box on the Tableau Server Sign In page will automatically fill in your user name every time you visit the server. This option makes it easier for you to quickly access your account. You will still need to type your password on each visit in order to sign in. WhenRemember meis selected at sign-in, Tableau Server creates a username cookie to remember you when you return to the site from the same computer. To stop automatically filling in your username, clear your browser cookies.
Tableau Server always stores a session cookie when you sign in, whether or not you've also selectedRemember me. For this reason, your browser must be configured toallow first-party cookies.
Signing in to a Site
If you are a member of a single site on Tableau Server, choosing a site is not part of the sign-in process, it happens automatically. The top of the server page looks similar to this:
If you belong to multiple sites, the name of your current site is displayed on the Sites menu:
Signing in with SAML
If Tableau Server is configured for SAML authentication, you will not see aTableau Server Sign In prompt. Instead, you'll see a prompt from an external identity provider (IdP). For example:
After you sign in with SAML enabled, you will not see aSign Outcommand on the Tableau Server user menu. This is because your sign in was handled by the IdP, not Tableau Server. To sign out from Tableau Server, you must also use your IdP.
Browse Tableau Server
When you first sign in to Tableau Server, you are shown a list of views. The views are sorted in alphabetical order by name. The page contains several tools that help you browse and find views on the server:
Navigate the Server
There are different ways to browse Tableau Server, using either the navigation links on the left or the page controls.
Navigation Links
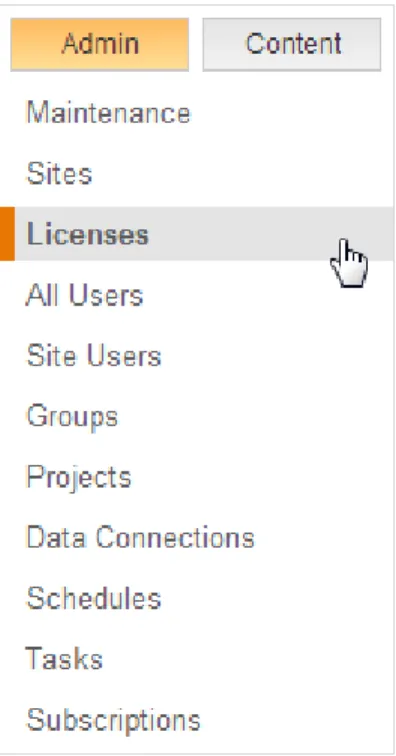
The navigation area on the left is divided into an Admin tab, which is only viewable by system and site administrators, and a Content tab, which can be seen by all server users:
Admin
If you are a system administrator, you can see everything on the server and you have every capability. Site administrators can see all the areas an administrator can except for the Sites and Licenses pages. For the areas that they can see, site administrators generally have fewer abilities. The ability for site administrators to add users to a site is something that system administrators can allow or prevent (see Add or Edit Sites).
Content
The Projects area links to a list of projects on the server. A project is a collection of related workbooks. Administrators create and maintain projects. See Projects to learn more.
Page Controls
If there are multiple pages, you can advance through the pages using theNextandPrevious links at the bottom of the page. Alternatively, you can jump to a specific page by typing the page number into the text box and pressing Enter on your keyboard.
You can increase or decrease the number of items shown on each page by entering the number of items you want to see and pressing Enter.
Sheet Tabs
Workbooks often contain multiple sheets, including individual views and dashboards. Authors can optionally publish these workbooks where the sheets are shown as tabs along the top of the page (using the Tableau Desktop optionShow Sheets as Tabs). When you’re working with a tabbed workbook, you can easily navigate between the sheets using the sheet tabs.
Advance Through Pages
Some views may have several pages, which split up the data based on the values of a specific field. A common example is a view that shows a separate page for every year, quarter, or month. Pages help you compare data and find outliers. Each page uses the same axis range, so as you move between the pages you can easily see how the data is changing.
If the view has pages, the page control displays so you can navigate the pages. You can use the left and right arrows to scroll through each page or use the drop-down menu in the middle to jump to a specific page. Finally, you can use the slider to scrub through the pages.
For example, in the view below, the pages are defined by Years. You can use the page control to look at GDP and percent of internet usage for each year.
SelectShow Historyon the page control to include the marks from previous pages as you move from page to page and when you select marks. The author of the view can specify how the historical marks should display.
Your User Preferences Page
The options on your User Preferences page affect your individual Tableau Server web sessions. Use them to manage your subscription settings, specify your start page, change the language and locale you see in Tableau Server, clear cookies for data connection passwords, or change your Tableau Server password. You can also use this page to quickly browse items that you've published.
To access your User Preferences page, click your username at the top of the page and select User Preferencesfrom the drop-down menu:
Change Your Email Address
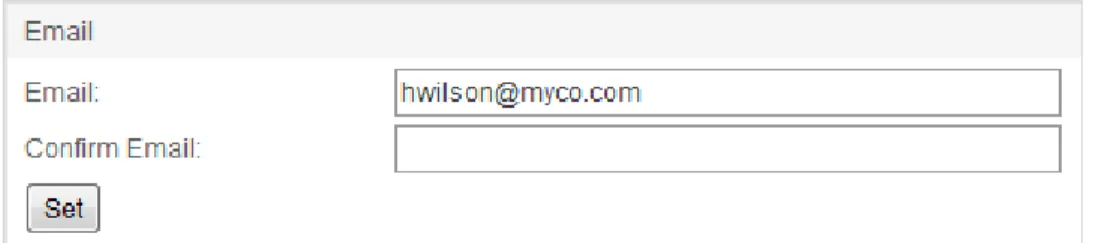
If you have a subscription for a Tableau Server view or workbook, the email account that receives the subscription is listed on the User Preferences page:
To enter or change the email address that Tableau Server sends subscriptions to, enter the new email address in theEmailtext box, enter it again in theConfirm Emailtext box, then selectSet:
Manage Your Subscription Settings
Use the Subscription options to change the schedule for any subscriptions you're receiving. This is also where you can unsubscribe from a view. For steps, seeUnsubscribe from a View andChange Subscription Settings.
Customize Your Start Page
Tableau Server installs withViewsas the default start page for all users, but the administrator can specify a different start page. To figure out what your start page is, clickGo to start page:
You can designate a different start page for yourself by navigating to the server page you want, such asWorkbooks, and selecting theMake this my start pagecommand from the upper right drop-down menu:
To return to using the start page designated by your administrator, on your User Preferences page, clickReset to default:
Language and Locale
TheLanguagesetting controls the language you see for the Tableau Server user interface andLocaleaffects things in views, such as how numbers are formatted, or which currency is used. Your administrator can configure these settings for all server users, but you can change them here, just for yourself. If you do change the settings, note that they will only take effect if they are a supported language. See Language and Locale to learn more.
After you make yourLanguageandLocaleselections, clickSet.
The next time you sign in, the settings are used for your server sessions.
Change Your Tableau Server Password
If the server is configured to use the internal user management system (Local Authentication) instead of Active Directory, you can change your Tableau Server password by clicking Change password. When you click this link you are asked to enter yourCurrent Password and theNew Password(twice). After you've typed in the required information, clickChange to save the changes.
Clear Your Saved Data Connection Passwords
If you access a view or workbook that has a live database connection and requires you to authenticate, Tableau offers to save your password for you. If you accept, it stores your credentials in a cookie. ClickClear Allunder Saved Data Connection Passwords to remove the cookie from Tableau Server:
Browse Your Published Items
Your user account page lists all of the workbooks, tags, and comments that you've published. Use this page to quickly browse your own activity on the server.
Perform Actions
If you have been granted the Interactor license level, or if you are an administrator, you have access to commands at the top of many server pages that allow you to, for example, set permissions, add tags, or delete views and workbooks.
You can use the commands in combination with the check box that displays next to each item in the list. Instead of selecting items individually, you can use the drop-down to selectAllitems, just the ones on the currentPage, orNoneof the items.
Instead of the drop-down menu, you can click the check box at the top of the list multiple times to toggle between these options. The check box updates to indicate what items are selected.
All items selected across mul-tiple pages
All items selected on the cur-rent page only
No items selected
After you have selected items, you can apply relevant actions such assetting permissionsor adding tags.
Search Content
You can use the search box on the left of the page in combination with the filters below it to quickly find views and other items. You can also use search attributes and operators in what you enter for search.
Use Filtered Search
The drop-downs forProject,Publisher, andTagshow you what's been defined on the server, and theModified on or After/Before,FavoritesandRecently Usedfilters can help you further narrow your search:
To remove a filter, click theXto the right of the filter value:
To remove all filters, clickClear Allat the top:
Use Attributes with Search
In addition to a general search, you can limit search on Tableau Server to a specific attribute such as name, workbook, data source, and so on. For example, typingname:sales projections (with no spaces on either side of the colon) returns only items whose names contain the words salesorprojections. Search operators, meanwhile, help you specify the type of search you want performed.
This
attrib-ute... Followed by... Returns
name: search term Items whose names match the search term
title: search term Views whose titles match the search term
caption: search term Views whose captions match the search term
publisher: user name Items that were published by the spe-cified users
project: search term Items that are part of a project whose name matches the search term
comment: search term Views whose comments match the search term
tag: search term Items whose tags match the search term
field: search term
Views with matching fields on the rows, columns, level of detail, pages, or encoding shelves
type:
workbook, view, data-source, pro-ject
Items that are of the matching type
sheettype: view or dashboard Views that are of the matching sheet type
class: type of data source (e.g., mysql)
Views and data sources that are asso-ciated wtih the matching type of data source
dbname: name of database Views and data sources that are asso-ciated with the matching data source
tablename: search term Views and data sources that are asso-ciated with the matching table name
nviews: number Workbooks that contain the specified number of views
You can include multiple attributes to further limit a search. For example, to find all dashboards that were published by Smith, you can type the following into the search field:
sheettype:dashboard publisher:smith.
Use Search Operators
Sometimes you may want to create searches with logical operations on Tableau Server. For example, you may want to search for all items that don't match a specific term. Or you may want to find items that match one term or another term but don't have to match both. You can useand,or,not, and*to build search expressions.
Operator Definition Examples
and
Returns items that match both search terms.
salesandmarketing; pensandpaper
or
Returns items that match either search term.
westoreast; soccerandfootball
not
Excludes items that match the search term following this operator
notsheettype:dashboard
*
Acts as a substitute for any other char-acter or word fol-lowing or as part of the search term. This operator can be used by itself or at the end of the search term. This operator is use-ful when you don’t know the exact term you are searching for.
dev*sales*
Spaces and Search
If your search term includes any spaces, punctuation, or the actual wordsand,or, ornot, enclose your search term in quotes.
Use Lists
As you browse Tableau Server you will notice that items are either displayed as thumbnails or in lists. Icons at the top of Workbooks and View pages let you specify whether contents should
be displayed as lists or as thumbnails:
You can quickly toggle between these two states by clicking the list and thumbnail icons:
Sort Thumbnails
Depending on the type of items you are listing, you may be able to sort by the following categories:Name,Project, number ofSheets, the lastModifieddate, andPublisher. How you sort depends on whether you are looking at thumbnails or a text list. A sorted list is grouped by the selected category with titles showing the different groupings. For example, the view thumbnails below are sorted alphabetically in ascending order (A-Z), note that the sort arrow is pointing up:
Sort Lists
In a text list, you can use the column heading to sort the list. Again the arrow indicates whether the items are sorted in ascending (up arrow) or descending (down arrow) order. Click the column heading you want to use to sort the list.
In the list view anEditcolumn is sometimes available. You can select a view and clickEditto modify the view, on the server. For details on how to do this, see Edit and Create Views.
As you continue to change the sort on a list of workbooks, views, or projects; the server remembers your last three sort options and applies them as a multi-column sort. For example, if you sort by the dateModifiedand then sort byProject, the list will be
grouped by project and within each project the workbooks or views will be sorted by date modified.
Store Favorites
You can mark any view or workbook to store it as one of your favorites so you can quickly find it in the future. Favorites are kept on the Favorites menu in the upper-right corner:
On the Favorites menu, views have a icon and workbooks have a icon. If you have a large number of favorites, you can use the scrollbar on the right to see all of them:
You can quickly search for certain favorites using the search box at the top:
Add a Favorite
You can create a favorite from either the thumbnail or list view of the Workbooks and Views pages. From the thumbnail view, create a favorite by hovering the cursor over a view or workbook and then selecting the Favorites star on the tooltip that appears:
From the list view, create a favorite by clicking the star next to the view or workbook you want to store as a favorite:
The view or workbook is added to your Favorites menu.
Remove a Favorite
From the list view, just click the star to remove the view or workbook as a favorite:
Save Passwords
Sometimes a view requires you to enter a database user name and password. If you have access to the database you should enter your Username and password into the appropriate text boxes. If you select theRemember my passwordoption you will be automatically signed in each time you look at the view. Your sign in information is stored encrypted on the server so you will be automatically signed in even between browser sessions and when accessing the view from multiple computers. This is convenient when you have a select number of views that you access all the time.
Note:
Administrators can restrict whether to allow users to remember database passwords. If you are an administrator, see Maintenance Settings to learn more.
Clearing and Resetting Saved Passwords
If your passwords are being saved (Saved Passwordsis enabled on the Maintenance page), you can clear your saved passwords. When you do this, the next time you visit the server, you are prompted to enter your username and password. You may want to do this if your username and password change so you can begin using and saving your new credentials.
1. Open your User Preferences page from the upper right drop-down menu:
2. Under Saved Data Connection Passwords, clickClear All.
Administrators can also clear all saved passwords on the server using theClear all saved passwordsfor all users link on the Maintenance page.
Work with Views
After you find a view or dashboard that interests you, you can view and interact with the data in many different ways. Exactly how depends on two things: your license level and the
permissions set by the author of the view. See Work with Permissions to learn more.
Share Views
Every published view and workbook can be shared via email or embedded into another webpage, wiki, or web application. Anyone viewing a shared view must have an account on Tableau Server and permission to access the view.
Email a View
You can easily email a link to a view by clicking theSharelink in the upper left corner of the view. Then copy and paste the provided link into your email message.
Embed Views
You can share a view by embedding it into another webpage such as your wiki, blog, or web application. Click theSharelink in the upper left corner of the view and copy and paste the provided HTML code.
Adjust an Embedded View’s Appearance
You can change how an embedded view looks by adjusting theDisplay Options. There you can specify a fixed width, height, and whether to show the toolbar or tabs.
Explore Data via Tooltips
Tooltips are additional data details that display when you hover over one or more marks in a view:
Tooltips also offer easy ways to quickly filter or remove marks, and view data:
l Keep Only: Displays only what you’ve selected in the view. l Exclude: Removes what you’ve selected from the view.
l View Data: Opens a window displaying the data. You can view the summarized data or
the underlying data.
To filter or exclude a group of marks, just select them and click the action you want to perform:
To look at the summarized or underlying data, make a selection and click the View Data icon:
The data on theSummarytab displays the aggregated data in the view or in your selection within the view:
The data inUnderlyingdisplays the values for each row in the data source—as restricted by the mark or marks you’ve selected:
SelectingShow all columnsdisplays all columns in the underlying data source, whether or not the data is in the view:
Download all rows as a text fileusing the links at the top and bottom of the table:
Subscribe to Views
If you can see a view on Tableau Server and it has a subscription icon ( ) in the upper right corner, your administrator has configured subscriptions for your site and you can subscribe to the view. This means that, on a regular interval, you can have a snapshot of the view
automatically delivered to your email inbox—without having to sign in to Tableau Server. You can also subscribe to workbooks. Instead of receiving a single view, you receive every view in the workbook in a single email. You can change which subscription schedule you're using, or unsubscribe. See below for details.
Subscribe to a View
1. Select theViewsorWorkbookspage:
2. Click a view or workbook.
4. If your Tableau Server account hasn't already been associated with an email address, you are prompted to provide one. Enter your email address and clickNext.
5. In the next dialog, select a subscription schedule. By default, Tableau Server provides a weekday mornings schedule and a Monday morning schedule. The Tableau Server administrator can also create custom subscription schedules.
6. Next, choose whether you want to subscribe to a single view (This Sheet)or the entire workbook (Sheets in Workbook) and clickSubscribe.
7. Later, when you receive the subscription by email, click the snapshot of the view and it opens on Tableau Server:
Unsubscribe from a View
To unsubscribe from a view or workbook:
1. Access your User Preferences page on Tableau Server by clicking the link at the bottom of a subscription email:
You can also open your User Preferences page from the Tableau Server drop-down menu:
3. ClickUpdate.
Change Subscription Settings
To change your subscription schedule:1. Open your User Preferences page:
2. UnderSchedule, select a different schedule:
Sort Data
You can quickly change the sort order for items in a view using the Sort buttons on an axis, field label, or header. For example, the view below shows oil output by well. If you mouse over the vertical axis, a sort button appears that displays the sort it will perform when you click it—in this case, an ascending sort:
Once you sort, the sort icon stays on the vertical axis:
Click the Sort icon again, and it sorts in descending order, from lowest output to highest output:
A third click returns the bar chart to its original state:
You can always revert to the entire view’s original state using theRevert Allbutton on the toolbar.
Filter Data
With an Interactor license level, you can filter data in a view so you can narrow the visualization to the data of interest. For example, a regional sales report may show sales for several different regions. You can focus on how your region is doing using filters. Then you can revert the filters to return to the original view and compare your region to others. There are two ways to filter the view: quick filters and theKeep Only and Exclude tooltip commands.
Types of Quick Filters
There are many different types of quick filters. The author of the view chooses the type of filter that best shows the values you are filtering. Each type of filter and how you can interact with it is described below.
Quick Filter Type Description
Multiple Values List
Shows a list of checkboxes. Select the values to include.
Single Value List
Shows a list of radio buttons. Select one value at a time to include.
Compact List
Shows a drop-down list of values. Select one value at a time to include.
Slider
Shows values along a range. Drag the slider or use the arrows to select a single value to include. For quantitative values use the two sliders to specify a range of values.
Wildcard Match
Shows a text field. Include all values that contain a specific set of characters. You can use the asterisk
Quick Filter Type Description
symbol (*) as a wildcard character. Type In
Shows a text field. Type a value and click the plus symbol to include it in the filter. Alternatively, copy and paste a list of values into the text field.
Date Filters
Date filters can be shown in most of the filter types described above. However, there are a few more types that are specific to dates. For example, relative date filters allow you to include common date ranges such as “last 3 weeks” or “year to date.” Or you can select from a collection of predefined date periods such as 1 day, 1 week, 3 months, etc.
Multiple Value List (Hierarchical)
If the view uses a multidimensional data source, the multiple value list shows the hierarchical levels. Use the level selectors at the top to select all values at the given level.
Filtering Options
Many quick filters have additional options that display when you hover the pointer over the filter area on the page. For example, sometimes it is easier to select what you don't want to see than all the things that you do want. Options on the drop-down menu for a multiple value list let you switch between anInclusiveandExclusivefilter. Each type of filter has its own set of options available in the drop-down menu in the upper right corner of the filter area. The availability of these options is controlled by the author of the view.
In addition, if a filter contains a lot of values, you can use the search to quickly find and select what you're looking for. Click theSearchbutton that shows when you hover the pointer over the quick filter. Then start typing the value you are looking for. The results show directly below the search box making it easy to select.
Finally, you can limit the values shown in a quick filter using theShow More Values/Show Fewer Valuesbutton. When you show more values, all values from the field are displayed. When you show fewer values, the other active filters are considered. Only values that pass all of the filters are shown. For example, a view may be filtered to show sales greater than $5000 in the Western and Central regions. When you show more values, the Region filter will show all regions. When you show fewer values, the Region filter will only show regions where sales are greater than $5000.
Reverting Filters
If at anytime you want to restore the filters to how they were when the view was published, use theRevert Allbutton.
Export Views
You can export the view as anImageorPDF. Alternatively, you can export the data as a Crosstabor a comma separated value file (Data). Select an option on theExportmenu on the toolbar at the top of the view.
If you are exporting a dashboard to a PDF and thedashboard includes a web page object, the web page object is not included. Also, when you select an export option, the image, PDF or data file must be generated. A message opens when it is done
generating so you can continue downloading the file.
To export a view as a PDF:
1. Open a view and from the Export toolbar button, selectPDF:
3. Choose whether to print the entire workbook, dashboard, or only certain sheets. Clicking the highlighted thumbnail for a sheet excludes it from the export:
4. ClickOK, then, in the Export PDF dialog box, clickDownload. Your PDF displays, ready to be printed:
Zoom and Pan Maps
To help you navigate views that include maps, a zoom toolbar appears when you mouse over a map in a view. The toolbar lets you zoom in and out, select marks, return the map to its initial state, and it allows you to pan:
If the workbook author chooses to hide the zoom controls (in Tableau Desktop:View > Zoom Controls > Hide), you will not see the zoom toolbar.
Each mode is described below:
Zoom:Zoom in on a map view to see more detail.
Select:Select marks in a map view to identify a subset of the data.
Home:Restore the map view to its original state.
Pan:Click and hold your mouse button for several seconds. Then move the mouse to pan your view of a map up and down as well as left and right. When panning, the cursor icon will look like a closed hand instead of the usual pointer. Panning a map is particularly useful when you have zoomed in on a view, and want to move the view around to see other areas of interest.
Pause Automatic Updates
As you interact with the view on the server, it will sometimes have to send a query to the data source to update the data in the view. If you are working with a dense view with a lot of data or a very large data source, the automatic update may take a long time. To avoid waiting for each update while you make several changes you can clickPause Automatic Updateson the toolbar.
When youResume Automatic Updatesusing the same toolbar button you only have to wait for a single query to the data source.
Refresh Data
If the data source is changed, such as new fields have been added or data values and field names have been modified, the view will reflect those changes the next time you load the page.
However, you may need to manually update the view using theRefresh Databutton on the toolbar.
When you refresh the data, you clear any cache that may exist and retrieve the latest data from the data source. This option is different than the Pause Automatic Updates option, which still
may load the view based on cached data. Depending on the size of your data source and the view, refreshing the data may take longer than other queries that operate on cached data.
Download Workbooks
Workbooks can be downloaded using theDownloadlink in the upper right corner of the view. The downloaded workbook can be opened with a version of Tableau Desktop. Downloading the workbook from the server is the same as selectingServer>Open Workbookin the desktop application. The workbook can only be opened if it is still published to the server.
This option is only available if you've been given theDownload/Web Save Aspermission by the author of the workbook or an administrator. See Work with Permissions to learn more.
Follow Hyperlinks
Many views contain hyperlinks to either outside URLs or other sheets. These hyperlinks are added by the author and can be useful for getting more information about a set of data points. Based on how the view was authored, hyperlinks can be launched in one of the following three ways:
l Select- Click a mark in the view.
l Hover- Rest the pointer over the mark in the view.
l Screen tip- The hyperlink is available in the screen tip that displays when you rest the
Links to Web Pages
A view may link to an outside webpage to show more information about the data. For example, a map view might link from a specific location to show a satellite image. Or, a sales report may link from a selection of products to show the current inventory status on an internal intranet. When you click a link it takes you to the external webpage, which is outside of Tableau Server. Webpages can also be embedded into a dashboard. In this case, clicking a link loads the webpage in the same window.
Links to Other Views
In addition to linking to external webpages, some views will have hyperlinks to other views on Tableau Server. These links filter data in the target view based on your selection in the source view. For example, in the dashboard shown below, selecting a product in the list of Top Selling Products filters the map view to show where the product is sold.
Highlight Marks, Legends & Actions
Highlighting is a way to call attention to a subset of data in a view. There are three ways to highlight on Tableau Server: using marks, legends, or actions.
Use Marks to Highlight
When you select one or more marks in a view, all other marks are dimmed so that your selection stands out. Select individual marks or click and drag the pointer to select a bunch of marks. Hold the Ctrl key on your keyboard to select multiple marks in the view.
Use Legends to Highlight
You can use the legends (color, shape, and size) to highlight the marks that correspond to each item in the legend. For example, if a view is colored by product category, you can quickly highlight a certain type of product using legend highlighting. To enable legend highlighting:
1. Click the Highlight button that displays in the upper right corner when you rest the pointer over the legend.
2. Select an item in the legend:
3. You can hold the Ctrl key on your keyboard to select multiple items in the legend. Turn legend highlighting off by selecting theHighlightbutton again.
Highlight Actions
Some views may have Highlight Actions, which highlight related data in one or more views based on your selection in a source view. Highlight Actions are primarily used in dashboard views where multiple views are shown at once. For example, in the dashboard view below there is a highlight action set up to highlight on Region. When West is selected in the scatter plot all the other views highlight the West category.
Depending on the how the view was authored, Highlight Actions can be launched either by selecting a mark, resting the pointer over a mark, or in the screen tip that displays when you rest the pointer over a mark for a period of time.
Tag Views
A tag is keyword that describes a view and can help you categorize and find views. Authors can add tags to views when they publish views. Once a view is published to a Tableau server, you can add tags to any view you have access to, and you can delete any tags you have added. In a published view, theTagstext box is located below the view:
Add Tags
You can add tags to any view on the server that you have permission to access. Tags are not case sensitive and are converted to lower case when you add them.
To add tags to a single view:
Type one or more words into theTagstext box below the view and click Add. Words can be separated by spaces or commas.
To add tags to multiple views:
If you have an Interactor license level, you can also add tags to multiple views at once. 1. Navigate to a list of views or workbooks.
2. Select the views you want to tag and clickTagat the top of the page. If no tags already exist you canAddone:
If tags already exist, select a tag:
Delete Tags
You can delete any tags that you have created. 1. Open the tagged view.
2. Scroll to theTagstext box below the view. 3. Click the 'x' next to the tag you want to remove.
Comment on Views
You can add comments to any view you have access to on Tableau Server. You can also see any comments associated with a particular view.
You can add formatting to your comment by inserting hyperlinks, bolding, italics, and
underlining. Examples of how to add each of these types of formatting are shown in the table below.
Format What to Type Example
Hyperlink “My Link”:http://www.tableausoftware.com My Link
Bold *Bold Text* Bold Text
Italics _Italic Text_ Italic Text
Underline +Underlined Text+ Underlined Text
Custom Views (Remember my Changes)
You may have a view you make the same changes to every time you open it. For example, you may apply a certain filter to only include data relevant to you, or you may sort a view differently than how it was published. You may also want to keep different versions of the same view—for example, one with two filters selected, and another with only one selected. If you have an Interactor license level, instead of making these changes every time you open the view, Tableau can remember your changes as one or more custom views. You can also share, or “advertise,” your customized views with other users. Users with Interactor or Viewer licenses can look at views that other users have advertised.
See the following topics for more information:
Access Remember my changes
TheRemember my changessetting displays above the views area when you first look at a published view (or below if you’re looking at an embedded view):
If there are custom versions of a view, the first time you look at the view as it was published it will sayOriginal View. After you click the drop-down menu and select one of the custom views, the name of that view is displayed.
Save Your Custom View
As you filter, sort, and interact with a view, a gray dot appears next to theRemember my changesmenu or the name of the view. The dot indicates that changes have been made. Use this menu to save your changes as a custom view.
Any custom views that you or others create will always be related to the original view. As the original view is updated or republished, customized versions of the view are also updated. If the original view is deleted from the server, its related custom views are also deleted. If filters are removed from the original view and it’s republished, the filters will be unavailable in customized versions of the view. If filters are restored and the view is republished, customized versions of the view are restored.
Here are more details on how to save a custom view: 1. Open the individual view that you want to customize.
2. Filter the data, change sort orders, highlight, zoom in or out, etc.
3.
Click theRemember my changeslink or the name of the custom view. Then type a name for your custom view and clickRemember.
To make your custom view the one you see by default when you first open the view, select Change default to <custom view name>. The word(Default)displays to the right of the custom view’s name, indicating that this version of the view is your default.
Advertise Your Custom View
By default your custom view is private and only you can see it on your list. If your license level is Interactor, you can choose to advertise it to others. Anyone who has access to the original published view will be able to see your advertised custom view.
Note:
Even if you don’t advertise your custom view, you can still share it by copying the URL or clicking the Share button.
1. When you're looking at the custom view you want to advertise, click the name of the view and then clickManage Custom Views.
2. Under Manage Custom Views, click the icon next to the name of the view to switch between advertised and private. The single person icon indicates it is private and the two-person icon means the view is advertised.
Access Other Custom Views
As you browse views, you can access other people's saved, advertised custom views by clicking theOriginal Viewlink. If theOriginal Viewlink is available, that means there are customized versions of the view available. Custom views from other people are listed in the Other Custom Views section of the drop-down menu.
Make Your View Private
You can make an advertised view private again. When a custom view is private, it no longer shows in the drop-down list for others and only you can see it on your list.
1. When you're looking at the custom view you want to stop advertising, click the name of the view and then clickManage Custom Views.
2. Under Manage Custom Views, click the icon next to the name of the view to switch between shared and private. The two-person icon indicates it is advertised and the single person icon means the view is private.
Delete a Custom View
At any time you can delete a custom view. Removing your custom view does not affect the original view.
1. When you're looking at the custom view you want to delete, click the name of the view and then clickManage Custom Views.
3. After removing a custom view, you can clickUndoto restore the custom view. The Undo button is not available after you click Done.
Edit and Create Views
Users with the appropriate credentials for the web editing environment can edit existing workbooks or create new ones.
When you sign in to Tableau Server, the Views section appears by default. Views that you have access to appear here as a result of either of the following processes:
l A Tableau Desktop user publishes the workbook containing the view to Tableau Server. l A user creates the view and saves the workbook directly in the Tableau Server web
edit-ing environment.
Who Can Create, Edit, and Save Views
Administrators can always edit and save existing workbooks, or create new workbooks. They also can assign permissions to other users and groups for editing and saving views in
workbooks in the server web authoring environment, as well as other actions that can be performed on the server.
Set User License and Publishing Levels
Administrators assign a license level and user rights when they create or modify users. To allow users to edit workbooks, first, provision the users as follows:
l The user must have theInteractorlicense level. l The user must be granted thePublishuser right.
For more information, see Users and Licenses and User Rights.
Allow Editing and Saving Workbooks
After you set up users or groups, set license levels, and grant publishing rights, you need to set permissions at theprojectandworkbooklevels, depending on the type of editing you want to allow. Among the list of task-level permissions that administrators can allow or deny users and groups, the primary permissions for editing and saving views include the following:
l Web Editdetermines whether the user can edit workbook views through web
authoring.
l Download/Web Save Asdetermines whether the user sees theSaveandSave As
commands while they are editing a view, whether they can save their changes to a new workbook. Also determines whether users can open a workbook on the server using Tableau Desktop.
l Write/Web Savedetermines whether users can save changes to an existing workbook
on the server (overwrite a workbook).
To allow a user or group to save changes to existing workbooks or to new workbooks, set these three task-level permissions according to the tables in the following sections.
Allow users to save changes to existing and new workbooks
Permission For the
project
For appropriate work-books in the project
Web Edit Allow Allow
Download/Save
As Allow Allow
Write/Save Allow Allow
In this scenario, because permissions are set the same way for both projects and workbooks, if you want to apply project-level permissions changes to all workbooks within the project, you can selectAssign Permissions to Contentswhile on the Permissions: Project page.
Allow users to save new but not overwrite existing workbooks
Permission For the
project
For appropriate work-books in the project
Web Edit Allow Allow
Download/Save
As Allow Allow
Write/Save Allow Deny
Important: In this scenario, permissions must be set manually on each workbook. If you selectAssign Permissions to Contentsas described in Allow users to save changes to existing and new workbooks, project permissions overwrite the workbook
permissions, thereby granting users access to save changes to existing workbooks.
Permissions for views within workbooks
Permissions for views in workbooks are inherited from the workbook permissions when a user publishes a workbook from Tableau Desktop.
If a user selectsShow sheets as tabswhen publishing a workbook from Tableau Desktop or saving it on Tableau Server, the workbook permissions override the permissions on individual views, until the workbook is saved again without tabs.
For more information, see Permissions and also the knowledge base articleCreating Project-Based Permissions.
If you are not an administrator, you can find out if you are authorized to edit a view by opening it and then checking to see if anEditcommand appears above the viewer area.
Create a Workbook and Build a View
You can build a new view by creating a new sheet in an existing workbook or by creating a new workbook. This topic shows how to build a view in a new workbook.
The following procedure uses theSuperstoresample data source that comes with Tableau Desktop, and is published to Tableau Server, to build a view that incorporates information about sales by category and region. If you have access to the Superstore sample data source, you can perform the steps in the procedure.
1. On theContenttab, selectData Sources.
2. In the data sources list, select the check box next to the data source you want to visualize, and then selectNew Workbook.
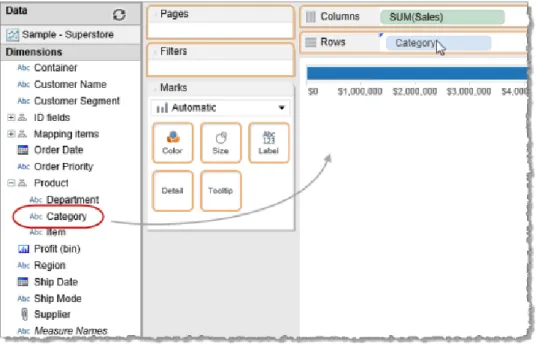
A new, blank view opens in the Tableau Server authoring environment. 3. From the Measures pane, dragSalesto the Columns shelf.
4. From the Dimensions pane, expandProductto display its sub-categories, and then dragCategoryto the Rows shelf.
Tableau now has enough to convert the data into a visualization (view), in this case a horizontal bar chart.
5. From the Dimensions pane, dragRegionto the Rows shelf.
The view now contains another layer of data—the categories are broken out by region. Now suppose you want to view and compare sales by category in a single region. You can accomplish this using a filter.
6. From the Dimensions pane, dragRegionto the Filters shelf.
As you hover over the Filters shelf, a small triangle at the left of the field indicates that you can dropRegiononto the shelf.
A Filter control appears at the right edge of the page.
7. Clear the check boxes for all but one region that you want to analyze, and then select them all again.
8. You can enhance the visualization using color. DragRegiontoColoron the Marks card.
You now have a useful view that allows you to compare sales of different product categories across regions:
Tip: To learn about selecting a different color palette for the bars or resizing them, see Marks Card.
9. Instead of focusing on regional sales of each product, maybe you prefer a view that lets you more easily analyze a region’s overall product sales. On the Rows shelf, drag Regionto the left ofCategory.
10. If you decide that you prefer the previous version of the view, you can clickUndoin the Toolbar.
11. If you want to create a second worksheet, select theNew Worksheettab at the bottom of the view.
Select the worksheet tab and selectRename Worksheetto give it a more descriptive name.
following steps:
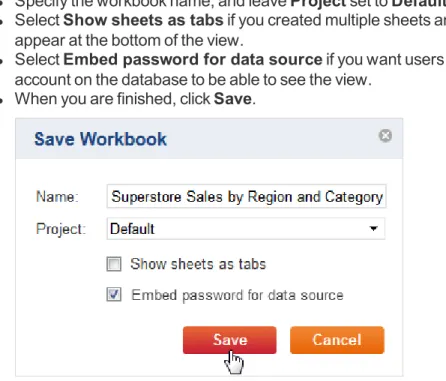
l Specify the workbook name, and leaveProjectset toDefault.
l SelectShow sheets as tabsif you created multiple sheets and want their tabs to
appear at the bottom of the view.
l SelectEmbed password for data sourceif you want users who do not have an
account on the database to be able to see the view.
l When you are finished, clickSave.
Edit a View
In the Views section, you can open a view for editing either of the following ways:
l ClickEditin the tooltip that appears when you hover the pointer over a thumbnail view. l Select a view to display it, and then clickEditat the top of the view.
If the workbook publisher did not embed database credentials, you are prompted to provide them.
Tableau Server Authoring Environment
The server web authoring environment is similar to Tableau Desktop. The Data window appears on the left side, showing the names of the data sources included in the workbook, and the fields, parameters, and sets included in the active data source.
Likewise, in the main area, atoolbarappears across the top,Markscard andPagesand Filtersshelves to the left of the view, andColumnsandRowsshelves above the view. Any sheet tabsincluded in the workbook appear at the bottom of the view.
When you open a view for editing, you can edit the other views in the same workbook, but not dashboards. You can also select theNew Sheettab to begin creating a new view.
For details about how to use each of these components to edit views, see the topics listed at the bottom of this topic.
Saving or Discarding Changes
While you are working with a view, you can save or discard changes at any time, using the links above the view area.
When you save your work, even though you entered the authoring environment from a single view, the complete workbook is saved, including other views you may or may not have edited.
l Saveoverwrites the original workbook.
If you want to keep both the original version of a view and your edited version, useSave Asto create a new workbook.
If you selectShow sheets as tabs, the workbook permissions override the permissions on individual views, until the workbook is saved again without tabs.
l Revertdiscards edits and returns to the last saved version of a view. l Doneexits the authoring environment.
If you have unsaved changes, you are prompted to save them. If you do not save changes, the unsaved changes are still present when you return to the authoring mode for that view, for as long as you remain signed in to the current server session.
How you can save workbooks depends on the permissions granted by your administrator. For more information, see Who Can Create, Edit, and Save Views.
Toolbar
When you are editing a view, you can use the toolbar at the top of the view to perform common actions.
Undo/Redo
Undo and redo an action or series of actions. You can undo or redo almost any type of change in the view by selecting these toolbar buttons.
Pause Updates
When you place a field on a shelf, Tableau generates the view by querying the data source. If updates seem slow when editing the view, you can pause updates while making a series of edits, then turn them on again.
Swap
This moves the fields on the Rows shelf to the Columns shelf and vice-versa. Most used with view types that are based onx- andy-axes.
Totals
You can automatically compute grand totals and subtotals for the data in a view. Select Totals to see four options:
l Show Column Grand TotalsAdds a row showing totals for all columns in the view. l Show Row Grand TotalsAdds a column showing totals for all rows in the view. l Add All SubtotalsInserts subtotal rows and columns in the view, if you have multiple
dimensions in a column or row.
l Remove All SubtotalsRemoves subtotal rows or columns.
Show/Hide Labels
View Size
Use the options underView Sizeto change the proportions of your view within the browser window, and go back and forth between seeing details and seeing the whole picture. The Cell Size commands have different effects depending on the type of visualization.
Worksheet
Contains options for making changes at the worksheet level. Create worksheets, modify sheet names, clear sheet formatting, or clear the entire sheet.
Export
Use the options under Export to capture parts of your view for use in other applications.
l Image: Displays the view or dashboard as an image in a new browser tab.
l Data: Displays the data from the view in a new browser window with two tabs:
Sum-mary, showing aggregated data for the fields shown in the view, andUnderlying, show-ing underlyshow-ing data for the selected marks in the visualization. If the new window does not open, you may need to disable your browser's popup blocker.
l Crosstab: Saves the underlying data for the selected marks in the visualization to a
CSV (comma-separated values) file which can then be opened in Microsoft Excel.
l PDF: Opens the current view as a PDF in a new browser window. From there you can
save it to a file. If the new window does not open, you may need to disable your browser's popup blocker.
Show Me
Opens a control that shows a range of visualization types that you can use in Tableau. When you display the Show Me list, Tableau uses the data in the current view to determine which visualization types to make available for you to select. Among the available types, it draws a different color outline around the one that it determines is the best match for your data. You can also hover over a visualization type to see what field types are required to make that visualization type available.
Data Window
At the top of the Data window is a list of available data sources for the workbook. If you are editing an existing workbook, there may be multiple data sources. Select a data source to see the dimensions and measures for that data source. If you are creating a new workbook, you see just the data source from which you created the workbook.
All data sources contain fields. These fields appear below the list of data sources in the Data window. Dimensions and measures always appear, other field types appear if they are present in the data source:
l Dimensionsare fields that contain discrete qualitative data. Examples of dimensions
include dates, customer names, and customer segments.
l Measuresare fields that contain numerical data that can be aggregated. Examples of
measures include sales, profit, number of employees, temperature, frequency, and pressure.
l Setsare custom fields that define a subset of data based on some conditions. A set may
be based on a computed condition, which updates as the data changes, or a constant list of values. Sets may be present in workbooks that you edit, but you cannot create sets.
l Parametersare dynamic values that can replace constant values in calculations, filters,
and reference lines. Parameters may be present in workbooks that you edit, but you cannot create parameters.
To build visualizations, you drag fields from the Data window to the Rows and Columns
shelves, the Marks card, or one of the other available shelves. For a demonstration, see Create a Workbook and Build a View.
Columns and Rows Shelves
Drag fields to the Columns shelf to create the columns of a table, or to the Rows shelf to create the rows of a table. You can drag multiple fields to either shelf.
Discrete values (typically, dimensions) are displayed in blue on the Columns and Row shelves; continuous values (typically, measures) are displayed in green.
At the right end of any field you place on the Columns or Rows shelf is a drop down menu that you can use to configure the dimension or measure:
The options that are available depend on the type of field. The complete list of options includes:
l Include in Tooltip
By default, all fields on the Columns and Rows shelf are included in the tooltips that appear when you move your mouse over one or more marks in the view. Un-check this option to remove a field from tooltips.
Choose this option to add a filter for this field to the view. Users will then be able to specify which data to include and exclude for this dimension or measure.
l Discrete/Continuous
Use these options to convert a continuous range of values into a set of discrete values, or a discrete set into a continuous range.
l Dimension/Attribute/Measure
Use this range of options to convert a dimension to a measure or a measure to a dimension.
You can also define the option as an Attribute, which returns the value of the given expression if it only has a single value for all rows in the group, and otherwise displays an asterisk (*) character. Null values are ignored.
l Quick Table Calculation
Provides a set of options for redefining the meaning of the marks for the value.
l Remove
Removes the value from the Columns or Rows shelf.
Options for Date Dimension
An additional set of options is available for date dimensions:
Choose one of the options from the upper group to define the granularity of the data as discrete values. For example, if you chooseMonthyour view will combine the data for each named month in your data across the full range of years:
There are exactly twelve marks in the data--one for each month. The November mark combines the data from November 2008, November 2009, etc.
Choose one of the options from the lower group to define the granularity of the data as continuous values. For example, if you choose Month your view will show your data sequentially, over the range of available months.
Marks Card
When you drag fields to the view, the data are displayed using marks. Each mark represents the intersection of all of the dimensions in the view. For example, in a view with Region and Year dimensions, there is a mark for every combination of those two field (East 2011, East 2012, West 2011, West 2012).
Marks can be displayed in many different ways including lines, shapes, bars, maps, and so on. You can show additional information about the data using mark properties such as color, size, shape, labels, etc. The type of mark you use and the mark properties are controlled by the Marks card. Drag fields to the Marks card to show more data. For example, the same view above is shown again below but this time with Profit on Color. With this additional information, it is clear that the Southern region was not profitable in 2010.
Control the marks in the view using the Marks card. Use the drop-down menu to specify the type of mark to show. Drag fields to the Marks card and use the drop-down controls to add more information to the view and control the color, shape, size, labels, and number of marks in the view.
Mark Types
Mark Properties
You can control the colors, size, shape, and other properties of the marks in the view. Drag a field to a property on the Marks card to encode the marks using your data.
The properties available vary among mark types. For example, the Shape property is available only for the Shape mark type, and the Angle property is available only for the Pie mark type. The properties are:
Property Description
Color
Encodes data by assigning different colors to the marks in a data view based on the values of a field.
Quantitativecolor palettes are applied to continuous fields, such as a profit measure.Categoricalpalettes are applied to discrete fields, such as a field representing geographic regions.
Change the color palette or transparency by selecting Color, and then using the palette control and slider.
Size
Separates marks according to the members in a dimension, and assigns a unique size to each member. Because size has an inherent order (small to big), categorical sizes work best for ordered data like years or quarters.
To change the overall size of marks in the view, select Size, and drag the slider.
Label/Text
Encodes data by assigning text labels to the marks. When working with a text table, this property is called Text, and it shows the numbers associated with a data view.
To display or hide the labels on marks, select Label, and then select or clear the check box.
Detail
When you place a dimension on the Rows or Columns shelf, the categorical members create table headers. The headers represent levels of detail because they separate the data source rows into specific categories. You can identify each category by the member name.
The Detail property also allows you to separate the marks in a data view according to the members (levels of detail) of a dimension. However, unlike the Rows and Columns shelf, this property does not modify the table structure.
Tooltip Adds the field name and value to the tooltip for each mark.
Path
Allows you to encode data by connecting marks using a particular drawing order. You can path-encode your data using either a dimension or a measure. When you place a dimension on Path, Tableau connects the marks according to the members in the dimension. If the dimension is a date, the drawing order is given by the date order. If the dimension holds words such as customer names or product types, the drawing order is given by the order of the members in the data source. When you place a measure on Path, Tableau connects the marks according to the values of the measure.
The Path property is available only when you select the line or polygon mark type from the Mark menu.
Shape Separates the marks according to the members in the dimension, and assigns a unique shape to each member.
Filters Shelf
Use the Filters shelf to specify which data to include and exclude for a dimension or measure. For example, you might want to analyze the profit for each customer segment, but only for certain shipping containers and delivery times. By placing the Container dimension on the Filters shelf you can specify which containers to include. Similarly, you can put the Delivery Date field on the Filters shelf to define which delivery times to include.
When you drag a dimension or measure to the Filters shelf, Tableau automatically inserts a filter control into the view for selecting the values to display. For example:
For dimensions, the filter control shows discrete values, as above. For measures, the control shows a continuous range:
Hover your mouse to the right of the title for the filter control to specify how values in the control are to be displayed:
Pages Shelf
Drag a dimension or measure to the Pages Shelf to break a view into a series of pages so you can better analyze how a specific field affects the rest of the data in a view. Dragging a
dimension to the Pages shelf is like adding a new row for each member in the dimension. Dragging a measure to the Pages shelf automatically converts the measure into a discrete measure that can be broken into individual pages.
When you drag a dimension or measure to the Pages shelf, Tableau automatically inserts a control into the view to let you navigate the pages in your view. For example:
You can manually advance through the sequence of pages in any of the following ways:
l Use the drop-down menu to select a value.
l Use the forward and back buttons on either side of the drop-down list to navigate
through the pages one at a time.
l Use the Page slider to quickly scroll forward and backward in the sequence of pages.
SelectShow Historyto show marks from previous pages in addition to marks for the current page.
Tooltips
Place your cursor over a mark in the view to see the tooltip for that mark.
Tooltips provide information on the values of dimensions and measures for the selected mark:
Tooltips also provide these options:
l Keep Only
Exclude all marks from the view except this one.
l Exclude
Exclude this mark only.
l Group Members
Choose the paperclip icon to create a new group, which is a dimension, from the selected mark. Typically, you would select multiple marks and then create a group. For example, if you have a dimension Region with values North, South, East and West, you could select South and West and then create a group from them.
l View Data
Choose the table icon to open a new browser window to display two tabs:Summary, which shows only data for the current mark, andUnderlying, which shows data for the entire view.
Work with Permissions
What you can do with views, workbooks, projects, and data sources on Tableau Server is controlled by both your license level (specified by an administrator) and the permissions set by the author of the view or data source.
You can change permissions for an item if you have an Interactor license level and at least one of the following is true:
l You are the owner of the workbook or data source (you published it to the server). l You have been assigned the Set Permissions permission.
l You have been assigned the Project Leader permission for the project that contains the
item.
l You have been granted the Admin right.
See the following topics for more information:
How Permissions are Set
If a workbook is configured to show sheets as tabs, all views inherit the workbook permissions even if different permissions are specified on an individual view.
Set Permissions for Workbooks and Views
Follow the steps below to set permissions for a workbook or a view.
1. From a page that displays one or more workbooks, or one or more views, click to select one or more workbooks or views, then clickPermissions:
2. ClickAdd/Edit Permissionsin the Permissions: Workbook or Permissions: View page:
TheAssign Permissions to Contentsoption is shown for workbooks but not for views.
You can configure the list to show users, groups, or both.
4. Select a predefined role from theRoledrop-down menu, or specify individual
permissions in the area below. The list of permissions and the predefined roles vary a bit depending on whether you are setting permissions for a workbook or a view. See Permissions for a table that defines the various permissions and what items they apply to.
The available roles for workbooks and views are:
Role Applies
to... Description
Viewer workbooks
views
Allows the user or group to view the workbook or view on the server.
Interactor workbooks views
Allows the user or group to view the workbook or view on the server, edit workbook views, apply filters, view underlying data, export images, and export data. All other permissions are inherited from the user's or group's project permissions.
Editor workbooks
views Allows all permissions to the user or group
Data Source
Con-nector views
Allows the user or group to connect to the data source on the server. This permission is relevant for views when accessing a view that connects to
a data source.
Data Source Editor views
Allows the user or group to connect to data sources on the server. Also to publish, edit, down-load, delete, and set permissions for a data source, and schedule refreshes for data sources you publish. This permission is relevant for views when accessing a view that connects to a data source.
5. You can configure permissions for one user or group, or for multiple users and groups. When you are finished, clickSubmit.
Set Permissions for a Data Source
Follow the steps below to set permissions for a data source.
1. From the Data Sources page, click to select one or more data sources, then click Permissions.
2. ClickAdd/Edit Permissionsin the Permissions: Data Source page: