Adaptive TCP Flow Control for Improving Performance of Mobile Cloud Clusters
by
Seungbae Lee
A dissertation submitted to the Graduate Faculty of Auburn University
in partial fulfillment of the requirements for the Degree of
Doctor of Philosophy Auburn, Alabama
May 4, 2014
Keywords: mobile device, mobile ad hoc cloud, Hadoop mobile cluster, distributed computing performance, analytic data flow, TCP flow control
Copyright 2014 by Seungbae Lee
Approved by
Alvin Lim, Chair, Associate Professor of Computer Science and Software Engineering
David Umphress, Associate Professor of Computer Science and Software Engineering Sanjeev Baskiyar, Associate Professor of Computer Science and Software Engineering
Abstract
Significant innovations in mobile technologies are enabling mobile users to make real-time actionable decisions based on balancing opportunities and risks in order to take co-ordinated actions with others in the workplace. This requires a new distributed analytic framework that collects relevant information from internal and external sources, performs real-time distributed analytics, and delivers a critical analysis to any user at any place in a given time frame through the use of mobile devices such as smartphones and tablets.
This work discusses the benefits and challenges of building mobile cloud clusters using recent mobile devices for distributed analytic applications by showing its feasibility with MapReduce framework and also investigates performance issues of Hadoop mobile clusters by conducting extensive experiments using typical Hadoop benchmarks; the newest release of Hadoop software framework with its enhancements is ported to the latest Android-based mo-bile devices through momo-bile virtualization technique. In addition, it develops the MapReduce simulator based on the ns-2 network simulator to comprehensively examine the performance and efficiency of mobile cloud clusters in extensive operating environments, which enables it to identify critical performance issues under different cluster (or workload) scales, dynamic node mobility, and various wireless channel conditions.
From the performance analysis this work identifies TCP (Transmission Control Proto-col) communication problems resulting from distinct traffic patterns of MapReduce-based Hadoop distributed framework and proposes adaptive TCP flow control algorithms for im-proving the performance of mobile cloud clusters. The overall computing power of the mobile cluster is no longer significantly bounded by typical processing capabilities of each individ-ual mobile node as mobile devices have been constantly enhanced, but the mobile cluster has limitations on interchanging large amounts of analytical data among mobile devices and
monitoring real-time status of cluster nodes through timely state updates, which result in significant delays in the processing time with corresponding performance degradation.
This work proposes an algorithm for cross-layer TCP flow control and dynamic network resource scheduling to avoid frequent overflows of the MAC (Media Access Control) layer transmit queue on the mobile nodes, which interrupt long-lived analytical data streams required for the partition and aggregation workflow of distributed analytic frameworks. It controls TCP’s packet transmission based on the queueing level and implements dynamic resource scheduling for incoming and outgoing frames to minimize the queueing delay and stabilize the queueing level. In the evaluation test, the aggregate throughput of peer-to-peer TCP connections was significantly improved without incurring any throughput collapse.
In order to prevent TCP receive buffer overflows on the controller node due to the use of TCP push packets, which involve many interruptions in the reception of the latest status up-dates and progress reports from its worker nodes, this work also introduces another algorithm for mitigating the adverse effects of the TCP push flows that cause excessive transmissions from fast congestion window growth and frequent RTO (retransmission timeout) underesti-mation. It moderates the congestion window outburst and skips the RTO estimation using RTT (round-trip time) updates from the TCP push streams when the buffer overflow is de-tected. In the Hadoop TeraSort benchmark test, there were marked decreases in frequency of receive buffer overflows and TCP packet retransmissions and the overall processing time could be shortened accordingly.
Table of Contents
Abstract . . . ii
List of Figures . . . vii
List of Tables . . . ix
1 Introduction . . . 1
1.1 Recent mobile trends in the workplace . . . 1
1.1.1 Mobile device capabilities . . . 2
1.1.2 Mobility in the workplace . . . 3
1.1.3 Actionable analytics . . . 4
1.2 Different types of mobile cloud computing . . . 4
1.2.1 Remote and local cloud services . . . 6
1.2.2 Ad hoc cloud and other concepts . . . 6
2 Background and related work . . . 9
2.1 Overview of Apache Hadoop for cloud clusters . . . 9
2.1.1 Apache Hadoop . . . 9
2.1.2 MapReduce programming model . . . 10
2.1.3 Hadoop distributed filesystem . . . 10
2.1.4 MapReduce task execution . . . 11
2.2 Overview of TCP flow control for performance analysis . . . 13
2.2.1 Sliding window flow control . . . 13
2.2.2 Packet loss detection mechanisms . . . 16
2.2.3 Congestion window dynamics . . . 17
2.3 Related studies on mobile cloud clusters . . . 19
2.3.2 Network problems of traditional cloud . . . 21
2.3.3 MapReduce performance prediction using simulation . . . 22
3 Understanding performance issues of Hadoop mobile clusters . . . 23
3.1 Hadoop benchmarks for performance evaluation . . . 23
3.2 Assumptions on mobile cloud clusters . . . 26
3.3 Performance experiments of Hadoop mobile clusters . . . 27
3.3.1 Experimental setup . . . 27
3.3.2 I/O performance of mobile nodes . . . 32
3.3.3 Performance of WordCount workload . . . 34
3.3.4 Performance of TeraSort workload . . . 35
3.3.5 Performance of scale testing . . . 39
3.4 Performance simulations of Hadoop mobile clusters . . . 42
3.4.1 MRPerf simulator for MapReduce . . . 43
3.4.2 Implementation and validation of MapReduce simulator . . . 44
3.4.3 Performance of scale testing . . . 46
3.4.4 Performance over different radio propagations . . . 49
3.5 Performance issues of Hadoop mobile clusters . . . 51
4 Problem statements and research questions . . . 54
4.1 Limitations on TCP performance over mobile devices . . . 54
4.2 Problems of using mobile devices for mobile cloud . . . 55
4.3 Research questions . . . 56
5 Adaptive TCP flow control for mobile clusters . . . 58
5.1 Queueing level control for transmit queue overflow . . . 58
5.1.1 Analysis of MAC-layer transmit queue overflow . . . 58
5.1.2 Transmit queueing level control algorithm . . . 62
5.2 TCP push flow control for receive buffer overflow . . . 63
5.2.2 TCP push flow control algorithm . . . 69
6 Evaluation of proposed solutions . . . 72
6.1 Transmit queueing level control algorithm . . . 72
6.1.1 Performance improvement of peer-to-peer data transfer . . . 72
6.1.2 Performance improvement in data aggregation . . . 76
6.2 TCP push flow control algorithm . . . 77
6.2.1 Packet analysis of Hadoop master running TeraSort . . . 77
6.2.2 Performance improvement of TeraSort workload . . . 80
7 Conclusion . . . 83
7.1 Summary . . . 83
7.2 Discussion . . . 84
List of Figures
1.1 CPU performance improvement of Apple and Samsung’s smartphones . . . 2
1.2 Different types of mobile cloud computing . . . 5
2.1 Data flows in MapReduce task execution . . . 12
2.2 Sliding window based TCP data transfer process . . . 15
2.3 Upper bound of TCP congestion window growth . . . 15
3.1 Experimental mobile cluster using Google NEXUS 7 . . . 28
3.2 Mobile virtualization for MapReduce implementation . . . 31
3.3 Network and filesystem throughput of mobile nodes . . . 33
3.4 Network utilization of Hadoop mobile cluster with WordCount workload . . . . 35
3.5 Resource utilization of MapReduce nodes running WordCount tasks . . . 36
3.6 Network utilization of Hadoop mobile cluster with TeraSort workload . . . 37
3.7 Resource utilization of MapReduce nodes running TeraSort tasks . . . 38
3.8 Cluster size scaling of WordCount and TeraSort experiments . . . 39
3.9 Data block size scaling of TeraSort experiments . . . 40
3.10 Input size scaling of WordCount experiments . . . 41
3.11 Architecture of MRperf simulator . . . 43
3.12 Screenshot of MapReduce simulation . . . 44
3.13 Validation of MapReduce simulation with TeraSort workload . . . 45
3.14 Cluster size scaling of TeraSort simulations . . . 47
3.16 Simulation area scaling with node mobility . . . 49
3.17 MapReduce simulations with different radio propagation models . . . 51
5.1 TCP packet transmitting process of mobile nodes . . . 59
5.2 Data flows between master and slave nodes . . . 64
5.3 Comparison of Hadoop data and heartbeat flow . . . 66
5.4 TCP packet receiving process of master node . . . 67
6.1 Evaluation setup for transmit queueing level control . . . 73
6.2 TCP performance of mobile nodes with different MAC queue sizes . . . 74
6.3 TCP performance with modified network stack . . . 75
6.4 TCP throughput of original and modified network stack . . . 76
6.5 Resource utilization of master node running TeraSort workload . . . 78
6.6 Traffic patterns of cluster nodes running TeraSort workload . . . 78
6.7 TCP packet analysis of master node . . . 79
6.8 Zero Window advertisements of original and modified TCP . . . 80
List of Tables
1.1 Internal hardware sensors of Samsung Galaxy S4 smartphone . . . 3
3.1 Hadoop benchmarks and their characteristics . . . 25
3.2 Hardware and software specifications of experimental nodes . . . 29
3.3 Comparison of Java and Dalvik bytecode . . . 30
3.4 Hadoop configurations of the experimental mobile cluster . . . 32
3.5 Simulation configurations of the Hadoop mobile cluster . . . 46
5.1 Parameters for transmit queue overflow analysis . . . 60
5.2 Variables for transmit queueing level control algorithm . . . 61
5.3 Parameters for receive buffer overflow analysis . . . 68
Chapter 1 Introduction
Many IT industry analysts predict that mobile growth is one of the most significant trends for the forthcoming years. In recent years, mobile technologies have matured and become suitable for a wider range of use, which creates new opportunities and demands for emerging platforms and services including mobile computing, hybrid cloud, and actionable analytics.
According to International Data Corporation (IDC) estimates, the recent surge in de-mand for mobile systems will continue to lead market growth of smartphones and tablet computers surpassing PC sales [1]. Gartner, Inc. also forecasts sales of 1.9 billion mobile phones in 2014, a 5 percent increase from 2013. In 2014, the worldwide tablet market is forecast to grow 47 percent with lower average selling prices attracting new users while world-wide shipments of traditional PCs are forecast to a 7 percent decline from 2013 [2].
The rising demand for mobile devices and mobility-related services has led smartphones and tablets to become far more powerful. Mobile devices with a quad-core 1.9 GHz processor and 2 GB memory are already widely available. Even octa-core processors and 3 GB memory modules for mobile devices are planned for release at the time of writing this dissertation. Along with enhancements in battery capacity and network capability, mobile devices are now capable of sharing their resources for distributed processing of critical data analytics as resource providers of cloud computing.
1.1 Recent mobile trends in the workplace
20070 2008 2009 2010 2011 2012 2013 2014 0.5 1 1.5 2 2.5 3 3.5 4 4.5x 10 4 iPhone 3G 3GS 4 4S 5 5S Release date
CPU benchmark rating
Apple iPhone series
2010 2011 2012 2013 2014 0 0.5 1 1.5 2x 10 4 Galaxy S S2 S3 S4 Release date
CPU benchmark rating
Samsung Galaxy S series
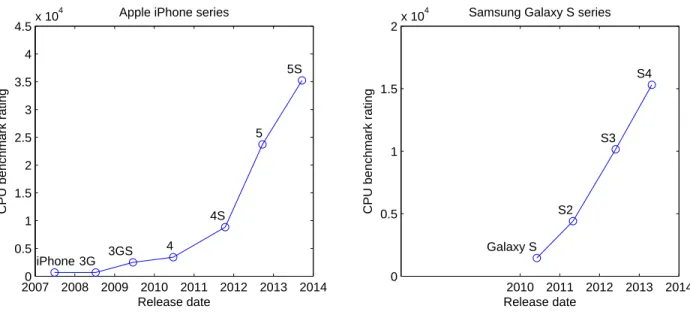
Figure 1.1: CPU performance improvement of Apple and Samsung’s smartphones
their own mobile devices to their workplace and use those devices to access privileged in-formation and run applications of their organization. It provides a great opportunity for improving productivity by accelerating the speed of decision-making and problem-solving and by allowing more flexibility.
1.1.1 Mobile device capabilities
The strong demand for diverse mobile devices and applications has led smartphones and tablets to offer the latest advanced features. Mobile platforms are leveraging multi-core processor architecture to dramatically increase processing power at a low cost. Manufactur-ers are introducing high-speed memory and increasing storage capacity for mobile devices. Moreover, advances in battery capacity and power saving techniques enable mobile devices to support large complex computations and long-running processes and provide more reli-able high-speed wireless connectivity with more optional features, including 4G LTE, Wi-Fi, Bluetooth, and Near Field Communication (NFC). Figure 1.1 shows the CPU performance improvement (CPU benchmark results from PassMark [4]) of two flagship smartphones from
Table 1.1: Internal hardware sensors of Samsung Galaxy S4 smartphone
Sensors Features
Accelerometer Detects the mobile phone movement state based on three axes
Barometer Identifies the atmospheric pressure at the user’s current location
Geomagnetic sensor Detects magnetic field intensity based on three axes
Gesture sensor Recognizes the user’s hand movements using infrared rays
Gyro sensor Detects the mobile phone rotation state based on three axes
Hall sensor Recognizes whether the cover is open or closed
Proximity sensor Recognizes whether the mobile phone is located near the user by using
infrared rays
RGB light sensor Measures the red, greed, blue, and white intensity of the light source
Temperature sensor Checks temperature level
Humidity sensor Detects humidity level
Apple and Samsung Electronics, iPhone and Galaxy S series, which run mobile operating systems of Apple iOS and Google Android, respectively.
Furthermore, recent mobile devices provide innovative visual interaction through the use of advanced high-resolution touchscreens. Also, they integrate a variety of sensors that are constantly being improved, which include microphones, image sensors, 3-axis accelerometers, gyroscopes, atmosphere pressure sensors, digital compasses, optical proximity sensors, ambi-ent light sensors, humidity sensors, touch sensors, etc, as detailed in Table 1.1. These cutting edge touchscreens and sensors enable mobile devices to monitor the operating environment in real time and adapt to the situation accordingly.
1.1.2 Mobility in the workplace
Today, people are connected in more ways than before. By using mobile devices, they no longer need to sit in front of desktop computers at office or at home in order to search for information and communicate with other people. People are creating new connections anywhere, anytime, and on any device. Mobility is having a huge impact on the way people work by saving time and resources and by opening new opportunities for innovation. A recent
IDC report shows the world’s mobile worker population will reach 1.3 billion, representing 37.2% of the total workforce by 2015 [5]. The number of mobile workers in the U.S. will grow from 182.5 million in 2010 to more than 212.1 million by 2015.
The increasingly mobile and remote workforce is driving organizations to support a wide range of mobile applications and services, which enables workers to proactively detect and collect more information from internal and external sources by using mobile devices, and perform real-time analytics for rapid decision, thus improving collaboration and productivity. A Gartner’s report shows that more than 40 percent of all enterprise web applications will support mobile environments by 2014 and 90 percent of companies will support corporate applications on mobile devices by 2014 [6].
1.1.3 Actionable analytics
Conventional explanatory analytics usually focused on what happened in the past. Such analytics may be an outdated and ineffective approach to offering timely, accurate, and actionable insights needed for distributed decision making and coordinated action planning today. What is happening now? What is going to happen in the future? The ability to answer these questions in real time or near real time can provide a competitive advantage.
Recent advances in mobile technologies enable mobile users to collaborate with their team members through coordinated actions by balancing opportunities and risks. These actions can be generated by ad hoc distributed analytics that may consist of simulation, prediction, and/or optimization. This capability leads to a great opportunity for reducing cost while improving outcomes through more flexible decision-making that can be optimized for a specific scenario at a certain time and place [6].
1.2 Different types of mobile cloud computing
The increasing number of mobile applications require more complex processing and more operational data. These applications may include real-time mobile analytics that enhances
(a) Remote cloud (b) Local cloud
(c) Ad hoc cloud (d) Personal cloud
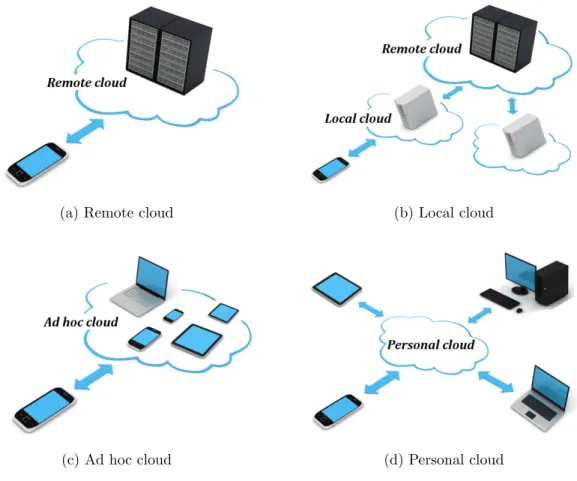
Figure 1.2: Different types of mobile cloud computing
situational awareness, risk assessment, distributed decision making, coordinated action plan-ning, team collaboration, and instant responsiveness.
Despite the increasing use of mobile devices, exploiting its full potential is difficult due to the inherent problems such as resource limitations (e.g., low computational capability and battery capacity) and frequent disconnections from mobility. Mobile cloud computing can solve these problems cost-effectively by utilizing computing and storage capabilities from remote resource providers or other mobile devices. There are several approaches to mobile cloud computing with different concepts and configurations [7, 8]. Figure 1.2 illustrates the different types of mobile cloud computing.
1.2.1 Remote and local cloud services
The mobile cloud computing commonly means to run a mobile application (e.g., Google Maps) on a remote resource-rich server (e.g., Google Cloud Platform) while the mobile device acts like a thin-client connecting to the remote server through Wi-Fi or 3G/4G wireless networks. Mobile users can access cloud systems using a web browser or mobile application regardless of their location or device type. Other examples include mobile commerce (m-commerce), mobile learning (m-learning), mobile healthcare (m-health), etc.
Although the mobile cloud applications that connect to a remote infrastructure are becoming popular, they can perform well only under reliable connectivity. It is not practical to assume high-speed connections, seamless handovers, and fast responses on mobile devices as mobile environments are subject to high probability of significant disruptions to network services due to mobility, where fixed infrastructures are frequently unavailable and network partitions are common.
The Cloudlet proposed by [9] is another approach to mobile cloud computing. Mobile users usually run client-server software at a remote location and high network latency (or low network bandwidth) makes it insufficient for real-time applications. To cope with this issue, they introduced the concept of local cloud: trusted, resource-rich computers in the near vicinity of the mobile user (e.g., near or co-located with wireless access points). Mobile users can rapidly instantiate custom virtual machines (VMs) on the cloudlet running the required software in a thin-client fashion. The cloudlet can be deployed in common areas, such as public offices, airports, shopping malls, etc.
1.2.2 Ad hoc cloud and other concepts
Another approach is to consider other mobile devices as resource providers of cloud computing by making up a mobile ad hoc network as in [10]. Reliable access to remote resources is the first challenge in the mobile environments since the resources are commonly distributed across a variety of remote sources. Thus, clustering with nearby mobile devices
will promise faster connectivity and better availability. This work primarily focuses on this type of mobile cloud computing, where the remote resources are mobile and available only within the range of the wireless transmission.
The collective resources of the various mobile devices in a local area, and other stationary devices if available, are utilized for cloud computing in the mobile ad hoc cloud. As a result, it can effectively support user mobility, collective sensing, and distributed applications. On the other hand, a mobile device that initiates cloud computing in the ad hoc cloud needs to dynamically take advantage of mobile cloud resources depending on requirements of its workload because the ad hoc resources and operating environments of the mobile cloud are subject to change. Hence, monitoring and scheduling of available cloud resources are one of the most critical capabilities for the success of the mobile ad hoc cloud.
In addition to the approaches above, there are other concepts and models for imple-menting cloud services using mobile devices. For example, personal cloud and private cloud are operated solely for a single person and a single organization, respectively, public cloud is open for public use, and community cloud shares resources between several organizations from a specific community with common concerns [11]. Although there may be little or no difference between those cloud architecture, they have substantially different security con-sideration for resources and applications. Furthermore, Gartner identified hybrid cloud as one of the top strategic trends for 2014, which is composed of some combination of personal, private, public and community cloud services offering the benefits from multiple deployment models [12].
The rest of this paper is organized as follows. Chapter 2 introduces the background and work related to this work. Chapter 3 then describes the details of our experimental setup for mobile cloud clusters and conducts performance analysis to identify performance problems of mobile MapReduce applications. Chapter 4 presents problem statements and research questions of this study. Then Chapter 5 proposes adaptive TCP flow control algorithms for mobile clusters with an analysis of TCP performance problems and Chapter 6 provides
evaluation results for the proposed solutions. Finally, Chapter 7 concludes this paper with a summary of the previous chapters and a discussion of main contributions and further research ideas.
Chapter 2
Background and related work
This section provides background information about the distributed analytic framework for mobile cloud clusters and its communication protocol, and also presents summaries on previous studies related to this work.
2.1 Overview of Apache Hadoop for cloud clusters
When reviewing multiple distributed analytic frameworks, this work found that Apache Hadoop [13] can provide a good starting point for implementing mobile cloud clusters since it supports cost-effective and high performance analysis of a large volume of unstructured data on a set of commodity hardware. This section summarizes main ideas of MapReduce programming model and describe working mechanisms of Hadoop distributed file system and MapReduce task execution in Hadoop framework.
2.1.1 Apache Hadoop
Apache Hadoop is an open-source framework that uses a simple distributed processing model based on Google MapReduce [14] and Google file system (GFS) [15]. It effectively handles massive amount of information by either transforming it to a more useful structure and/or format, or extracting valuable analytics from it. Hadoop runs on any machines equipped with a lower cost processor and storage, and automatically recovers from hardware, and software failures by providing fault tolerance mechanisms. Hence, Hadoop is more cost-effective for handling large unstructured data sets than conventional data mining approaches by offering great scalability and high availability.
2.1.2 MapReduce programming model
MapReduce is a fundamental programming model in Hadoop architecture to process large volumes of data. MapReduce applications with a parallel approach utilize a scale-out architecture that makes use of inexpensive commodity servers configured as a cluster, which allows users to analyze terabytes or petabytes of data in a fast and reliable way. To take advantage of parallel processing that MapReduce provides, users need to submit a job with desired computations for a series of MapReduce tasks. MapReduce operates by dividing the processing into two phases: the Map phase and the Reduce phase. Each phase has key-value pairs as input and output, the data formats can be specified according to the application. The user implements two functions: the Map function and the Reduce function. The Map function reads each input key-value pairs and produces a list of intermediate key-value pairs. The Reduce function takes in all intermediate key-value pairs by sorting with the identical key and generates a final set of key-value pairs. Both the input and output key-value pairs in Map and Reduce phase are stored in an distributed file system.
The Hadoop platform that runs MapReduce applications automatically parallelizes the execution, coordinates network communication and ensures fault tolerance, which spares users from concerning about parallelization and hardware failures in a large-scale distributed environment. In addition, the Hadoop framework tries to assign Map and Reduce tasks to cluster nodes where the data to be processed is stored for alleviating loads on network band-width and preventing unnecessary network transfers, which is critical for high performance in data-intensive computing.
2.1.3 Hadoop distributed filesystem
Hadoop implements a distributed, scalable, and portable filesystem, called Hadoop dis-tributed file system (HDFS), designed for storing large files with streaming access to data and optimized for data-intensive workloads such as MapReduce, running across clusters with commodity hardware. The data in the Hadoop cluster is broken down into small, fixed-size
pieces, called blocks; the default size of a block is 64 MB. The files in HDFS are split into block-sized chunks, which are stored as independent units. HDFS has two types of instance in a master-slave pattern: a single NameNode (the master) and a number of DataNodes (the slaves). NameNode manages the filesystem namespace which maintains the filesystem tree and the metadata for all the files and directories in the tree. NameNode also monitors the DataNodes on which all the blocks for a given file are located. DataNodes are the worker nodes of the filesystem. They store and retrieve blocks at the request of clients or NameNode through remote procedure call (RPC), and report their recent status updates periodically to NameNode with the metadata of their current blocks.
When an HDFS client wants to read a file, it first contacts NameNode to obtain the location information of data blocks comprising the file and then retrieves block contents from the DataNodes closest to the client. When writing data, the client also requests NameNode to schedule a set of DataNodes to store the block replicas for fault tolerance and then writes data to the DataNodes in a pipeline-like fashion. Since the current architecture has a single NameNode for each cluster where NameNode keeps all the namespace and block locations in memory, the size of the NameNode’s heap limits the number of files as well as the number of blocks addressable. This also limits the total cluster storage that can be supported by NameNode.
2.1.4 MapReduce task execution
A typical Hadoop cluster consists of a single master node and many slave nodes. An entire MapReduce computation is called a job and the execution of a Map or Reduce function on a slave is called a task. A sever process running on the master node, named JobTracker, coordinates jobs on a cluster of slave nodes. The JobTracker is responsible for accepting jobs from clients, dividing the input data (i.e., file) into many splits (i.e., blocks) and assigning the blocks to Map tasks that are processed concurrently on multiple slave nodes. Each slave node runs a client process called TaskTracker that manages the execution of the tasks
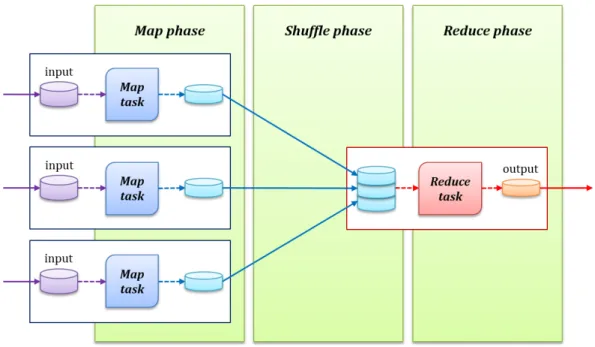
Figure 2.1: Data flows in MapReduce task execution
assigned to the node. Each TaskTracker has a fixed number of slots for executing tasks; the number of slots on each cluster node may be different and it depends on the node’s hardware capacity.
After the MapReduce job is submitted, the number of Map tasks is determined by the total number of data blocks spilt from input files. Each Map task reads a block from HDFS, parses it into key-value pairs and applies the Map function to each pair. Once the intermediate key-value pairs are generated on the local disk by the Map tasks, partitions on the intermediate pairs are performed using a scheme that keeps pairs with the identical key to be processed on the same Reduce task. After that, JobTracker sends the locations of the pairs to corresponding Reduce tasks. MapReduce guarantees that the intermediate result to every Reduce task is sorted by key. The process by which the system performs the sort and transfers the Map outputs to the Reduce tasks as inputs is known as the shuffle. After a Reduce task has read all the intermediate pairs, it runs the Reduce function and writes the output pairs to a final output file in HDFS. The data flows in MapReduce execution consisting of the Map, Shuffle, and Reduce phase are illustrated in Figure 2.1.
This section omits some details of configuration parameters, performance metrics, and analytic algorithms in Hadoop architecture, which can be found in many excellent publica-tions including tutorials, academic papers, and technical reports. Some of them (e.g., [16], [17], [18], and [19]) are referenced in this work.
2.2 Overview of TCP flow control for performance analysis
Most of the current distributed systems including Hadoop analytic framework exten-sively employ Transmission Control Protocol (TCP) for reliable communications between cluster nodes. Since TCP is optimized for accurate delivery rather than timely delivery, TCP on mobile devices may frequently incur significant delays while waiting for retrans-missions of lost or damaged packets and rearrangements of out-of-order packets on wireless communication links as detailed in [20]. This section presents an overview of TCP flow con-trol mechanisms to provide a background for performance analysis of mobile cloud clusters.
2.2.1 Sliding window flow control
TCP provides reliable data transfer with its flow control and congestion control mecha-nisms between applications on two hosts in the network. Since the TCP sender that desires to transmit a large amount of data may try to send data too fast for the TCP receiver to receive and process it reliably, the TCP standard [21] describes a sliding window based flow control mechanism. The TCP sender first buffers all data (in a TCP transmit buffer) before the transmission, assigning a sequence number to each buffered byte. Pieces of the buffered data are continuously formed into TCP packets that include a sequence number of the first data byte in the packet. Then a portion (window) of the packets that are ready to send is transmitted to the receiver using the IP protocol. As soon as the sender receives delivery confirmation for at least one transmitted packet, it transmits a new portion of packets; the window slides along the sender’s buffer as shown in Figure 2.2a. Since packet transfers over bad network conditions may not be reliable, the receiver is required to respond with an
acknowledgment as it receives the data while the sender keeps a record of each packet it transmits. The sender also maintains a retransmission timer, and retransmits a packet if the timer expires before the data has been accurately acknowledged.
Although a sliding window based flow control is relatively simple, it has conflicting objectives. In order to maximize the throughput of a TCP flow, it is essentially required that the size of a sliding window also be maximized. On the other hand, if the sliding window is too large, there is a high probability of packet loss because the network and the receiver have resource limitations. Thus, reducing packet losses requires minimizing the sliding window. Hence, finding an optimal value for the sliding window parameter (which is usually referred to as the congestion window size) that provides better throughput, yet does not overwhelm the network bandwidth and the receiver capacity is a critical problem in TCP communications.
The TCP flow control mechanism integrates the receive window concept as well, which is designed for the receiver to share the information about the available receive buffer with the sender. In each TCP segment, the receiver specifies the amount of additionally acceptable data (in bytes) in the receive window field. The sender can send only up to that amount of data before it must wait for an acknowledgment and window update from the receiver. Figure 2.2b illustrates this mechanism. When establishing a connection, the receiver informs the sender about the available buffer size for incoming packets (in the example shown, the receiver’s window reported initially is 7). The sender transmits a portion (window) of data packets. This portion must not exceed the receiver’s window and may be smaller if the sender is not willing (or ready) to send a larger portion. In the case where the receiver is unable to process data as fast as the sender generates it, the receiver reports decreasing values of the window (3 and 0 in the example). This induces the sender to shrink the sliding window. As a result, the TCP transmission will eventually synchronize with the receiver’s processing rate as demonstrated in Figure 2.3.
(a) Sliding win do w con trol (b) Receiv e windo w c on trol Figure 2.2: Sliding windo w based TCP data transfer pro cess (a) Net w ork limit (b) Receiv er limit Figure 2.3: Upp er b ound of TCP congestion windo w gro wth
When a receiver advertises a window size of 0, Zero Window (i.e., a receiver is not able to receive any more data at the moment) as shown in Figure 2.2b, the sender stops transmitting data and starts a persist timer. The persist timer protects TCP from the deadlock situation that the sender will never be able to transmit further data by waiting for a new window update from the receiver, which could arise if a subsequent window update from the receiver is lost. When the persist timer expires, the TCP sender attempts recovery by transmitting a small packet (called Zero Window probe) so that the receiver forcibly responds by sending another acknowledgement containing the receive window update.
2.2.2 Packet loss detection mechanisms
The early and accurate detection of packet loss is one of core mechanisms in the TCP congestion and flow control. Most of the TCP control proposals gradually increase the utilization of network resources up to the limit where a packet loss is starting to be detected, at which point they reduce its transmitting rate, retransmit the lost packet, and begin another phase of rate controls (e.g., rate increases). TCP detects a packet loss through two critical mechanisms: retransmission timeout and duplicate acknowledgement [21].
The first mechanism defines the retransmit timeout (RTO), in which TCP waits for a timeout of the retransmission timer for the detection of a packet loss. Although it is capable of reliably detecting all losses, the detection is not fast enough and is necessarily time consuming since the retransmission timer must be set high enough to avoid unnecessary timeouts caused by transient network conditions; the minimum time when a loss can be detected is the round-trip time (RTT) and the RTO should be greater than the RTT.
If the RTO value is overestimated, the TCP packet loss detection mechanism becomes very conservative, and performance of individual flows may be significantly degrade. In the opposite case, when the RTO value is underestimated, the loss detection mechanism may cause unnecessary retransmissions by wasting the available network resources and aggravat-ing the network congestion level. For the problems of erroneous RTO estimates, the RTT
variance estimation algorithm [22] tries to alleviate the overestimation problem by establish-ing a fine-grained upper bound for the RTO and the exponential RTO backoff algorithm [23] to mitigate the underestimation problem by doubling the RTO value on each retransmission occurrence.
The second mechanism assumes that if TCP receives a few duplicate acknowledgements of a packet then the packet was lost, in which TCP counts the number of acknowledgements with the same sequence number for the detection of a packet loss. When the probability of packet duplication (and packet reordering) in the network is negligible, the duplicate ac-knowledgments can be considered a reliable loss indication. Thus, the sender can retransmit a lost packet faster without waiting for the corresponding retransmission timer to expire.
2.2.3 Congestion window dynamics
The initial TCP standard lacks any means to adjust the transmission rate to the actual capacity of the network. When a TCP sender (or many senders) is transmitting too much data that can exceed the available network bandwidth, congestion collapse easily occurs in the form of queueing delay, packet loss or the blocking of new connections, which result in an substantial reduction in network throughput. To resolve this congestion collapse problem, a number of solutions have been proposed. Most of them share the same idea of utilizing a network-aware rate limiting mechanism along with the receiver-based flow control. For this purpose the congestion window mechanism was introduced, in which the TCP sender determines (or estimates) the number of data packets that the network can accept for delivery without becoming overloaded. If the receiver does not have any resource limitations, the congestion window limit can be considered an indication of the maximum capacity of the connection. On the other hand, when the flow control limit (i.e., the receive window) is less than the congestion control limit (i.e., the congestion window), the former is considered a real bound for outstanding data packets. Graphs in Figure 2.3 show two cases of the congestion window dynamics; the left graph shows the congestion window dynamics when the network
cannot deliver any more data at the transmitting rate, and the right graph represents the case when the receiver cannot process further data at the receiving rate [20].
One of the earliest solutions to solve the congestion problem in TCP operation has been proposed by [22]. The solution is based on the original TCP specification and includes a number of algorithms to avoid the network congestion. The most important algorithms are the Slow Start and Congestion Avoidance algorithm. These provide two slightly different distributed peer-to-peer mechanisms which allow a TCP sender to detect available network resources and adjust the transmission rate of the TCP flow to the limit determined. Assuming the probability of random packet corruption during transmission is negligible, the sender can consider all the packet losses as the congestion problem. Furthermore, the reception of any acknowledgement packet is an indication that the network can accept and deliver a new packet. Thus, the sender expecting that it will not result in any congestion can transmit at least the amount of data that has just been acknowledged. This incoming and outgoing packet balancing is called the packet conservation principle that is the basic concept of both Slow Start and Congestion Avoidance algorithm.
In the Slow Start algorithm, the reception of an acknowledgement packet indicates avail-ability of network resources for transmitting double the amount of data (i.e., multiplicative increase) that has been acknowledged by the receiver. In other words, instead of a linear growth in the congestion window, its growth follows an exponential function (i.e., the growth is quite aggressive). If a packet loss is detected (i.e., the network is experiencing congestion because all network resources have been utilized), on the other hand, the congestion window is reset to the initial value (e.g., the maximum segment size) to ensure release of network resources. The other algorithm for improving TCP effectiveness in the networks with re-source limitations is Congestion Avoidance that combines linear growth of the congestion window with an exponential reduction when a congestion takes place. In comparison to the Slow Start, this algorithm is much more conservative in response to acknowledgement of transmitted packets and to detection of packet losses. As opposed to doubling the size, the
congestion window increases by one (i.e., additive increase) only if all data packets have been successfully delivered during the last RTT. After a loss is detected, the algorithm reacts in a different way, which cuts the congestion window size by half (i.e., multiplicative decrease). Figure 2.3a demonstrates the behaviors of the Slow Start and Congestion Avoidance algo-rithm over the bandwidth-limited network.
A number of proposals to improve various aspects of TCP performance (e.g., the effective use of available network resources) have been presented over the past 20 years, which in-clude mechanisms to probe the available network resources, estimate the network congestion state, and detect the packet loss under different assumptions on the network environment. Moreover, some proposals contain algorithms to improve the poor utilization of error-prone wireless and high-speed wired networks. For example, TCP Westwood+ [24] proposes a bandwidth estimation technique for wireless networks with random loss and TCP CUBIC [25]) a congestion control algorithm that scales well in high-speed networks with long la-tency. The current Linux kernel supports some of those proposals and users can choose a better algorithm for a particular network connection; TCP CUBIC is implemented by de-fault in Linux kernel 2.6.19 and above. However, there are not yet the practical guideline and performance criteria for the selection of a congestion control algorithm.
2.3 Related studies on mobile cloud clusters
Many researchers have identified key attributes, technologies, and challenges that dis-tinguish cloud computing from traditional computing paradigms [26, 27, 28, 29, 30]. To put it briefly, cloud computing provides reliable, customizable and dynamic computing environ-ments with Quality of Service (QoS) guarantee for end-users [31]. Also, many studies have been interested in mobile cloud services on the Internet as summarized in [7] and [8].
This work pays particular attention to the performance of mobile ad hoc cloud, where ad hoc networks of mobile devices themselves work as resource providers of the cloud. In
this type of cloud, the workload and data reside on individual mobile devices rather than on remote resource servers.
2.3.1 Implementation of mobile ad hoc cloud
Hyrax [32, 33] explores the feasibility of using a cluster of mobile phones as resource providers by porting Apache Hadoop to Android smartphones. For a sample application, they present a simple distributed mobile multimedia search and sharing program. However, their performance evaluations for the Hadoop mobile cluster are limited since they completed only a partial implementation of the Hadoop architecture, where many core features had to be removed due to difficulties and obstacles in Hadoop migration. Even the major controllers of Hadoop framework, such as JobTracker for MapReduce and NameNode for HDFS, are not installed on the mobile node. A similar approach to implementing the Hadoop framework on mobile devices is found in [34].
Serendipity [35, 36] discusses the challenges of remote computing using mobile devices and introduces a framework that enables a mobile computation initiator to use remote com-putational resources available on mobile devices. They implement an actual prototype on Android devices and evaluate their system using two sample applications: a face detection application and a speech-to-text application. However, no performance comparison with the existing distributed frameworks is made. Another study, Cuckoo [37], proposes a com-putation offloading framework for Android smartphones and illustrates its utility with an application for multimedia content analysis.
In short, several studies on the ad hoc cloud framework for mobile devices have been conducted by implementing only part of an existing distributed analytic framework or by proposing a customized framework similar to the existing one [38]. Furthermore, the previous studies are mostly evaluated using just one or two domain-specific applications and fail to provide comparative analysis of their performance and efficiency. To the best of our
knowledge, there has been no comparable framework and performance analysis for practical mobile cloud clusters running distributed analytic applications.
Although this work mostly focuses on the performance of practical distributed analytics on the mobile cloud clusters in terms of job processing time and response time, other work concentrates on mobile device’s energy efficiency which is a key aspect to enable data analysis and mining over mobile devices. For example, an energy-aware scheduling over the mobile cluster to optimize energy utilization should be taken into account for mobile distributed analytics.
2.3.2 Network problems of traditional cloud
This work also focuses on reliable data communications between mobile devices for analytical data transfers in the workflow of distributed analytics under the limitations of TCP performance over wireless links. To find the best way to control data flows on mobile devices for improving performance of mobile cloud clusters, it is necessary to review previous solutions for the typical datacenter cloud.
In datacenter networks, there have been many proposals to solve typical network prob-lems in many-to-one communication patterns, known as TCP Incast, where the traffic bursts overload the switch buffers, which lead to a significant increase in queueing delay and decrease in TCP throughput. The problems affect the performance of cloud computing frameworks in which distributed processing cannot progress until all parallel threads in a stage complete [39]. Examples of such frameworks include distributed filesystems, web search, and other applications with partition or aggregation workflows [40, 41, 42].
The traditional solutions to TCP Incast include modifying network parameters [41, 43] or TCP congestion/flow control algorithms in Link and Transport network layer [44, 45], which may involve customized network designs for the efficient switching [40, 42], and optimizing application data transfer patterns for mitigating the TCP congestion [46, 42]. Since TCP Incast is originally incurred in the switch-based network topology using TCP,
however, most of the solutions may be inapplicable directly to the mobile network issues that arise in the wireless environments with different characteristics.
2.3.3 MapReduce performance prediction using simulation
Simulation has been widely used for performance prediction and characterization, which can simplify research process by skipping intricate processes of experimental setup and con-figuration and significantly reduce the experiment time. Since MapReduce has been adopted as a preferred choice of framework for data intensive computing, there have been many efforts toward developing MapReduce simulators over the past few years to address the per-formance analysis of scheduling algorithms. They provide several MapReduce simulators such as Mumak [47], MRSim [48], and MRPerf [49].
Mumak uses job trace of real world workload as input to estimate job execution time, throughput, etc. MRSim is another simulator based on discrete event simulation, which can predict job performance as well as hardware utilization. The other simulator is MRPerf that uses information about node specification, cluster topology, data layout, and job description as inputs and generates a detailed phase-level execution trace that provides job execution time, amount of data transferred, and time-line of each phase of the job execution [19].
MRPerf is uniquely based on the popular ns-2 network simulator [50], which models task communications over the networks with varying cluster configurations and different network topologies to simulate correct network behavior of the real system. Although this work primarily performs actual experiments using Hadoop clusters consisting of practical mobile devices to identify performance issues of mobile cloud clusters, it also develops a MapReduce simulator based on an existing simulator (MRPerf on ns-2) to address dynamic node mobility under various wireless environments and capture more details of performance aspects.
Chapter 3
Understanding performance issues of Hadoop mobile clusters
MapReduce is the fundamental software programming model in the Hadoop architec-ture, which performs distributed processing of large data sets on a computing cluster. A single large workload (job) is divided or mapped into smaller sub-workloads (tasks) to be processed in parallel. The results from the sub-workloads are merged, condensed, and re-duced to produce the final result. Both input and output are stored on the nodes throughout the cluster in the distributed filesystem.
Numerous factors can affect the performance of the Hadoop cluster. The typical perfor-mance factors such as workload type, cluster size, input/output data size, and characteristics of computing nodes (e.g., CPU, memory, and I/O resources) have significant impacts on the processing time. In addition, the network is also a critical factor on the Hadoop perfor-mance since the nodes are interconnected through the network in order to transfer data for distributed processing during one or more phases of MapReduce execution.
This chapter examines the performance of MapReduce in practical mobile cluster se-tups using Hadoop benchmarks and identifies its critical performance issues in the mobile operating environments.
3.1 Hadoop benchmarks for performance evaluation
A benchmark provides a method of comparing the performance of various subsystems across different system architectures and mimics a particular type of workload on a com-ponent or system. In order to perform extensive performance analysis of Hadoop mobile clusters, this work chooses workloads from a benchmark suite provided by [51]. It contains
typical Hadoop workloads with options for input/output configurations (e.g., data size, com-pression method, etc). Table 3.1 lists its benchmark workloads with their characteristics. All the workloads are implemented with Hadoop MapReduce framework and are capable of performing a variety of data intensive computations such as sorting, I/O operations, web search and machine learning.
The Sort, WordCount and TeraSort benchmark for micro-benchmarking are currently implemented in Hadoop software releases, which are three most popular benchmarks widely used by Hadoop developers and engineers. The Sort and WordCount are representative of a large group of real world MapReduce applications that extract the interesting information from large input data. The Sort benchmark simply uses the MapReduce framework to sort the input directory into the output directory, where the inputs and outputs must be sequence files with keys and values. The WordCount benchmark reads text files and counts how often words occur. Each Map task takes a line as input, breaks it into words and then generates a
key-value pair of< word,1>. The Reduce task sums the counts for each word and generates
a single key-value. The TeraSort benchmark sorts data at terabyte scale, which has been used in many cluster competitions among distributed computing platforms to show their performance and efficiency.
The TestDFSIO benchmark also included in the Hadoop releases is another microbench-mark for I/O performance, which performs parallel file read and write operations in separate Map tasks. The output of the Map task is used for collecting statistics relating to the file just processed. The statistics are accumulated in a Reduce task to generate a summary on average I/O throughput of the distributed file system (i.e., HDFS).
The Nutch Indexing and PageRank benchmark represent the web search applications, which are open-source applications. The Nutch Indexing benchmark that comes from Apache Nutch project crawls web links from root URLs and converts the link information into inverted index files with MapReduce tasks. The PageRank benchmark is composed of a
T able 3.1: Hado op b enc hmarks and their characteristics Category W orkload Resource uti lization Data flo w patterns Microb enc hmarks Sort I/O b ound data −− − −→ Map data −− − −→ Reduce data −− − −→ W ordCoun t CPU b ound data −− − −→ Map data −− − −→ Reduce data −− − − −→ T eraSort Map: CPU b ound, Reduce: I/O b ound data −− − −→ Map data −− − −→ Reduce data −− − −→ T estDFSIO I/O b ound Map data −− − − −→ Reduce Applications Web searc h Nutc h indexing Map: CPU and I/O b ound, Re-duce: I/O b ound data −− − −→ Map data −− − −→ Reduce data −− − − −→ P age rank CPU b ound data −− − −→ Map data −− − − −→ Reduce data −− − − −→ Mac hine learn ing K-mean clustering I/O b ound, data −− − −→ Map data −− − − −→ Reduce data −− − − −→ 1 st Map: CPU b ound data −− − −→ Map data −− − −→ Ba y esian classification CPU b ound in ite ration, data −− − − −→ Map data −− − −→ Reduce data −− − −→ I/O b ound in clusterin g data −− − −→ Map data −− − −→ Reduce data −− − − −→ Note: F on t size denotes the data size of the input, in termediate, and output; data −− − −→ >> data −− − −→ >> data −− − − −→
chain of Hadoop jobs calculating the rank of each web page according to the number of reference links.
The K-means Clustering and Bayesian Classification are also introduced as the machine
learning applications. The K-means clustering benchmark takes in a numerical vector in n
dimensional space representing the features of the objects to be clustered. The algorithm
that randomly chooses k points in the vector space serving as the initial centers of the
clusters recalculates the center of each cluster iteratively with MapReduce jobs until the points are not reselected or the maximum number of iterations is reached. The Bayesian Classification benchmark involves four chained MapReduce jobs that extract labels from input text, compute the Term Frequency-Inverse Document Frequency (TFIDF) of each feature in each label, and then perform the weighting and normalization.
3.2 Assumptions on mobile cloud clusters
This work performs actual experiments and runs simulations based on the following assumptions on the basic, common configurations of practical mobile cloud clusters for ad hoc analytics. However, future work will consider extensive scenarios that include dynamic node mobility and complicated analytical workloads over various mobile environments.
• Mobile devices may process computational workload that exceeds their capability by
offloading portions of the workload to remote resources for distributed execution. All mobile devices are capable of sharing their computing resources, and behave in a col-laborative and trustworthy manner.
• Clustering with nearby mobile devices to build a mobile ad hoc cloud provides faster
connectivity and better availability because the actual connectivity with typical remote cloud infrastructures may be intermittent and unpredictable due to the mobility of mobile devices.
• Mobile nodes belonging to a cluster only communicate with adjacent nodes within their communication range in a wireless single-hop network. The data transmission of the multiple nodes might interfere with each other due to the overlapping communication ranges on a shared channel.
• The mobile cluster runs a single workload at a time, either transforming the
unstruc-tured input data to a more useful structure without adding new data, or extracting small but valuable analytics from the input data. The amount of intermediate and output data generated by mobile devices depends on the type of workload.
3.3 Performance experiments of Hadoop mobile clusters
This section describes details of the practical experimental setup for Hadoop mobile clusters and presents the experimental results for performance analysis.
3.3.1 Experimental setup
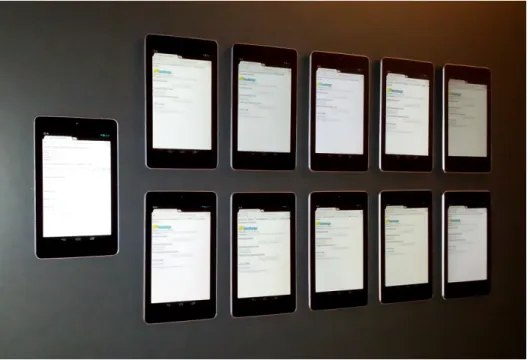
In the experiments this work measured the performance of Hadoop clusters using Android-based mobile platforms including smartphones (e.g., Samsung Galaxy S2 and Google Galaxy NEXUS), media players (e.g., Samsung Galaxy player), and tablets (e.g., Samsung Galaxy Tab and Google NEXUS 7) under extensive distributed configurations. This chapter presents experimental results from one of those cluster setups, which consists of eleven NEXUS 7 tablets developed by Google in conjunction with Asus. Figure 3.1 displays the experimental mobile cluster with Google NEXUS 7 tablets.
The experimental platform, NEXUS 7, is the first tablet in the Google Nexus series that implements the Android operating system. The Nexus 7 features a 7-inch display, NVIDIA Tegra 3 quad-core processor, 1 GB of memory, and 16 GB of internal storage, and incorporates built-in Wi-Fi, Bluetooth, and NFC connectivity [52]. The tablet runs the latest Android operating system (version 4.2.2, nicknamed Jelly Bean) and Hadoop stable
Figure 3.1: Experimental mobile cluster using Google NEXUS 7
detailed specifications of experimental platforms are listed in Table 3.2. All platforms are reliably interconnected with a Wi-Fi based wireless access point, Asus RT-N66U, in an IEEE 802.11n [53] infrastructure mode.
Android is a mobile operating system designed for smartphones and tablets, which makes use of a virtual machine on a customized embedded Linux system as its runtime environment to run mobile applications. The virtual machine provides an isolated environment for code execution, where an application with a malicious piece of code cannot directly affect the system (i.e., the core OS will be kept from getting corrupted). Thus, it makes the system more stable and reliable. In addition, it allows for cross-compatibility as its applications can be executed on any mobile platform using the virtual machine. The android applications are usually written in Java language and are executed in the Dalvik virtual machine (DVM) that is substantially different from the classical Java virtual machine (JVM) [54]. The DVM is developed by Google and optimized for the characteristics of mobile operating systems (especially for the Android platform). The differences between Java and Dalvik bytecode based on JVM and DVM, respectively, are summarized in Table 3.3.
Table 3.2: Hardware and software specifications of experimental nodes
Platform Google NEXUS 7
CPU NVIDIA Tegra 3 quad-core processor (1.7 GHz single / 1.6 GHz quad)
Memory 1 GB, RAM
Storage 16 GB, Nand flash
Network Wi-Fi 802.11 b/g/n, Bluetooth, NFC
Mobile OS Android 4.2, Jelly Bean (Build number: JDQ39)
Kernel Linux 3.1.10
Linux extension Ubuntu 12.04 for ARM
JVM JDK 1.6.0 32 (Oracle Java SE for Embedded 6u32 ARMv7 Linux)
Hadoop 1.1.2 stable release
Resource monitoring Sysstat 10.0.3-1 stable version
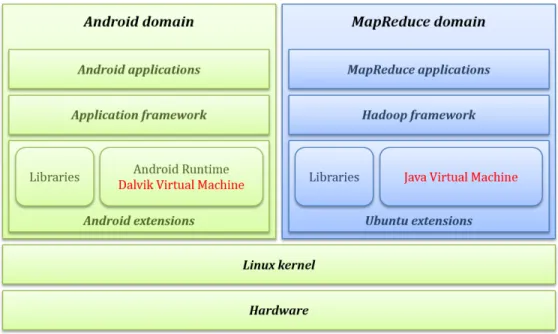
Porting Hadoop framework on the Android operating system was a big and significant challenge at the early stage of this work. Since Android employs the Dalvik virtual machine to support its mobile applications, Hadoop software framework based on a specific Java virtual machine is not fully compatible with the Android runtime environment. Hence, Hadoop can be ported by either converting from its JVM based source codes and libraries to DVM compatible ones or installing a specific JVM recommended by the Hadoop project to run the original Hadoop software.
Most of the previous work [32, 33, 34] had difficulties with rewriting Hadoop codes for Android. They implemented only a small number of Hadoop functions by removing many core features that are incompatible with the Dalvik environment. In contrast to earlier approaches, this work successfully installed Oracle JVM that is a base platform for perfectly running Hadoop framework on Linux-based operating systems by adding a Linux extension [55], Ubuntu 12.04, to the Android Linux kernel as illustrated in Figure 3.2; this kind of approach is called Mobile virtualization, in which virtualization technology enables multiple operating systems or virtual machines to run simultaneously on a mobile device [56]. It was carefully ensured that there was no degradation of the hardware performance or adverse effect on Android operations. As a result, the experimental mobile cluster runs all the existing
T able 3.3: Comparison of Ja v a and Dalvik b yteco de Ja v a b yteco de executed in JVM Dalvik b yteco de running in D VM Application S t ructure Consists of one or more .class files, one file p er class. Has a signle .dex file con tain ging all classes. Register arc hit e ct u r e Stac k-based. Push lo cal v ar ialbles on to a pro-gram stac k for man uipulation. Register-based. Assigns lo cal v ariables to an y of the 2 16 a v ailable registers and directly m an ipu-late registers. Instruction set Has 200 op co des. Ha v e a dozen of op co des dedi-cated to mo ving eleme n ts b et w een the stac k and lo cal v ariab le tables. Has 218 op co des. Has longer instructions, since most of them con tain source an d destination ad-dress of registers. Constan t p o ol structure Replicates elemen ts in constan t p o ol s within the m ultiple .class files, e.g., re fe rrer an d re fe re n t metho d names. Uses a single p o ol that al l classes sim ultaneously reference and eliminates some constan ts b y in-lining their v alues directly in to the b yteco de. Am biguous prim itiv e typ es V ariable assignmen ts distinguish b et w een in-teger ( int ) and si ngle-p rec ision floating-p oin t ( float ) constan ts and b et w een long in te-ger ( long ) and double-precision floating p oin t ( double ) constan ts. V ariable assignmen ts ( int / float and long / double ) use th e same op co des for in tegers and floats, e.g., the op co des are un typ ed b ey ond sp ec if ying precision. Null references Has a null typ e. Do es not sp ecify a null typ e, in stead opting to use a zero v alue constan t. Ob ject references Uses typ ed op co des for the comparison of ob ject references ( if acmpeq and if acmpne ) and for null comparison of ob jec t references ( ifnull and ifnonnull ). Uses a more simplistic in teger com p arison b e-tw ee n tw o in tegers, and a comparison of an in-teger and zero, resp ectiv ely . Storage of primitiv e typ es in arra y s Uses defined, unam biguous op co des. Uses am biguous op co des to store and re-triev e elemen ts in arra ys of primitiv e typ es (e.g., aget for int / float and aget-wide for long / double ).
Figure 3.2: Mobile virtualization for MapReduce implementation
and emerging features of the Hadoop architecture, including MapReduce 2.0, also known as YARN [16].
The experimental mobile cluster that runs the Hadoop software is composed of a single master node and ten slave nodes which are configured with the default values for system parameters of the Android OS and Hadoop framework. The master node coordinates the slave nodes to get the workload done and the slaves run the sub-workloads, Map and Reduce tasks, assigned by the master node. The usage of computing and networking resources on each node is carefully monitored with a performance monitoring tool, Sysstat. To investigate node’s behavior in the Hadoop workflow, two typical workloads – WordCount and TeraSort – are tested with associated Hadoop benchmark tools on the mobile cluster.
• WordCount: this workload counts the occurrence of each word in the input data sets
generated by the Hadoop RandomTextWriter tool. It represents workload that extracts small but valuable analytics from the input data.
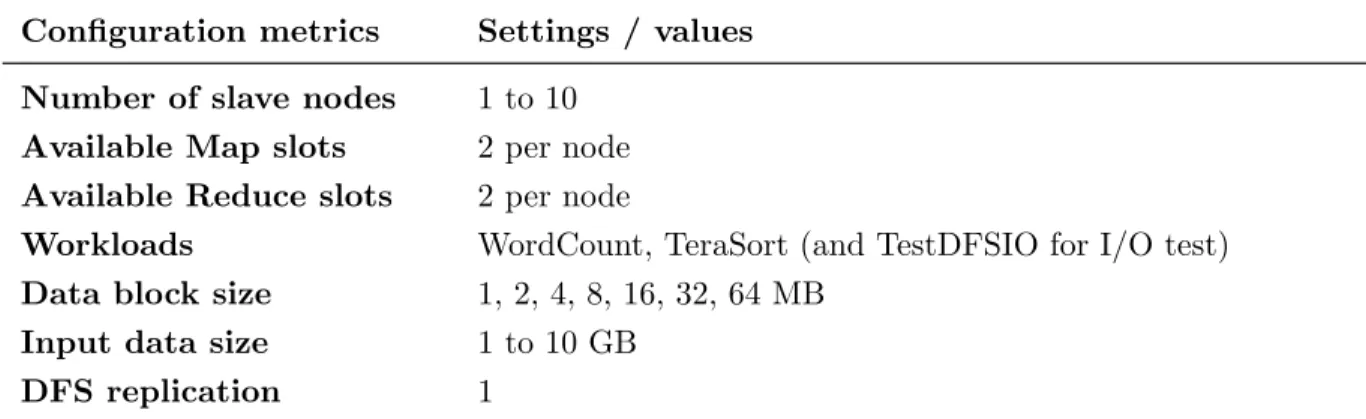
Table 3.4: Hadoop configurations of the experimental mobile cluster
Configuration metrics Settings / values
Number of slave nodes 1 to 10
Available Map slots 2 per node
Available Reduce slots 2 per node
Workloads WordCount, TeraSort (and TestDFSIO for I/O test)
Data block size 1, 2, 4, 8, 16, 32, 64 MB
Input data size 1 to 10 GB
DFS replication 1
Note: MapReduce slots define the maximum number of Map and Reduce tasks that can run in parallel on a cluster node. The number of slots on each cluster node may be different and it depends on the node’s hardware capacity.
• TeraSort: this workload sorts the input data sets generated by the Hadoop TeraGen
tool in a predefined order. It represents workload that transforms unstructured source data to a more useful structure or format without adding new data.
The input and output data usually need to be replicated to a small number of physically separate nodes (typically three) to insure against data block corruption and hardware failure. However, this work disables the replication of both input and output data in the experiments to concentrate on core behaviors of the MapReduce workflow. The details of the configuration metrics are listed in Table 3.4.
3.3.2 I/O performance of mobile nodes
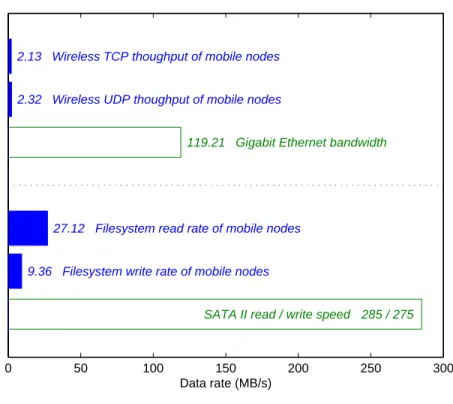
Before analyzing the performance of Hadoop framework on the mobile cloud cluster, the experimental cluster nodes are tested to examine their robustness, availability, and error han-dling under a heavy load and to investigate which resource (e.g., CPU, memory, filesystem, network, etc.) may affect the performance of MapReduce applications. In the stress testing, remarkable performance characteristics of the filesystem and network I/O are observed, in which the Hadoop TestDFSIO benchmark that tests the I/O performance of the distributed filesystem by sampling the number of bytes read/written at fixed time intervals is utilized
0 50 100 150 200 250 300 Data rate (MB/s)
2.13 Wireless TCP thoughput of mobile nodes
2.32 Wireless UDP thoughput of mobile nodes
119.21 Gigabit Ethernet bandwidth
27.12 Filesystem read rate of mobile nodes
9.36 Filesystem write rate of mobile nodes
SATA II read / write speed 285 / 275
Figure 3.3: Network and filesystem throughput of mobile nodes
to measure the actual HDFS read/write speed (in a single-node cluster setup) and the Iperf network performance measurement tool that generates constant TCP or UDP traffic flows is employed to compute the actual network throughput (between two cluster nodes).
Figure 3.3 displays throughput measurements of the filesystem and network in the load tests. The result shows that the network and filesystem I/O of mobile devices are far slower than those of commodity servers with one or two wired Gigabit connections and SATA II internal storages; 10-Gigabit Ethernet and SATA III storage are already common. In particular, the available network throughput of mobile nodes is too much lower than that of typical Hadoop clusters presented in [18]. The network speed is mush slower than the data transfer rates of internal storage as well. Since the actual effect of the network bandwidth on Hadoop performance is relatively small in conventional Hadoop setups with high-speed wired connectivity, not much attention has been paid to Hadoop operations under the network bandwidth constraint that is critical for reliable data transfers.
Consequently, the performance of mobile cloud clusters may be strongly influenced by the characteristics of wireless links in the operating environments. Although computing capabilities of cluster nodes are a significant performance factor, each node also needs the capability to read and write large amounts of data to and from the distributed filesystem that is implemented on remote nodes. In wireless networks with relatively low network bandwidth, time required to transfer data blocks can significantly contribute to the total processing time even though the distributed computing power generally decreases the amount of time required for job completion.
3.3.3 Performance of WordCount workload
The WordCount workload that counts the occurrence of each word in the input data sets produces small final output. The Map phase is generally computation intensive, compared to other phases. Network utilization is low in the Shuffle phase, in which the Map tasks transfer their output (i.e., intermediate results) to the Reduce task as input, because the Map output is a small subset of the large input data set in this kind of workload.
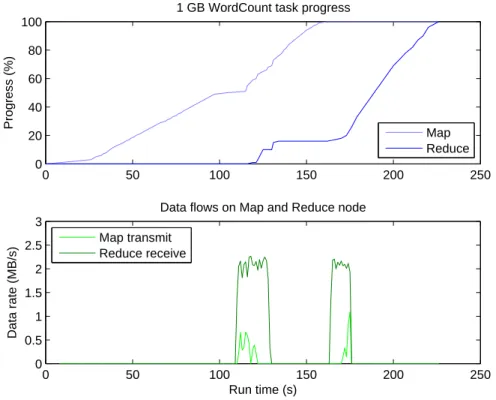
Figure 3.4 shows the network utilization with MapReduce task progress of the Word-Count workload that starts with 1 GB input data. In the workload, 20 Map tasks corre-sponding to the 1 GB input size are equally distributed over 10 slave nodes. One node is chosen to run the single Reduce task that produces the final output. Figure 3.5 displays resource utilization on two typical slave nodes; the Map node runs only two of 20 Map tasks and the Reduce node runs both the Map tasks and the additional Reduce task.
Figure 3.4 contains an aggregate data traffic pattern receiving from all nodes running Map tasks, which is denoted by the solid line and a single data flow transmitted by a typical Map node, denoted by the dash line. The graph shows two bursts of received traffic since each node finishes two assigned Map tasks one at a time and transmits the intermediate result at the same time to the single node running the Reduce task.
0 50 100 150 200 250 0 20 40 60 80 100 Progress (%)
1 GB WordCount task progress
Map Reduce 0 50 100 150 200 250 0 0.5 1 1.5 2 2.5 3 Run time (s) Data rate (MB/s)
Data flows on Map and Reduce node
Map transmit Reduce receive
Figure 3.4: Network utilization of Hadoop mobile cluster with WordCount workload
Although Hadoop has the ability to process multiple tasks simultaneously within re-source bounds, the experimental nodes run tasks sequentially due to lack of memory (see Figure 3.5). This explains the separated bursts of traffic and corresponding delays in the Map and Reduce progress. The network bandwidth is saturated during each burst, but it only lasts for a short period of time since the output of the Map tasks is very small.
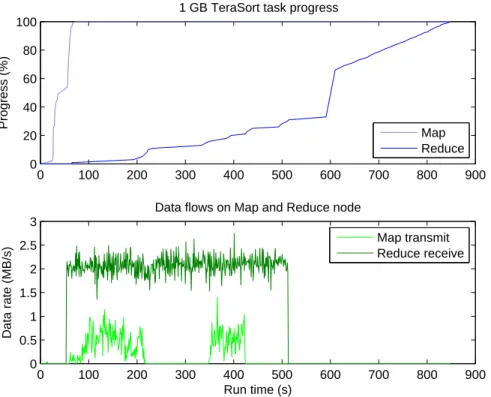
3.3.4 Performance of TeraSort workload
The TeraSort workload that sorts input data sets generates a large amount of interme-diate data in the Map phase, which needs to be transmitted to the Reduce task over the network to produce the final output. Both Map and Reduce phase are commonly compu-tation and I/O intensive. Network utilization is very high in the Shuffle phase because the output of Map tasks has the same size as the input data sets in this workload.
0 50 100 150 200 250 0 20 40 60 80 100 Run time (s) CPU usage (%) CPU 0 50 100 150 200 250 0 20 40 60 80 100 Run time (s) Memory usage (%) Memory 0 50 100 150 200 250 0 5 10 15 20 25 30 Run time (s) I/O rate (MB/s) Storage read write (a) Map no de 0 50 100 150 200 250 0 20 40 60 80 100 Run time (s) CPU usage (%) CPU 0 50 100 150 200 250 0 20 40 60 80 100 Run time (s) Memory usage (%) Memory 0 50 100 150 200 250 0 5 10 15 20 25 30 Run time (s) I/O rate (MB/s) Storage read write (b) Reduce no de Figure 3.5: Resource utilizatio n of MapReduce no des running W ordC oun t tasks