What are the correlates of substance abuse treatment counselor salaries?
Todd A. Olmstead, (Ph.D.)
a,T
, J. Aaron Johnson, (Ph.D.)
b,
Paul M. Roman, (Ph.D.)
b,c, Jody L. Sindelar, (Ph.D.)
a,da
School of Public Health, Yale University, New Haven, CT, USA
b
Center for Research on Behavioral Health and Human Services Delivery, The University of Georgia, Athens, GA, USA
c
Department of Sociology, The University of Georgia, Athens, GA, USA
dNational Bureau of Economic Research, Cambridge, MA, USA
Received 3 January 2005; received in revised form 25 May 2005; accepted 20 June 2005
Abstract
This article identifies and measures the key correlates of substance abuse treatment (SAT) counselor salaries. The data come from the 2002–2003 wave of the National Treatment Center Study that consists of approximately 1,500 full-time counselors from nationally representative samples of public and private SAT facilities. We used interval regression models to estimate the relationship between annual salary and numerous counselor and organizational characteristics. We found that counselor characteristics associated with annual salary include education, tenure in the SAT field, licensure, race, recovery status, and administrative responsibilities above and beyond duties as a full-time counselor. Organizational characteristics associated with counselor salary include accreditation status, hospital ownership, and the population density of the county where the facility is located. Taken together, these factors explain approximately 50% of the total variation in SAT counselor salaries.D2005 Elsevier Inc. All rights reserved.
Keywords:Substance abuse treatment counselors; Annual salary; Education; Tenure
1. Introduction
Understanding variation among substance abuse treat-ment (SAT) counselor salaries is a critical first step in addressing the twin problems of retaining and recruiting qualified counselors in the SAT field. The SAT field is currently hampered by difficulties in retaining and recruit-ing qualified counselors (Gallon, Gabriel, & Knudsen, 2003; Knudsen, Johnson, & Roman, 2003; McLellan, Carise, & Kleber, 2003). Estimates of annual counselor turnover rates in SAT facilities range from 18.5% nationally in the private sector (Johnson, Knudsen, & Roman, 2002) to 25% in the Pacific Northwest (Gallon et al., 2003) to 50% nationally in both the public and private sectors (McLellan et al., 2003). These estimates far exceed the national
average of 11% across all occupations. They are well above other human service occupations with high rates of turnover such as nursing (12.0%) and teaching (13.2%) (Johnson et al., 2002). Moreover, the pool of qualified counselors appears to be shrinking, due in part to increased educational and other credentialing requirements made by third-party payers (e.g., managed care), which render many experi-enced counselors and prospective applicants unqualified (Alcoholism & Drug Abuse Weekly, 2002; McCarty, 2002; Mulvey, Hubbard, & Hayashi, 2003). The problem may get worse over time. The SAT workforce is aging—60% of treatment professionals (i.e., counselors, facility directors, and clinical supervisors) are between the ages of 40 and 55 years—and the field is expected to face a critical staff shortage in the next 10 years unless ways are found to attract new counselors (Mulvey et al., 2003).
An obvious means to attract and retain more qualified SAT counselors is to make the job more financially rewarding to prospective and existing counselors (Gallon et al., 2003; Knudsen et al., 2003; McLellan et al., 2003).
0740-5472/05/$ – see front matterD2005 Elsevier Inc. All rights reserved. doi:10.1016/j.jsat.2005.06.001
T Corresponding author. School of Public Health, School of Medicine, Yale University, 60 College St., P.O. Box 208034, New Haven, CT 06520-8034, USA. Tel.: +1 203 785 3778; fax: +1 203 785 6287.
However, despite widespread belief that counselor salaries are relatively low, surprisingly little is known about the extent to which salaries vary among counselors or the factors that explain such variation. To what extent do counselor salaries vary by personal characteristics such as counselor education, experience, certification, sex, or race; or by organizational and environmental characteristics such as facility profit status, accreditation, size, degree of union-ization, or geographic location? Without such baseline salary information, administrators have minimal guidance when determining whether their counselors are fairly paid within the field. Furthermore, such information can be valuable in suggesting the level of compensation necessary to retain or recruit specific counselors. Similarly, those considering counseling positions have minimal guidance to determine whether a career in SAT would be financially rewarding to them in the short and long term.
This article attempts to fill these voids by examining several key correlates of counselor salaries. We used data from the 2002–2003 wave of the National Treatment Center Study (NTCS) that includes approximately 1,500 full-time counselors from nationally representative samples of public and private SAT facilities. We examined the relationship between counselor salary and personal and organiza-ional characteristics.
2. Materials and methods
2.1. Sample and data collection
Data are drawn from the 2002–2003 wave of the NTCS, conducted by the University of Georgia under grant support from the National Institute on Drug Abuse. The NTCS focuses on the long-term adaptation of drug treatment organizations to the environmental contexts in which they operate. The NTCS has several components, including nationally representative samples of specialty addiction treatment programs in the public and private sectors.
The NTCS uses a two-stage random sample of treatment programs, stratifying first on geographic location (county) and then sampling treatment facilities within geographic strata. Separate samples were drawn for the public and private treatment center components. In both samples, eligible facilities are organizations offering treatment for alcohol and drug problems, providing a level of care at least equivalent to structured outpatient programming as defined by American Society of Addiction Medicine patient place-ment criteria (Mee-Lee, Gartner, Miller, Schulman, & Wilford, 1996). Excluded from the study are counselors in private practice, halfway houses and residential facilities, DUI or driver education programs, or facilities offering exclusively methadone maintenance services. Because the NTCS focuses on treatment programs that are available to the general public, facilities operated by the Veterans Admin-istration and those based in correctional facilities were also
excluded from the sample. Roughly speaking, these exclu-sion criteria apply to approximately 30% of all SAT programs in the United States; therefore, our data are applicable to counselors in the remaining 70% of all SAT programs in the United States.1
Private sector programs are defined as those receiving b50% of their annual operating revenues from government block grants and contracts; in practice, these centers receive an average of only 11% of their revenues from such sources. They include both for-profit and nonprofit programs. This article reports data from the 401 private programs that were interviewed in 2002–2003. The response rate for this wave of interviews was 87% of those centers that were sampled and eligible.
Using similar stratification and identification procedures, a separate sample of public sector treatment programs was drawn in early 2002. Eligibility rules were the same as those for the private sample, except that public sector programs were defined as receiving at least 51% of their annual operating revenues from federal, state, or local grant sources (including criminal justice funds). In practice, sampled programs received an average of 84% of their annual operating revenues from government funds. The response rate for the 362 public sector facilities interviewed in 2002–2003 was 80%.
Organizational-level data were collected using structured face-to-face interviews with treatment center administrators. These interviews covered a variety of topics about program management and operations, staffing, clinical services, and innovation adoption. During the face-to-face interview, administrators were asked to provide a list of all substance abuse counselors employed by the program. Each counselor was then mailed a questionnaire focusing on personal demographics, program management, workplace climate, services provided, and awareness and use of a variety of evidence-based treatment practices. Questionnaires required approximately 45 minutes to complete. Counselors complet-ing and returncomplet-ing the questionnaire received a $40 incentive payment. The response rate for counselors was 61% for both the private and public programs. The institutional review board of the University of Georgia approved the study’s research design and human subjects protection protocols.
Analyses comparing the demographic characteristics and credentials of responding counselors with the characteristics of all counselors surveyed indicated no significant response bias in either sample (data not shown). Data from both counselor samples (N = 2,287) were pooled for these analyses. Because the analyses presented here are focused on annual salaries, counselors workingb35 hours per week (n = 455) were excluded from the final sample. In addition,
1 According to the 2000 National Survey of Substance Abuse
Treat-ment Services, there are 13,428 SAT programs in the United States, excluding programs based in correctional facilities (U.S. Department of Health and Human Services, 2002). Our exclusion criteria apply to 3,617 (27%) of these programs.
345 full-time counselors were dropped from the regression models because of missing data, resulting in a final study sample of 1,487 full-time counselors.
2.2. Outcome variable: Annual salary
The NTCS collects annual salary data using intervals with nine categories (b$15,000; $15,001–$20,000;
$20,001–$25,000; $25,001–$30,000; $30,001–$35,000; $35,001–$40,000; $40,001–$45,000; $45,001–$50,000; N$50,000). Accordingly, with the exception of the smallest (b$15,000) and largest (N$50,000) categories, we con-structed the outcome variable for the descriptive analyses in this article by taking the midpoint of each category (this is a common approach in labor market studies involving interval-based salary data—see, for example,Ahn & de la
Table 1
Summary statistics of variables
N= 1,487
Variable name M SD Definition Outcome variable
Salary 32.08 8.72 Annual earnings as a counselor at program under study ($1,000) Counselor characteristics
No college degree 0.23 0.42 0 –1 dummy variable; = 1 if counselor does not have a college degree
College degree 0.37 0.48 0 –1 dummy variable; = 1 if counselor has a college degree (but not a graduate degree)
Master’s/Professional degree 0.38 0.49 0 –1 dummy variable; = 1 if counselor has a master’s or professional degree (but not an MD/PhD) MD/PhD 0.02 0.14 0 –1 dummy variable; = 1 if counselor has an MD/PhD
Tenure in field 8.77 6.89 No. of years worked in the SAT field Tenure in field, squared 124.41 178.35 Square of no. of years worked in the SAT field
Licensed 0.26 0.44 0 –1 dummy variable; = 1 if a licensed addictions counselor Certified 0.57 0.49 0 –1 dummy variable; = 1 if a certified addictions counselor
Administrative responsibilities 0.10 0.30 0 –1 dummy variable; = 1 if counselor has administrative responsibilities in addition to role as full-time counselor
Hours per week 42.85 6.74 Hours per week typically worked as a counselor Male 0.39 0.49 0 –1 dummy variable; = 1 if counselor is male White 0.72 0.45 0 –1 dummy variable; = 1 if counselor is White In recovery 0.51 0.50 0 –1 dummy variable; = 1 if counselor is in recovery Program characteristics
Public 0.16 0.36 0 –1 dummy variable; = 1 if program’s profit status is public Private for profit 0.11 0.32 0 –1 dummy variable; = 1 if program’s profit status is private for profit Private not for profit 0.73 0.44 0 –1 dummy variable; = 1 if program’s profit status is private not for profit Accredited 0.52 0.50 0 –1 dummy variable; = 1 if program is accredited by JCAHO or CARF Total counselors 18.45 21.80 No. of counselors employed at program
Admissions (log) 6.52 1.20 Log of the no. of clients admitted to program during the last fiscal year No. of levels of care 3.68 1.85 No. of levels of care offered at program (0–10)
Hospital owned 0.20 0.40 0 –1 dummy variable; = 1 if program is owned by a hospital
Research 0.56 0.50 0 –1 dummy variable; = 1 if program ever participated in a research project involving the clients of the program
Twelve-step model 0.67 0.47 0 –1 dummy variable; = 1 if the program puts emphasis on the 12-step model Union % 9.88 26.98 Proportion of program employees represented by a union
Retirement benefits 0.80 0.40 0 –1 dummy variable; = 1 if program employees participate in retirement plan that includes employer contributions
Region: northeast 0.19 0.39 0 –1 dummy variable; = 1 if program is located in CT, MA, ME, NH, NJ, NY PA, RI, or VT Region: midwest 0.25 0.43 0 –1 dummy variable; = 1 if program is located in IL, IN, IA, KS, MI, MN, MO, NB, ND,
OH, SD, or WI
Region: south 0.27 0.44 0 –1 dummy variable; = 1 if program is located in AL, AR, DE, DC, FL, GA, KY, LA, MD, MS, NC, OK, SC, TN, TX, VA, or WV
Region: west 0.29 0.46 0 –1 dummy variable; = 1 if program is located in AK, AZ, CA, CO, HI, ID, MT, NV, NM, OR, UT, WA, or WY
Population density (log) 8.38 1.57 Log of the no. of people in the program’s county per square mile Client characteristics
Adolescents % 13.01 21.57 Proportion of program caseload who are adolescents Minorities % 39.18 25.87 Proportion of program caseload who are minorities Parolees % 42.02 26.38 Proportion of program caseload who are parolees Women % 40.41 18.82 Proportion of program caseload who are women
Primary alcohol % 42.43 22.77 Proportion of program caseload whose primary diagnosis is alcohol abuse/dependence Primary cocaine % 22.01 20.14 Proportion of program caseload whose primary diagnosis is cocaine abuse/dependence Primary marijuana % 15.63 18.01 Proportion of program caseload whose primary diagnosis is marijuana abuse/dependence Primary methamphetamine % 11.45 17.34 Proportion of program caseload whose primary diagnosis is methamphetamine abuse/dependence Primary opiates % 16.16 17.07 Proportion of program caseload whose primary diagnosis is opiate abuse/dependence
Rica, 1997; Ettner, Frank, & Kessler, 1997; and Fairlie & Meyer, 1999). Counselors in theb$15,000 category (n= 19) were assigned $12,500, which translates to approximately $6.25 per hour based on 2,000 hours per year, whereas counselors in theN$50,000 category (n= 35) were assigned $60,000. Although the assignments in the smallest and largest categories are ad hoc, we believe that both are reasonable and, in any case, we examined the robustness of the descriptive results to alternative assumptions. Impor-tantly, substituting alternative values for the tails of the salary distribution did not alter the substantive findings presented here.
2.3. Explanatory variables
Table 1provides definitions and summary statistics. The explanatory variables fall into two categories: counselor characteristics and program characteristics. We also used client characteristics as control variables.
Counselor characteristics include education (i.e., highest degree attained), tenure in the SAT field (and its square), licensure, certification, administrative responsibilities above and beyond full-time counselor duties (e.g., clinical director, clinical supervisor), sex, race, hours worked per week, and recovery status.
Program characteristics include profit status, accredita-tion, size (i.e., log of admissions, number of counselors employed, number of levels of care), hospital ownership, research involvement, emphasis on the 12-step method, degree of unionization, retirement plan, geographic region in the United States, and population density of the county where the program is located.
Client characteristics represent the average case mix at the respective programs where the counselors are employed and are used in the article as controls rather than as explanatory variables per se. Client characteristics include the proportion of the program’s caseload who are adolescents, minorities,
Table 2
Salary summary statistics by explanatory variablesa(N= 1,487)
Variable name n Salary ($1,000) pb M SD Counselor characteristics Education b.001 No college degree 343 28.2 8.4 College degree 549 29.9 7.3 Master’s/Professional degree 566 36.1 8.2 MD/PhD 29 41.4 10.6
Tenure in SAT field b.001
V7 years 776 29.1 7.6 N7 years 711 35.3 8.7 Licensed b.001 No 1,093 31.2 8.4 Yes 394 34.5 9.1 Certified b.001 No 632 31.0 8.5 Yes 855 32.9 8.8 Administrative responsibilities b.001 No 1,339 31.6 8.2 Yes 148 38.7 10.4
Hours per week .078
35– 40 941 31.8 8.4 N40 546 32.6 9.2 Sex .010 Female 900 31.6 8.0 Male 587 32.8 9.7 Race b.001 Non-White 410 29.7 7.8 White 1,077 33.0 8.9 In recovery b.001 No 722 33.3 8.5 Yes 765 31.0 8.8 Program characteristics Profit status .005 Public 231 31.5 8.3
Private for profit 167 34.2 9.1 Private not for profit 1,089 31.9 8.7
Accredited b.001 No 720 29.1 7.8 Yes 767 34.9 8.6 Total counselors .320 V12 810 31.9 8.9 N12 677 32.3 8.5 Admissions (log) .020 V6.605 744 31.6 8.9 N6.605 743 32.6 8.5 Levels of care b.001 V3 791 30.6 8.3 N3 696 33.8 8.9 Hospital owned b.001 No 1,183 30.8 8.2 Yes 304 37.0 9.1 Research .380 No 655 31.9 8.5 Yes 832 32.3 8.9 Twelve-step model .241 No 494 31.7 8.0 Yes 993 32.3 9.1 Union % .176 V0% 1,251 31.8 8.7 N0% 166 32.7 7.8 Retirement benefits b.001 No 295 29.4 9.4 Yes 1,192 32.8 8.4 Variable name n Salary ($1,000) pb M SD Region b.001 Northeast 279 32.8 8.7 Midwest 369 33.9 8.7 South 403 32.0 8.3 West 436 30.1 8.7
Population density (log) b.001
V8.35 738 30.9 8.3
N8.35 749 33.2 9.0
a For continuous explanatory variables, mean salaries are presented
separately for counselors above and below the median value of the corresponding variable; that is, the median defines the cutpoint for all continuous variables.Table 3, however, uses the full range of data for all continuous variables.
b
P-values are for tests of significant differences across the set of categories within each explanatory variable.
parolees, and women, as well as the proportion of the caseload whose primary diagnosis is alcohol, cocaine, marijuana, methamphetamine, and opiate abuse/dependence. 2.4. Analysis
We first examined salary means disaggregated by counselor and program characteristics (i.e., the explanatory variables). For categorical explanatory variables (e.g., education), salary means are presented separately for counselors belonging to each category of the corresponding categorical variable (e.g., no college degree, college degree,
master’s/professional degree, MD/PhD). For continuous explanatory variables (e.g., tenure in SAT field), salary means are presented separately for counselors above and below the median value of the corresponding continuous variable (e.g.,N7 years,V7 years).
Because there are no controls when comparing raw salary means within and across counselor and program character-istics, it is difficult to draw conclusions about the relation-ship between salary and any specific characteristic. That is, observed differences in salary associated with any given characteristic (e.g., race) may be caused by underlying differences in other characteristics (e.g., education, tenure).
Table 3
Correlates of counselor salary: Interval regression resultsa,b
Variable name
Counselor characteristics (N= 1,487)
Counselor and program characteristics (N= 1,487)
Counselor, program, and client characteristics (N= 1,487) Coefficient p Coefficient p Coefficient p
Counselor characteristics College degreec 2.01 .000 1.30 .005 1.26 .007 Master’s/Professional degreec 7.30 .000 6.06 .000 5.88 .000 MD/PhDc 10.37 .000 8.71 .000 8.46 .000 Tenure in field 0.79 .000 0.62 .000 0.62 .000
Tenure in field, squared 0.01 .000 0.01 .012 0.01 .012
Licensed 1.33 .014 1.48 .001 1.50 .001
Certified 0.00 .997 0.15 .723 0.13 .750
Administrative responsibilities 3.78 .000 4.91 .000 4.87 .000
Hours per week 0.03 .193 0.01 .606 0.01 .740
Male 0.82 .031 0.65 .070 0.60 .089
White 1.27 .006 1.15 .007 1.05 .018
In recovery 0.95 .038 0.94 .014 0.96 .012
Program characteristics
Private for profitd 1.09 .225 0.85 .343
Private not for profitd 0.69 .321 0.57 .405
Accredited 2.28 .000 2.08 .000
Total counselors 0.03 .074 0.02 .126
Admissions (log) 0.05 .856 0.11 .681
No. of levels of care 0.05 .716 0.06 .709
Hospital owned 2.85 .000 2.69 .000 Research 0.14 .780 0.23 .661 Twelve-step model 0.17 .741 0.17 .741 Union % 0.00 .562 0.01 .290 Retirement benefits 1.42 .024 1.22 .054 Region: Midweste 1.02 .179 0.79 .332 Region: southe 0.11 .877 0.26 .728 Region: weste 1.31 .100 1.51 .114
Population density (log) 0.73 .000 0.69 .000
Client characteristicsf No No Yes
Constant 22.85 .000 14.26 .000 17.68 .000
Log likelihood 2,467 2,351 2,341
AdjustedR2 g 0.38 0.47 0.47
a
Boldface entries are statistically significant (pb.05). b The dependent variable is annual salary measured in $1,000. c Excluded category is bno college degree.Q d Excluded category is bpublic.Q e Excluded category is bnortheast.Q
f Client characteristics include proportions of program caseload who are adolescents, minorities, parolees, and women, as well as proportions of program
caseloads having a primary diagnosis of alcohol, cocaine, marijuana, methamphetamine, and opiate dependence/abuse.
g AdjustedR2is obtained from OLS regression models in which the dependent variable is defined as inTable 2. Coefficient estimates from the OLS
Thus, we estimated the key correlates of counselor salary using interval regression models that simultaneously control for counselor, program, and client characteristics.2 Each model coefficient estimates the average association of the corresponding characteristic with counselor salary after controlling for the effects of all other explanatory variables in the model. In all models, we clustered counselors by facility to account for possible correlation among counselors employed by the same facility (the models were run using Stata’s intreg command; Stata Corp, College Station, TX).
3. Results
3.1. Univariate salary statistics
Table 2 shows that annual counselor salaries vary substantially by many specific counselor and program characteristics. For example, counselors with a college degree, master’s/professional degree, or an MD/PhD earn, respectively on average, $1,700, $7,900, and $13,200 more than their nondegreed counterparts. Licensed or certified addictions counselors earn, respectively on average, $3,300 and $1,900 more than their noncredentialed counterparts. Counselors with an administrative role in addition to their duties as full-time counselors earn, on average, an additional $7,100. Male counselors earn, on average, $1,200 more than female counselors. White counselors earn, on average, $3,300 more than minority counselors. And counselors not in recovery earn $2,300 more than their in-recovery counter-parts. Moreover, counselors working in SAT programs that are private for profit, accredited, and owned by a hospital earn more than their counterparts working at SAT programs that are public or private not for profit, nonaccredited, and not owned by a hospital.
The results in Table 2 are robust to alternative assumptions about the average value of counselor salaries that fall within the smallest (b$15,000) and largest (N$50,000) salary categories. Specifically, assuming an average salary of $10,000 for the smallest category (instead of $12,500) and either $53,625 or $70,000 for the largest category (instead of $60,000) has no appreciable effect on the results (sensitivity analyses available from the authors). It is important to recognize that the univariate salary statistics presented inTable 2are unadjusted; that is, they do not control for the effects of other characteristics on salary. For example, the observed differences in annual salary by sex, race, and recovery status may be due to underlying differences in counselor education, tenure in the SAT field, or type of program where employed.
3.2. Interval regression results
When estimating the relationship between annual salary and any specific explanatory variable, it is important to control for the other explanatory variables, as is done in interval regression. Table 3 presents estimates of the adjusted correlates of counselor salary. Column 2 shows the results for the model containing counselor characteristics only, Column 3 shows those for the model containing both counselor and program characteristics, and Column 4 shows those of the full model controlling for counselor, program, and client characteristics.3
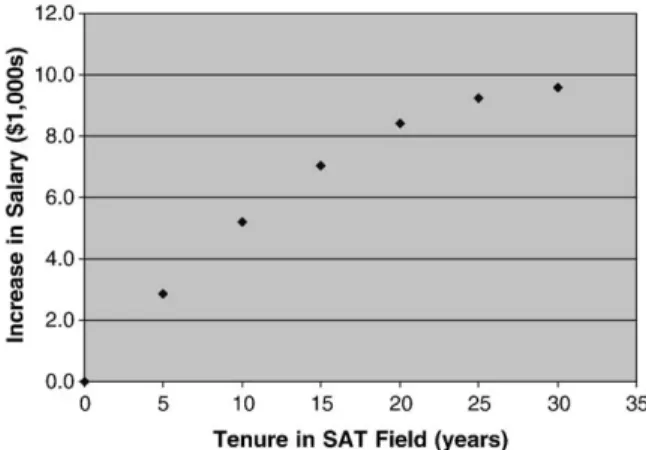
Significant counselor-specific salary correlates include education level, tenure in the SAT field, licensure, admin-istrative responsibilities, race, and recovery status. Both tenure in the SAT field and its square are significant but have opposite signs, indicating that salary increases with tenure but successive increases are smaller each year (see
Fig. 1). Counselor certification, hours worked per week, and sex are nonsignificant. These counselor-specific results are robust across all three model specifications.
Significant program-specific salary correlates include accreditation, hospital ownership, and population density in the county where the program is located. Nonsignificant program characteristics include profit status, size (log of admissions, number of counselors employed, number of levels of care), research, emphasis on the 12-step model, degree of unionization, retirement plan, and region of the country. These program-specific results are robust across both model specifications containing program character-istics (Columns 3 and 4).
4. Discussion
This analysis includes counselor and organizational characteristics that may be associated with counselor 3 AdjustedR2values range from 0.38 to 0.47 and are obtained from
ordinary least squares (OLS) regression models in which the dependent variable is defined as inTable 2.
Fig. 1. Tenure in SAT field versus increase in salary.
2 Interval regression, also known as grouped regression, is designed
specifically for data in which the dependent variable is only observed to fall under a certain interval on a continuous scale and both end intervals are open ended (Stewart, 1983). Thus, interval regression is appropriate to analyze interval-based (or grouped) salary data.
salaries. Among counselor characteristics, we found that education, tenure in the SAT field, administrative responsi-bilities, and race are all significantly associated with counselor salaries. These findings have considerable face validity inasmuch as similar relationships have been found in other wage and salary studies for the last several decades (Alcoholism & Drug Abuse Weekly, 2002; Huffman, 2004; Mincer, 1974; Persico, Postlewaite, & Silverman, 2004). Unique to our article and perhaps most pertinent to the SAT field, we also found that counselor recovery status is associated with salary. These findings are statistically significant and robust across several model specifications.
Counselors with higher education get paid more, as expected. We provide estimates of the raw returns for education (i.e., without controls) as well as the returns for education controlling for other factors. Returns for a college degree, master’s/professional degree, and MD/PhD over high school alone are approximately $1,700, $7,900, and $13,200, respectively, in the raw data. When controlling for the full set of counselor, program, and client characteristics, the returns for education are approximately $1,300, $5,900, and $8,500, respectively. These findings are similar to those found in the National Association of Addiction Treatment Providers’ 2000 Addiction Treatment Salary Survey, in which counselors with college degrees and master’s degrees earned, respectively, $2,000 and $8,000 more than their nondegreed counterparts (Alcoholism & Drug Abuse Weekly, 2002).
The SAT field is experiencing an increase in credential-ing requirements, includcredential-ing licenscredential-ing and certification (Harwood, 2002). Our findings suggest that licensing is associated with significantly higher salaries, controlling for other factors, but certification is not. This is not surprising, however, inasmuch as licensing is less common and thus appears to be a more demanding credential to obtain (i.e., only half as many counselors are licensed [26%] than certified [57%]).
Counselors with administrative responsibilities in addi-tion to full-time counseling duties (e.g., clinical director, clinical supervisor) receive a substantial salary premium. Considering that these individuals report workingz35 hours per week as a counselor, additional administrative responsi-bilities likely require extra time and effort. Additional compensation for this extra time and effort is standard in labor markets. The salary premium may also serve to attract the more talented individuals to these positions.
After controlling for other variables, sex and race effects are smaller than the raw means suggest. Interestingly, although full-time working women are reported to be paid approximately three quarters of what full-time working men are paid across all sectors of the economy (Lewin, 1997a, 1997b), we found only a 3% difference using raw means and no significant difference when controlling for other factors. The lower pay for minorities, even after controlling for other factors, is a finding that has been confirmed in studies in other fields (Huffman, 2004, Persico et al., 2004).
This lower pay for minority counselors alone does not constitute evidence of discrimination within the SAT field as there may be other factors that we cannot observe or measure that might account for the pay differential by race. Such unobserved/unmeasured factors could include a counselor’s competency, willingness to work unusual hours, commitment to the program, willingness to obtain additional training, willingness to treat the most difficult cases, or other aspects that would be financially rewarded.
Counselors in recovery earn, on average, approximately $1,000 less than their not-in-recovery counterparts, even after controlling for personal, program, and client character-istics. This lower payment could occur for several reasons. One is that counselors in recovery are committed to the therapeutic process at a personal level and have less interest or motivation to obtain higher financial rewards (Gallon, 2002). On the other hand, they may be paid less because they have fewer market alternatives due to the stigma attached to being in recovery, because they may be less productive due to a narrower range of counseling skills and interests, or because of other factors that may account for the difference.
Among program characteristics, we found that both accreditation and hospital ownership are significantly associated with higher counselor salaries. We also found that programs located in counties with higher population densities pay more than those located in counties with lower population densities. The impact of accreditation may occur for several reasons. Accreditation may, for example, require a higher-quality staff, where quality is measured in ways other than the counselor characteristics included in our models. Accreditation may also result in larger managed care contracts that, in turn, could afford programs the financial flexibility to offer higher salaries. Counselors working in programs owned by hospitals may benefit from wage spillover effects of being associated with a profes-sional medical facility. Finally, population density may be serving as a proxy for cost of living, with higher-density areas having a higher cost of living that is reflected in higher pay. Other program characteristics such as degree of unionization, profit status, and the treatment center’s emphasis on the 12-step method do not appear to be significantly related to salary.
4.1. Limitations
This article has several limitations. First, as is the case with all salary studies, there are many potentially important worker characteristics that affect salary but are not readily observed or measured, especially in a large survey. Such characteristics include commitment to the job, diligence, positive attitude, willingness to take on challenges, potential for future productivity, and alternative job offers. There may also be unmeasured job characteristics that result in variation in salaries. Jobs that are more difficult or demanding, for example, can result in higher compensation,
and vice versa for easier or more pleasant positions. Thus, although we identified and measured many important correlates of counselor salary, we were not able to identify and measure all such correlates. Second, we do not have data on the dollar value of fringe benefits. Thus, our findings pertain to the key correlates of annual salary only, not to total annual compensation.
Third, regression analysis alone cannot prove that the correlates of counselor salaries are causal. That is, statistical association does not necessarily mean that changes in the independent variables will cause changes in the dependent variable. Nevertheless, we believe that several salary correlates in the study (e.g., education, tenure in the SAT field, administrative responsibilities) are likely to be causal, whereas other salary correlates (e.g., recovery status, race) will require further research so as to be understood fully.
Fourth, there are several sources of potential noise and bias in the data. The NTCS collects salary data using intervals with nine categories; assigning counselor salaries to the midpoints of these intervals likely introduces some noise into the outcome variable used in the descriptive analyses. Moreover, the ad hoc assignment of values in the smallest and largest salary categories may bias the results. However, the amount of such bias is likely to be negligible both because the number of such assignments is very small (b4% of our final study sample fall within these two categories) and because our results are robust across a wide range of alternative assignment values. Also, although we have no reason to believe that there is any bias due to either (1) the response rates of the programs and counselors or (2) counselors who were excluded due to missing data, we cannot rule out these possibilities.
Finally, our findings are not universally generalizable inasmuch as we excluded those SAT facilities that are halfway houses, residential facilities, counselors in private practice, DUI or driver education programs, exclusively methadone maintenance programs, and facilities operated by the Veterans Administration and those based in correc-tional facilities.
4.2. Conclusions
This article identifies and measures many key correlates of counselor salaries. Interestingly, it appears that counselor characteristics (e.g., education, tenure in the SAT field) explain much more of the variation in counselor salaries than do organizational characteristics (e.g., accreditation status, hospital ownership). Understanding the correlates of SAT counselor salaries is a first step in solving some of the key labor and policy issues related to recruiting and retaining qualified SAT counselors. Program administrators, for example, may be able to improve both recruitment and turnover by ensuring that counselors’ salaries are in tune with, or slightly above, what the market pays for worker characteristics. Although our findings are not universally generalizable, they are nevertheless likely to be
general-izable to counselors in approximately 70% of SAT facilities in the United States and should be useful to policymakers, providers, private and public payers, and current and prospective clinicians.
Acknowledgments
We gratefully acknowledge research support from the National Institute on Drug Abuse (Grant Nos. R01DA14471, R01DA13110, and R01DA14482). We also thank Lori Ducharme, Hannah Knudsen, and Mark Schle-singer for their insights.
References
Ahn, N., & de la Rica, S. (1997). The underground economy in Spain: An alternative to unemployment?Applied Economics,29, 733 – 743. Alcoholism & Drug Abuse Weekly. (2002).Special report: Workforce issues,
vol. 14, no. 15(pp. 1– 6). Providence, RI7Manisses Communications
Group Inc.
Ettner, S. L., Frank, R. G., & Kessler, R. C. (1997). The impact of psychiatric disorders on labor market outcomes.Industrial and Labor Relations Review,51, 64 – 81.
Fairlie, R. W., & Meyer, B. D. (1999).Trends in self-employment among White and Black men: 1910–1990. Cambridge, MA7National Bureau of
Economic Research (Working paper #7182).
Gallon, S. L. (2002, November). Continuing education and supervision.
Frontlines(pp. 6). Washington, DC7AcademyHealth.
Gallon, S. L., Gabriel, R. M., & Knudsen, J. R. W. (2003). The toughest job you’ll ever love: A Pacific Northwest treatment workforce survey.
Journal of Substance Abuse,24, 183 – 196.
Harwood, H. J. (2002, November). Survey on behavioral health workplace.
Frontlines(pp. 3). Washington, DC7AcademyHealth.
Huffman, M. L. (2004). More pay, more inequality? The influence of average wage levels and the racial composition of jobs on the Black– White wage gap.Social Science Research,33, 498 – 520.
Johnson, A. J., Knudsen, M. A., & Roman, P. M. (2002). Counselor turnover in private facilities. Frontlines (pp. 5, 8). Washington, DC: Academy Health.
Knudsen, H. K., Johnson, J. A., & Roman, P. M. (2003). Retaining counseling staff at substance abuse treatment centers: Effects of management practices.Journal of Substance Abuse Treatment,24, 129 – 135. Lewin, N. A. (1997a, September 5). Equal pay is leading concern of
working women, survey finds.New York Times, A7.
Lewin, N. A. (1997b, August 23). US details its stance on bias remedies.
New York Times, A8.
McCarty, D. (2002). The alcohol and drug abuse treatment workforce.
Frontlines(pp. 1 – 2). Washington, DC7AcademyHealth.
McLellan, A. T., Carise, D., & Kleber, H. D. (2003). Can the national addiction treatment infrastructure support the public’s demand for quality care?Journal of Substance Abuse Treatment,25, 117 – 121. Mee-Lee, D. L., Gartner, L., Miller, M. M., Schulman, G. D., & Wilford, B. B.
(1996). Patient placement criteria for the treatment of substance-related disorders(2nd ed., pp. 17 – 25). Chevy Chase, MD7American
Society of Addiction Medicine.
Mincer, J. (1974).Schooling, experience, and earnings. Cambridge, MA7
National Bureau of Economic Research.
Mulvey, K. P., Hubbard, S., & Hayashi, S. (2003). A national study of the substance abuse treatment workforce.Journal of Substance Abuse,24, 51 – 57.
Persico, N., Postlewaite, A., & Silverman, D. (2004). The effect of adolescent experience on labor market outcomes: The case of height.
Stewart, M. B. (1983). On least squares estimation when the dependent variable is grouped. Review of Economic Studies, 50, 737 – 753.
U.S. Department of Health and Human Services, Substance Abuse and Mental Health Services Administration, Office of Applied Studies.
(2002). National Survey of Substance Abuse Treatment Services (N-SSATS) 2000: [United States] [Computer file]. ICPSR version.
Arlington, VA: Synectics for Management Decisions, [producer]. Ann Arbor, MI: Inter-University Consortium for Political and Social Research [distributor].