C OV E R S TO R Y
How companies can improve
executive decision making and board oversight
By Brian Ballou, Dan L. Heitger, and Laura Donnell
Managing strategic risk is one of the most challenging aspects of an executive’s job.
Identifying and mitigating risk from a portfolio perspective is complicated and often
resource intensive. As a result, risk-aware organizations continually work to improve
risk identification metrics and measurement techniques. To better identify and
mea-sure risk factors, many companies use an executive dashboard or set of dashboards.
Creating
Effective
Dashboards
Dashboards display key performance metrics in a con-solidated format. By presenting a company’s position updated in real time, dashboards give high-level execu-tives the most pertinent information related to the com-pany’s strategy and risks. Executives often access
dashboards via a Web browser and customize them to fit their individual needs. The dashboard is designed to help an executive make better, more efficient decisions related to risks. Further, board members who oversee risk (e.g., audit or risk committee members, etc.) can use dash-boards to monitor risk exposures between board or com-mittee meetings. Table 1 summarizes the type of
information executive dashboards often contain, the extent of the information, and the various formats for displaying information.
Key Challenges
While many executives recognize the potential for dash-boards to improve their decision making, they acknowl-edge that significant obstacles can dampen or eliminate a dashboard’s value. For example, measurement error or misinterpretation of data can lead users to make worse decisions than if they hadn’t used the dashboard. In late 2008, at the Council on Competitiveness in Delaware, we discussed how risk and resiliency managers determine what to place on their executive dashboards. We learned from the risk executives in attendance that major compa-nies across a wide array of industries rarely use executive dashboards effectively—and, in some instances, don’t even construct them in the first place.
Yet dashboards are promoted as good business intelli-gence tools. To help you sort through the hype and reali-ties about dashboards, we’ll describe the primary challenges organizations face when they plan to imple-ment a dashboard or work with dashboards already in place and offer some ways to combat these challenges. A dashboard can be an excellent tool for identifying and managing key business risks, but executives should make sure that, if they are going to use one, it has been careful-ly designed for their specific organization. There are many styles and formats available, and the best approach for presenting them will vary across companies. Consult-ing firms and software vendors actively promote dash-boards, so executives and owners of risk management and performance measurement systems should ensure that the dashboards being created for their company are developed using a careful filtering process that considers their needs and challenges rather than being driven by the capabilities of existing software.
C OV E R S TO R Y
Table 1:
Content and
Format Considerations
TYPES AND CATEGORIES OF RISK INDICATORS◆ Types of indicators
• Nonfinancial metrics • Financial indicators • Qualitative descriptions
◆ Categories of risk
• Strategic (e.g., leadership, management, and strategy)
• Operational (e.g., value chain business processes)
• Compliance and Legal (e.g., regulations and laws)
• Reporting (e.g., financial reporting, public relations, internal communications) • Credit (e.g., asset recovery)
• Market (e.g., economic environment) • Environmental (e.g., climate change,
carbon emissions, energy use) • Sociopolitical (e.g., workforce issues,
stakeholder engagement)
• Technical (e.g., innovations, information technology)
SCOPE AND DETAIL OF DASHBOARDS
◆ Summary risk information (with/without drill-down
capability to more detailed analyses)
◆ Existing risks only
◆ Emerging risks (including external force data)
DISPLAY OF INFORMATION (FORMAT)
◆ Charts
◆ Traffic lights (i.e., high/medium/low signals)
◆ Relative rankings within silos
◆ Top 10 lists across all risks (i.e., only most
impor-tant risks)
◆ Absolute scores/metrics using key performance
indicators and key risk information with no rank-ings within or across silos
TIMING OF DASHBOARD ◆ Real time ◆ Periodically ◆ Annually ◆ Quarterly ◆ Weekly ◆ Daily
Defining System Requirements
One of the biggest problems organizations face when implementing a new information technology system is inadequately or incorrectly defining their needs for the system prior to buying it externally or developing it inter-nally. When executives inaccurately define their purpose and objectives for a dashboard, they’ll likely end up rely-ing on irrelevant or extraneous data, which could lead to poor decision making and limit the ability for the board of directors to provide effective oversight.
To ensure that a dashboard improves decision making, executives should identify their goals for the dashboard before buying or developing it. For example, some execu-tives use their dashboards to manage day-to-day opera-tions. For this type of use, dashboards typically contain many measures—hundreds in some cases—that range from regulatory compliance to operations in nature. Oth-er executives focus on the big picture and include mea-sures that provide more of a 30,000-foot view of the key risks facing their organizations.
Dashboards should be unique to each company to properly account for differences in organizational struc-ture and culstruc-ture, and executive dashboards might even need to vary from executive to executive within the same organization to lead to improved decision making. Senior management and board members should first determine the nature and extent of information about performance and risks desired for a dashboard. Then, companies should investigate the feasibility and availability of appro-priate metrics to include on the dashboard. Managers who conduct this investigation should talk with those responsible for strategy, risk and resiliency, accounting, etc., as well as information technology experts.
Quantifying strategic risks in an organization can be very challenging, especially when the risks span different areas of the business that compound to create risks of higher magnitude. If dashboards include inaccurate or incorrect measures, they might cause more harm than benefit because they could lead senior executives and board members to make poorer decisions than before the dashboard existed.
Input Assumptions
Another significant challenge is the inability or failure to understand key assumptions and inputs that go into the dashboard model. Information on a dashboard is only as good as the data used to create it, so executives and other key personnel using the dashboard should work closely with IT experts prior to implementing the system to
ensure the database portrays data that’s most useful to executives. Further, key personnel should carefully scruti-nize critical assumptions involved in estimating metrics contained on the dashboard. Stress testing, such as the testing the Federal Reserve carried out in the banking industry in which regulators performed a number of sen-sitivity analyses surrounding risks such as credit, market, and liquidity, help better inform executives about the limitations surrounding the dashboard metrics. Overrelying on the Numbers
Dashboards can provide a breadth of information quick-ly, but overrelying on dashboard metrics without proper-ly understanding their context can distort a senior executive’s overall view of the company. Relying on dash-boards without supplemental information can lead to shortsighted judgments and unproductive decision mak-ing. For example, executives benefit from detailed expla-nations from managers responsible for specific metrics
Dashboards should be unique to
each company to properly account
for differences in organizational
structure and culture, and executive
dashboards might even need to vary
from executive to executive within
the same organization to lead to
improved decision making.
C OV E R S TO R Y
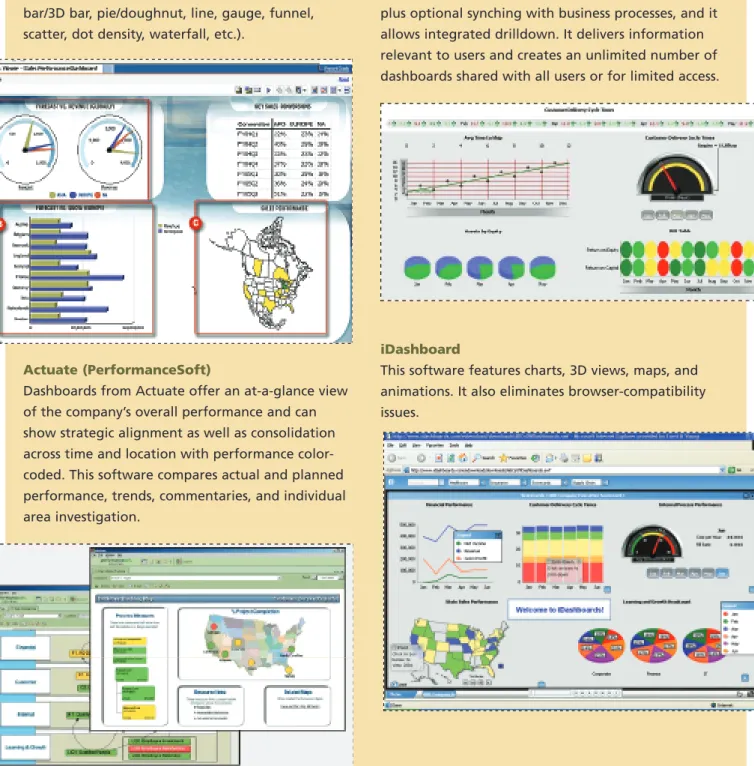
Figure 1:
Sample Dashboards Available in the Marketplace
There are a number of software providers of dashboards that can be designed and implemented as executive dashboards. Here are publicly available samples from four of the industry leaders. Accounting and advisory firms often work with organizations to select an appropriate tool that can be adapted to serve their information and information technology needs. Most dashboards can be adapted for the executive and board of directors’ level or can be used at lower levels of
the organization for a variety of levels of management.
IBM (Cognos)
These dashboards use a variety of charts (crosstab, bar/3D bar, pie/doughnut, line, gauge, funnel, scatter, dot density, waterfall, etc.).
SAP (Business Objects/Pilot Software)
This software provides access to live operational views, plus optional synching with business processes, and it allows integrated drilldown. It delivers information relevant to users and creates an unlimited number of dashboards shared with all users or for limited access.
Actuate (PerformanceSoft)
Dashboards from Actuate offer an at-a-glance view of the company’s overall performance and can show strategic alignment as well as consolidation across time and location with performance color-coded. This software compares actual and planned performance, trends, commentaries, and individual area investigation.
iDashboard
This software features charts, 3D views, maps, and animations. It also eliminates browser-compatibility issues.
about why dashboard metrics might have changed from a previous period or why new metrics have been added. Input Accuracy
Another challenge with dashboards is the risk of having inaccurate metrics or biased information input that can mislead the decision maker. For example, if dashboard metrics come from sales data that employees enter manu-ally (vs. a system that captures data automaticmanu-ally), execu-tives can’t be certain they’re receiving the most relevant or reliable information (e.g., complete, up to date, accu-rate, etc.). Additionally, employees could resist adding data to dashboards if they think they’re being evaluated or monitored unfairly. They could also falsify input data if sufficient controls aren’t in place to protect the data’s integrity. For example, if a company plans to use dash-board measures to evaluate managerial performance, then the company must take extra care to ensure that such metrics are measured as accurately as possible. Further, dashboard metrics should be at least somewhat control-lable by the manager being evaluated to more transpar-ently reflect the quality of their decisions or actions. It’s also important to ensure that the manager can’t manipu-late the data either before or after it’s captured within the dashboard system.
Executives should know the limitations of dashboard metrics. Working with owners of strategy, risk, and per-formance measurement in the organization to supple-ment dashboard metrics with proper context is critical to having an overall perspective of the business.
Honoring Sunk Costs
One pitfall is placing too much emphasis on dashboard metrics because the organization has invested consider-able resources in information systems to produce the dashboard (i.e., falling prey to the sunk-cost fallacy). This overreliance is based on the assumption that the amount spent on an information system correlates with the value of the information it generates. This relationship isn’t always strong (and may not even exist), and companies should work proactively to design a system that’s both helpful and cost effective.
Overreacting to Numbers
Dashboards inherently encourage short-term decision making where executives identify a problem area or met-ric in the red and immediately take action to fix it with-out identifying how the action will affect long-term performance. This error in thinking can be detrimental,
especially when the executive makes a string of reac-tionary decisions based on individual data points rather than focusing on the overall long-term organizational strategy. In addition, actions taken to mitigate one partic-ular risk often elevate exposures in other existing risks or create new ones.
Working Through the Challenges
If implementing effective executive dashboards has so many challenges, why bother with them? Although implementing an effective dashboard can be difficult, executives can design a dashboard that creates value for the organization using an internal transparency strategy. With careful design and execution—and the under-standing that a dashboard is a tool for providing infor-mation to help make decisions and not the source of information—executives and boards can reap significant value from it.
Maintaining transparent communication with all levels of employees (or other key stakeholders, such as board of directors, alliance partners, labor unions, etc.) serves as an effective strategy for ensuring that an executive
dash-Although implementing an effective
dashboard can be difficult,
executives can design a dashboard
that creates value for the
organization using an internal
transparency strategy.
board leads to more effective decision making inside organizations. Transparency ensures that executives clear-ly identify key risk factors at the strategic-entity level and also at lower levels within business processes to better understand the full array of business risks impacting the organization. Therefore, effective dashboards should con-tain important nonfinancial measures, such as customer and employee satisfaction measures, production and sup-ply chain efficiency, or defect rates that represent leading indicators of future impacts (financial or otherwise) that pose significant risks. Using dashboards to recognize emerging risks relatively early—both from a top-down and bottom-up perspective—creates a potential competi-tive advantage by avoiding or limiting the impacts of risk events. One idea is to include a metric on the dashboard that captures employees’ perceptions of transparency.
Also, open communication with employees helps exec-utives design a dashboard that reflects the big picture of the company in a dynamic and accurate way. Executives and IT experts should work together before implementa-tion to ensure that executive and board member expecta-tions are clearly understood and that the dashboard(s) contains relevant information to meet those expectations. Finally, executives should be aware of the tendency to overrely on quantitative metrics and should have other qualitative systems and measures in place to supplement data on the dashboard.
Designing Effective Dashboards
After identifying the challenges associated with dash-boards, developers should identify the best way to capture and display the risk information. There are many styles and formats for dashboards, and the best approach for presenting information probably will vary across organi-zations. Further, there are a number of readily available commercial products, and many accounting and other advisory firms offer services for designing and imple-menting dashboards.
Figure 1 provides four sample dashboard looks from products currently available in the marketplace. For example, executives might choose a single-page summary format or a drill-down dashboard, which allows users to click on specific metrics to access more detailed informa-tion. Drill-down dashboards can be an effective way to examine key risks because they often use real-time inter-active data both at the overall organizational level and at the business-segment level. Although drill-down func-tionality is helpful in many situations, some executives place limits on drill-down capabilities to keep their core
focus on the high-level objectives, strategies, and risks, thereby avoiding the temptation to micromanage the organization.
Additionally, executives should balance both current and emerging risks as well as external-force metrics and internal performance data within dashboards. Dash-boards can include emerging risks that impact strategic initiatives within an organization in a way that executives can adequately evaluate key decisions that will be made soon. Within the broad framework of the executive dash-board, using drill-down features to help identify and understand these risks can be helpful. Further, internal performance data is generally considered more useful for dashboards because it is updated real-time within inter-nal databases. But especially for emerging risks it’s impor-tant to incorporate external-force information into dashboards. As the global economy becomes more inter-connected, the effect of political, economic, social, tech-nology, legal, and environmental risks on achieving strategic objectives will become more pronounced.
A Helpful Tool
Developing executive dashboards is challenging because of the critical need to understand the type of informa-tion, level of detail or access to drill-down data, and for-mat for the display of inforfor-mation necessary for the tool to effectively aid decision making. Although information technology is readily available to capture, aggregate, and display a vast amount of data, organizations should acknowledge that providing too much information—or worse, the wrong information—could reduce the quality of executive decisions. If a company effectively addresses the challenges, executive dashboards can be a helpful tool to improve executive decision making across a number of
important strategic fronts. SF
Brian Ballou, Ph.D., is the Ernst & Young Professor of Accountancy and codirector of the Center for Business Excellence at Miami University. You can reach him at
(513) 529-6213 or [email protected].
Dan L. Heitger, Ph.D., is an associate professor and codirec-tor of the Center for Business Excellence at Miami University and is an IMA Member-at-Large. You can reach him at
(513) 529-6208 or [email protected].
Laura Donnell is a recent graduate of Miami University’s Master of Accountancy and undergraduate accounting programs.