R E S E A R C H
Open Access
Comparisons of the iron deficient metabolic
response in rats fed either an AIN-76 or
AIN-93 based diet
McKale R Davis, Kristen K Hester, Krista M Shawron, Edralin A Lucas, Brenda J Smith and Stephen L Clarke
*Abstract
Background:Previous studies examining the metabolic consequences of dietary iron deficiency have reported elevated serum glucose concentrations in iron-deficient animals. Importantly, the majority of these findings were observed using an earlier version of a laboratory animal diet (AIN-76A) in which the primary carbohydrate source was sucrose–a disaccharide known to negatively impact both glucose and lipid homeostasis. The AIN-76A diet formula was improved in 1993 (AIN-93) to optimize animal nutrition with a major change being the substitution of cornstarch for sucrose. Therefore, we sought to examine the effects of iron deficiency on steady-state glucose homeostasis and the hepatic expression of glucose- and lipid-related genes in rats fed an iron-deficient diet based on either an AIN-76A or AIN-93 diet.
Methods:The study design consisted of 6 treatment groups: control (C; 40 mg Fe/kg diet), iron deficient (ID; ≤3 mg Fe/kg diet), or pair-fed (PF; 40 mg Fe/kg) fed either an AIN-76A or AIN-93 diet for 21 d. Hemoglobin and hematocrit were measured in whole blood. Serum insulin and cortisol were measure by ELISA. Serum glucose and triacylglycerols were measured by standard colorimetric enzyme assays. Alterations in hepatic gene expression were determined by real-time qPCR.
Results:Hemoglobin and hematocrit were significantly reduced in both ID groups compared to the C and PF groups. Similarly, animals in the both ID groups exhibited elevated steady-state levels of blood glucose and insulin, and significantly decreased levels of circulating cortisol compared to their respective PF controls. Serum
triacyglycerols were only increased in ID animals consuming the AIN-76A diet. Hepatic gene expression analyses revealed a ~4- and 3-fold increase in the expression of glucokinase and pyruvate dehydrogenase kinase-4 mRNA, respectively, in the ID group on either diet compared to their respective PF counterparts. In contrast, the expression of lipogenic genes was significantly elevated in the AIN-76 ID group, while expression of these genes was
unaffected by iron status in the AIN-93 ID group.
Conclusions:These results indicate that an impaired iron status is sufficient to alter glucose homeostasis, though alterations in lipid metabolism associated with ID are only observed in animals receiving the AIN-76A diet.
Keywords:Hyperglycemia, Lipogenesis, Insulin, Metabolism, Iron deficiency
* Correspondence:stephen.clarke@okstate.edu
Department of Nutritional Sciences, Oklahoma State University, Stillwater, OK 74078, USA
Background
Iron is an essential nutrient found in abundance in the earth’s crust, yet iron deficiency remains the most com-mon micronutrient deficiency in the world [1]. Symp-toms of iron deficiency include weakness, fatigue, impaired immune function, and reduced cognitive func-tion in children. In animal models, less well character-ized responses to iron deficiency include alterations in lipid and glucose metabolism arising from decreased oxidative capacity which leads to a shift in preferential fuel utilization from fat to glucose [2-4]. Iron-deficient animals also display signs of disrupted metabolic homeostasis, including alterations in insulin signaling, as evidenced by hyperglycemia, hyperinsulinemia, and hyperlipidemia [2,5].
Determining the molecular mechanisms contributing to the hyperglycemic and hyperinsulinemic responses observed in response to dietary iron deficiency is made more complicated since many of the observations in glu-cose metabolism were noted prior to the 1993 American Institute of Nutrition (AIN) reformulation (AIN-93) of the AIN-76A laboratory animal diet, which is simply re-ferred to as AIN-76 in the present study. The AIN-93 rodent diets were formulated to improve animal per-formance in experimental models with a major change being the substitution of cornstarch for sucrose because high dietary concentrations of sucrose were associated with several metabolic complications including hyperlip-idemia, hyperinsulinemia, and fatty liver [6,7]. Therefore, it is difficult to discern the extent to which the metabolic consequences observed in previous studies noting dis-ruptions in metabolic homeostasis were indeed an effect of iron deficiency alone, or rather the effect of dietary carbohydrate (i.e., sucrose) on glucose and lipid metabol-ism in iron-deficient animals.
Another factor complicating the investigation into the metabolic response to iron deficiency is that the severity of these consequences (i.e., hyperglycemia and hyperlip-idemia) appears to be a graded response associated with a reduction in hemoglobin [8]. Hemoglobin levels indi-cative of anemia are associated with elevated plasma triacylglycerols (TAG) and glucose, though less severe reductions in hemoglobin are not as highly correlated with hyperlipidemia and hyperglycemia suggesting that a certain threshold exists in order to develop these poten-tially negative metabolic consequences [8-10]. In con-trast, neither hyperglycemia nor hyperlipidemia were observed at varying levels of anemia in animals fed an AIN-93 based diet, although both glucose utilization and insulin responsiveness appeared to be enhanced [2]. More recently, two studies reported elevated serum
glu-cose and TAG levels in severely iron-deficient
(hemoglobin < 60 g/L) rodents fed an AIN-93 diet, but
the underlying mechanisms contributing to these
metabolic responses were not the primary focus of these investigations [11,12]. Thus, it remains unclear if
these mixed observations from previous studies
are more attributable to the severity of iron deficiency elicited in the animal model, or are instead the result of a carbohydrate-specific response to an iron-deficient diet.
The focus of the current study was to examine the ex-tent to which an impaired iron status is associated with alterations in metabolic homeostasis and changes in hepatic lipogenic gene expression in rats fed iron-deficient diets based on either the AIN-76 or AIN-93 formulations. Animals in the iron-deficient groups, re-gardless of carbohydrate source, exhibited elevated levels of steady-state serum glucose and insulin. Interestingly, serum TAG and the relative abundance of mRNA en-coding proteins responsible for regulating de novo lipo-genesis in the liver was increased only in iron-deficient rats receiving the AIN-76 diet. The results presented herein support a model wherein alterations in glucose homeostasis observed in iron-deficient animals are inde-pendent of dietary carbohydrate whereas alterations in lipid metabolism appear to be dependent of dietary carbohydrate present in the AIN-76 diet. Thus, it is es-sential to consider the metabolic consequences of diets used to study the effects of micronutrient deficiencies in animal models.
Methods Study design
contained 50 g cellulose/kg diet. Previous studies have shown that this level of cellulose (5% w/w) does not ad-versely affect apparent absorption of iron [13]. Individual body weights and food intake were measured daily. After the 21 d experimental period, rats were anesthetized with a mixture of ketamine/xylazine and killed by exsan-guination between 8:00 and 10:00 a.m. Food intake was not restricted prior to sacrifice. All animal handling and procedures were approved by the Institutional Animal Care and Use Committee at OSU.
Assessment of iron status
Whole blood was collected from the abdominal aorta into EDTA-coated tubes and sent to a commercial la-boratory (Antech Diagnostics, Inc. Irvine, CA) for deter-mination of hemoglobin and hematocrit. A sample of whole blood was also collected into serum tubes, allowed to clot, centrifuged at 800 xg for 20 min at 4°C to separate the serum, and then stored at −80°C until further analyses. Serum iron was determined using an ELAN 9000 ICP-Mass Spectrometer (PerkinElmer, Norwalk, CT). Microanalysis of non-heme iron in liver was determined as described by Reboucheet al. [14].
Metabolic indices
Serum glucose was measured using a glucose oxidase kit (Sigma-Aldrich, St. Louis, MO) according to the manu-facturer’s instructions, except that reaction volumes were scaled down to a final volume of 1 mL. Serum was diluted 1:80 (v/v) so that results obtained were within the detectable range of the assay and standard curve. Serum insulin (Crystal Chem, Inc., Downers Grove, IL) and cortisol (R&D Systems, Minneapolis, MN) were
measured by ELISA according to the manufacturer’s instructions. Serum TAG levels were measured using a standard colorimetric assay based on the enzymatic hy-drolysis of triacylglycerol to glycerol and free fatty acids by lipase (Sigma-Aldrich, St. Louis, MO). For all assays, serum samples with obvious signs of hemolysis were excluded from analyses.
Pathway-focused PCR array and qPCR
Changes in gene expression were analyzed by a
pathway-focused Glucose Metabolism PCR array
(SABiosciences, Valencia, CA). Briefly, total RNA was isolated from ~ 100 mg whole liver using STAT-60 (Teltest, Inc., Friendswood, TX). RNA concentration and integrity were determined using a Nanodrop spectro-photometer (Thermo Fischer Scientific, Middletown, VA) and agarose gel electrophoresis, respectively. Total RNA was then treated with DNase I, reverse-transcribed using SuperScript II (Invitrogen, Grand Island, NY), and brought to a final volume of 120μL. The cDNA from in-dividual animals was used as a template for the PCR array according to the array instructions using SYBR green chemistry on an ABI 7900HT system (Applied Biosystems, Grand Island, NY). Data were analyzed using SABiosciences RT2 Profiler PCR Data Analysis software at http://pcrdataanalysis.sabiosciences.com/pcr/ arrayanalysis.php and were considered significant at > 1.3 fold change andP < 0.05. Relative quantitation for each gene was determined by normalizing to 4 house-keeping genes (RPLP1, HPRT1, RPL13A, and ACTB) comparing the ID and PF groups using the 2-ΔΔCt method. For gene expression analysis by qPCR using SYBR green chemistry, cDNA was prepared as described above. Primers for qPCR were designed using Primer Express v 2.0 (Applied Biosystems) and validated if they met the following criteria: (1) single peak on dissociation curve and (2) amplification efficiency slope of−3.3 using titrated standard curve. Additionally, whenever possible, primers were designed such that the amplicon spanned at least one intron. Relative quantitation for each gene was determined using the 2-ΔΔCT method (Applied Bio-systems User Bulletin #2) with Cyclophilin B (Cyclo) as the invariant control. Primer sequences used in these studies are listed in Additional file 1: Table S1.
Statistical analysis
Comparisons of body weight, hemoglobin, hematocrit, and array data within and between treatment groups were analyzed using one-way ANOVA followed by Least Significant Difference as the post hoc test using SPSS software version 17.0 (IBM-SPSS, Chicago, IL). Differ-ences in gene expression between ID and PF groups within each diet were determined using a Student’s
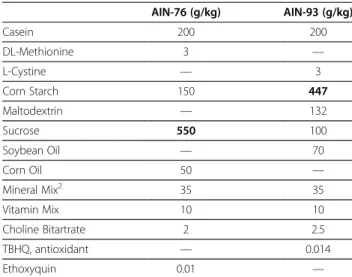
Table 1 Composition of AIN-76 and AIN-93 diets1
AIN-76 (g/kg) AIN-93 (g/kg)
Casein 200 200
DL-Methionine 3 —
L-Cystine — 3
Corn Starch 150 447
Maltodextrin — 132
Sucrose 550 100
Soybean Oil — 70
Corn Oil 50 —
Mineral Mix2 35 35
Vitamin Mix 10 10
Choline Bitartrate 2 2.5
TBHQ, antioxidant — 0.014
Ethoxyquin 0.01 —
1
The 93-C diet contained 397 g/kg corn starch with an added 50 g/kg cellulose. Cellulose was removed from the 93-ID and both AIN-76 diets to prevent contamination with additional iron.
2
t-test. All tests were conducted at the 95% confidence interval and presented as means ± SEM.
Results
Body weight and food intake
Consistent with previous observations, rats in the ID groups consumed significantly less diet and weighed sig-nificantly less than rats in the C groups regardless of diet formulation (Figure 1) [15,16]. At the end of the dietary treatment period, rats in the 76-ID group consumed 13% less diet and weighed 10% less than the 76-C group, whereas rats in the 93-ID group consumed 7% less diet and weighed 5% less than the 93-C group. There were no differences in final body weight between rats in the PF and ID groups on either diet (Figure 1). Interestingly, rats re-ceiving either the 76-C or 76-ID diets consumed signifi-cantly less diet than those receiving the 93-C or 93-ID diet, respectively.
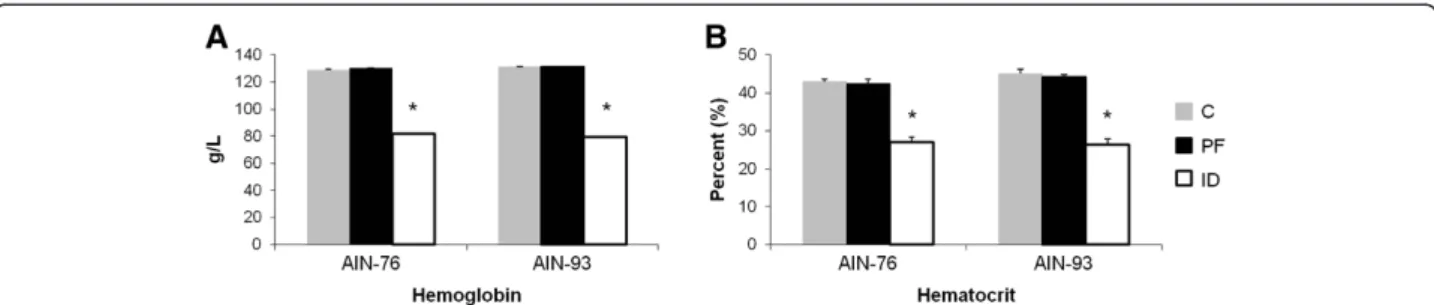
Iron status
Importantly, only the rats in the ID groups exhibited signs of anemia as determined by hemoglobin and hematocrit (Figure 2). Regardless of diet, hemoglobin levels were decreased by ~38% in the ID groups compared to C and PF groups (Figure 2A). Similarly, rats in the 76-ID and 93-ID groups exhibited a ~37% decline in hematocrit values compared to the C and PF groups (Figure 2B). Because of the similarities in hemoglobin and hematocrit between the C and PF rats within each diet group, the remaining com-parisons were made between the ID and PF groups for each diet in order to attribute any observed biological
changes to a diminished iron status rather than a decrease in total nutrient intake. Lastly, serum iron and non-heme liver iron was significantly lower in the ID groups com-pared to the PF groups for both diets (Figure 3A-B).
It is of note that serum iron levels in the 93-PF group
were significantly lower than the 76-PF group
(Figure 3A). Each diet was sent to an independent labora-tory (N·P Analytical Laboratories, St. Louis, MO) for ana-lysis of iron content. The iron content of the 76-C and 93-C diets was 44 mg/kg and 41 mg/kg diet, respectively. Iron content of the 76-ID and 93-ID diets was 3 mg/kg and 2 mg/kg diet, respectively. Thus, when average daily intake of iron is compared by diet (i.e., AIN-76vs. AIN-93), rats receiving the AIN-93 diet consumed less iron those consuming the AIN-76 diet, regardless of iron level in the diet (607.2 ± 25 μg/day for 76-PFvs. 590.8 ± 25
μg/day for 93-PF and 47.6 ± 2μg/day for 76-IDvs. 31.2 ± 1μg/day for 93-ID,data not shown.) Despite these differ-ences, animals in the PF groups met the recommended guidelines for iron intake of at least 525μg Fe/day (based on an intake of 15 g diet/day on a diet containing 35 mg Fe/kg diet) [17]. Interestingly, non-heme liver iron was not different between the 76-PF and 93-PF groups (Figure 3B), and importantly serum iron and non-heme liver iron did not differ between the 76-ID and 93-ID groups (Figure 3A-B).
Steady-State serum levels of glucose, insulin, and triacylglycerols
Serum glucose levels were higher than normal in all groups, but were expected as a result of the method of
anesthesia used in this study [18,19]. Although not sta-tistically significant (P=0.06), serum glucose in the 76-ID group tended to be higher when compared to the 76-PF group (Figure 4A). In animals receiving the AIN-93 diet, serum glucose of rats in the ID group was significantly higher than those in the 93-PF group (P<0.05) (Figure 4A). Serum insulin levels were increased 50% and 100% in the 76-ID and 93-ID groups, respectively, compared to their corresponding PF groups (P<0.05) (Figure 4B). In order to determine if elevated glucose levels were the result of increased circulating cortisol, serum cortisol was determined. Compared to their re-spective PF groups, serum cortisol levels were signifi-cantly decreased in the 76-ID and 93-ID groups (P<0.05) (Figure 4C). Intriguingly, dietary iron deficiency was only associated with elevated serum levels of TAG in rats consuming the AIN-76 diet (P<0.05) (Figure 4D).
Alterations in hepatic gene expression
Using a pathway-focused PCR array approach in addi-tion to tradiaddi-tional qPCR, the expression of genes involved in glucose and lipid metabolism was assessed in the livers of ID and PF animals. Relative to the PF groups, more numerous and significant changes in gene expression were detected in the 76-ID group than the 93-ID group in the PCR array (Table 2). In terms of glu-cose homeostasis, the most notable change in gene
expression that was determined by the glucose metabol-ism PCR array was a ~3.5-fold increase in glucokinase (Gck) mRNA expression in both ID groups (Table 2). In contrast, ATP-citrate lyase (Acly) increased 2.9-fold in the 76-ID group compared to the 76-PF group, though similar changes were not evident in rats receiving AIN-93-based diets (Table 2). The alterations in gene expres-sion of bothGck andAclydetermined by the PCR array
were further validated and confirmed by qPCR
(Figure 5A-B).
Taking a more biased approach to assess iron- and/or diet-dependent changes in gene expression, the hepatic expression of genes involved in glucose, lipid, and iron metabolism was also examined by qPCR. The mRNA abundance of pyruvate dehydrogenase kinase-4 (Pdk4) was increased ~3- and 2-fold in the 76-ID and 93-ID groups, respectively (Figure 5A-B). Similar to the changes in Acly gene expression observed in the 76-ID group, the expression of lipogenic genes such as sterol regulatory binding protein-1c (Srebp1c) and fatty acid synthase (Fas) were also significantly increased in the livers of the 76-ID animals compared to the 76-PF ani-mals (Figure 5A). Compared to the 93-PF group, expres-sion ofSrebp1candFaswas not significantly different in the 93-ID group (Figure 5B). Interestingly, the expres-sion of stearoyl CoA desaturase 1 (Scd1) mRNA, the rate-limiting enzyme involved in the synthesis of
Figure 2Hematologic values indicate that only the ID animals in each group were anemic.Levels of hemoglobin and hematocrit did not differ between AIN-76 and AIN-93 diets. Values are means ± SEM (n = 8). *Indicates statistical significances between groups,p< 0.05.
monounsaturated fatty acids for subsequent incorpor-ation into TAG, was significantly decreased (~60% re-duction) in the 76-ID group compared to the 76-PF group (Figure 5A). Similar results were obtained for the 93-ID group, though when compared to the 93-PF group, the results did not reach the level of statistical significance (Figure 5B). Consistent with previous find-ings of diminished β-oxidation activity in ID, there was significant reduction (70 –80%) in the gene expression of carnitine palmitoyltransferase (Cpt1) in both ID groups regardless of diet (Figure5A-B) [9,10,20]. Lastly, to further confirm that the livers were“sensing”iron de-ficiency in animals receiving an iron-deficient diet, the mRNA abundance of the iron uptake protein transferrin receptor 1 (Tfr1) and the iron-sensing peptide hormone hepcidin (Hamp1) was assessed. As expected, both the 76-ID and 93-ID groups exhibited an increased abun-dance (4– 7-fold) ofTfr1mRNA compared to their re-spective PF groups (Figure 5A-B). Expression ofHamp1
mRNA was significantly repressed (> 99% reduction) in both ID groups compared to their PF counterparts (Figure 5A-B).
Discussion
In the current study, despite a severe dietary iron restric-tion, only a moderate degree of anemia (hemoglobin ~ 80 g/L) was elicited. Interestingly, even a moderate in-duction of iron deficiency appears to contribute to eleva-tions in both steady-state levels of serum glucose and insulin regardless of basal diet formulation. Others have postulated that an increase in serum glucose may be due, at least in part, to an elevation of cortisol observed in severely anemic rats [21,22]. Interestingly, the relative decrease in cortisol in the ID groups in the current study suggests that other mechanisms may be responsible for the presence of hyperglycemia. In fact, the results of this study are in agreement with those obtained in a human study wherein patients with severe iron deficiency exhib-ited reduced cortisol secretion [23]. In addition to the relative hyperglycemia, a relative hyperinsulinemia was observed in the ID animals in both groups as well. These metabolic adaptations presumably occur as a compensa-tory means as ID animals preferentially utilize glucose, rather than fat, as a metabolic substrate for peripheral tissues as a result of decreased hemoglobin levels and subsequent decreased oxidative capacity [4,9,10]. Thus, blood glucose levels likely remain elevated to ensure that adequate fuel substrate is available for energy produc-tion, and insulin levels may remain elevated to facilitate the entry of glucose into insulin-dependent tissues.
In an effort then to further interrogate the underlying metabolic changes that occur with iron deficiency, we examined the hepatic expression of 84 genes involved in maintenance of glucose homeostasis. The level of signifi-cance (fold change ≥ 1.3), while small, was considered significant as previous studies have shown that dietary intervention(s) tend to elicit somewhat modest, yet bio-logically meaningful, transcriptional responses [24,25]. The ID rats in each group exhibited modest, but signifi-cant alterations in the expression of genes representative of glucose metabolism. Notable changes in gene expres-sion include those genes associated with metabolic path-ways including both glycolysis and gluconeogenesis and are in agreement with the findings of others [2,10,26].
Figure 4Serum levels of glucose and insulin were significantly increased, while cortisol levels were significantly decreased in the ID groups.ID resulted in significantly increased serum triglycerides in rats consuming the AIN-76 diet, but did not have an effect on rats consuming the AIN-93 diet. Values are given as means ± SEM (n=4-8). *Indicates statistical difference between ID and PF animals within each diet group, p< 0.05.
Table 2 Relative fold-change in mRNA abundance of genes involved in glucose metabolism1
Gene Name Gene Symbol AIN-76 AIN-93
Glucokinase Gck +3.4 +3.9
ATP-citrate lyase Acly +2.9 NC
Aconitase 1 (cytosolic; IRP1) Aco1 +1.3 +1.6
Pyruvate dehydrogenase (lipoamide) beta
Pdhb +1.5 NC
Phosphoglucomutase 3 Pgm3 +1.5 NC
Ribose 5-phosphate isomerase A Rpia +1.5 +1.4
Glycogen synthase 2 (liver specific) Gys2 −1.3 −1.6
2,3-bisphosphoglycerate mutase Bpgm −1.3 −1.4
1
The significant increase in Gck expression is likely due to the relative increase in circulating insulin levels observed in the ID groups, as insulin is a known inducer of hepatic Gck mRNA expression [27,28]. Increased ex-pression of Gck could potentially be very important as ID animals have been shown to have an increased reli-ance on glucose as a metabolic substrate, andGckis able to rapidly increase the rate of glucose phosphorylation in the liver in response to the elevations in blood glucose levels [27]. Furthermore, as Gck catalyzes the first step in hepatic glucose utilization it can contribute multiple pathways including glycogen synthesis, glycolysis, andde novo lipogenesis which could explain the enhanced glu-cose utilization and hyperlipidemia reported in response to dietary ID [2,10,26,29,30].
The significant increase inGckmRNA expression, pre-sumably in response to the elevated insulin levels, sug-gests that insulin signaling in ID animals is at least partially intact. However, previous observations suggest that alterations in metabolic gene expression are indica-tive of an impaired hepatic insulin response wherein ID animals exhibited a form of mixed insulin resistance [5]. Under normal conditions (e.g., iron sufficiency) when in-sulin levels are elevated in a fed state, inin-sulin acts both to repress gluconeogenic gene expression and to simul-taneously activate lipogenic gene expression [31,32]. In contrast, chronic hyperinsulinemia contributes to a
combination of hepatic insulin resistance in which the insulin-dependent activation of lipogenic gene expres-sion remains intact, but gluconeogenic gene expresexpres-sion is inadequately repressed [5,30,33]. In this model of mixed insulin resistance, insulin acts through the mam-malian target of rapamycin complex 1 to activate lipo-genesis via a Srebp1c-dependent increase in lipogenic gene expression, whereas insulin-induced phosphoryl-ation of the transcription factor forkhead box protein O1 is diminished such that gluconeogenic gene expres-sion remains inappropriately active [33]. Thus, mixed insulin resistance remains a candidate mechanism explaining the relative hyperglycemia and hyperlipid-emia reported in ID animals. Despite changes in hepatic insulin signaling, peripheral tissue insulin sensitivity as assessed by glucose clearance appears to be enhanced with ID [2,4]. The extent to which there are tissue-specific differences in insulin signaling in
response to iron deficiency warrants additional
investigation.
To further investigate potential factors contributing to hypertriacylglycerolemia that has been reported in iron-deficient animals, changes in hepatic lipogenic gene ex-pression were assessed in the PF and ID groups on both diets. In fact, it was the finding of increased lipogenic gene expression in iron-deficient animals consuming an AIN-76-based diet that stimulated the comparison of
the AIN-76 and AIN-93 diets [5]. As early as 1982 it was speculated that causes of metabolic complications observed in animals consuming an AIN-76 diet were related to sucrose, the primary carbohydrate source in the AIN-76 formulation [34]. Not surprisingly, basal levels of the lipogenic genesAclyandFaswere higher in the 76-PF group compared to the 93-PF group, though the expression of the lipogenic master transcriptional regulatorSrebp1cremained largely unchanged. Nonethe-less, compared to the PF group, lipogenic gene expres-sion was further significantly enhanced only in animals consuming an iron-deficient AIN-76 diet. Elevated levels of TAG in the 76-ID group suggest a functional conse-quence of enhanced lipogenic gene expression resulting is de novo fatty acid synthesis and packaging into TAG destined for secretion from the liver. Although the levels of liver TAG were not determined in the present study, taken together these data provide compelling evidence that consumption of an iron-deficient yet high-sucrose diet may result in more severe metabolic complications
leading to hyperglycemia, hyperinsulinemia, and
hyperlipidemia.
Despite the differences observed in lipogenic gene expression and serum TAG between diets and consist-ent with the findings of others that β-oxidation is decreased in response to dietary ID, the mRNA ex-pression of Cpt1 was found to be significantly reduced in both the 76- and 93-ID groups. The expression of the iron-containing enzyme Scd1 was also decreased in the 76-ID group, with the same trend being observed in the 93-ID group. Importantly, expression of the mRNA encoding for the iron uptake protein
Tfr1 was significantly increased while expression of the iron sensor Hamp1 was significantly decreased in both ID groups. Furthermore, the relative abundance of both Tfr1 and Hamp1 mRNA was not different be-tween diets for either the PF or ID animals indicating a similar response to dietary ID, regardless of basal diet. No differences in serum iron or non-heme liver iron between the ID groups on either diet also show that a similar degree of iron deficiency was induced in both ID groups. The moderate level of iron defi-ciency achieved in this study may serve as an explan-ation for the differences noted in lipogenic gene expression and serum TAG. Previous work investigat-ing the metabolic lipid response to varyinvestigat-ing degrees of
iron deficiency on an AIN-93 based diet only
observed a significant increase in serum TAG at hemoglobin ≤ 66 g/L, a level which is consistent with
data suggesting that the severity of metabolic
responses to iron deficiency is most highly associated with reductions in hemoglobin [2,4,8,12,35]. Interest-ingly, despite a more modest induction of iron defi-ciency for the current study (hemoglobin = 80 g/L),
relative elevations in serum glucose and insulin levels were still observed in both the 76-ID and 93-ID groups.
Our findings support the work of others that have clearly demonstrated that even a moderate induction of iron deficiency is sufficient to disrupt normal glucose homeostasis in rodents [2,3,8-10,12,26]. To date, rela-tively little evidence is available for humans, but an asso-ciation between ID and elevated hemoglobin A1C (HbA1c) levels has been observed [36]. Indeed, as iron status is improved, levels of HbA1c return to more nor-mal levels [36]. Interestingly, despite what some attribute to so-called over-nutrition, ID is also commonly observed in overweight and obese individuals, a popula-tion in which metabolic homeostasis is often disrupted [37-39]. The potential for ID to contribute to or exacer-bate conditions wherein normal glucose and fat metab-olism are already impaired will be the focus of future investigations.
Currently, the specific mechanisms contributing to iron deficient-induced hyperglycemia remain elusive, but the findings presented herein support the hypoth-esis that a depletion of iron status, regardless of dietary carbohydrate source, is sufficient to disrupt systemic glucose homeostasis in a weanling rat model of iron de-ficiency. Intriguingly, enhanced expression of the lipo-genic genes Srebp1c, Acly, and Fas was only observed in the ID-76 group. The extent to which these results are suggestive of an iron-level by carbohydrate (i.e., su-crose) interaction remains unknown and is the focus of future studies. To this end, it will also be important to closely examine the changes in nutrient sensing and in-sulin signaling that occur in response to dietary iron deficiency across different tissues such as the liver and skeletal muscle. The significant increase in Gck expres-sion in both ID groups provides some of the first insight into the means by which glucose uptake and utilization is altered in response to iron deficiency [2,9,26]. Future work should focus on the biological sig-nificance of this and the other somewhat modest tran-scriptional changes that occurred with particular attention to the allocation of glucose to various pathways.
Conclusions
Additional file
Additional file 1:Table S1.Gene Symbols, NCBI Accession Numbers, and Primer Sequences for qPCR.
Abbreviations
AIN: American Institute of Nutrition; C: Control; ID: Iron deficient; PF: Pair fed; TAG: Triacylglycerol; Gck: Glucokinase; Acly: ATP-citrate lyase; Aco1: Aconitase 1; Phdb: Pyruvate dehydrogenase (lipoamide) beta;
Pgm3: Phosphoglucomutase 3; Rpia: Ribose 5-phosphate isomerase A; Gys1: Glycogen synthase 1; Gys2: Glycogen synthase 2; Bpgm: 2,3-bisphosphoglycerate mutase; Pdk4: Pyruvate dehydrogenase kinase-4; Cpt1: Carnitine palmitoyltransferase; Fas: Fatty acid synthase; Scd1: Stearoyl-CoA desaturase; Srebp1c: Sterol regulatory element binding protein-1c; Tfr1: Transferrin receptor 1; Hamp1: Hepcidin.
Competing interest
McKale R. Davis, Kristen K. Hester, Krista M. Shawron, Edralin A. Lucas, Brenda J. Smith, and Stephen L. Clarke have no competing interests.
Authors’contributions
MRD and SLC designed the research. MRD, KKH, KMS and SLC conducted the research. MRD, KKH, EAL, BJS, and SLC collected and analyzed data. MRD, BJS, EAL, and SLC wrote the paper. All authors read and approved the final manuscript.
Acknowledgement
This research was supported in part by NIH grant 1R15DK088721-01 (Clarke SL) and by USDA/CSREES grant 2008-35200-04445 (Clarke SL).
Received: 4 September 2012 Accepted: 25 October 2012 Published: 30 October 2012
References
1. McLean E, Cogswell M, Egli I, Wojdyla D, de Benoist B:Worldwide prevalence of anaemia, WHO Vitamin and Mineral Nutrition Information System, 1993-2005.Public Health Nutr2009,12(4):444–454.
2. Borel MJ, Beard JL, Farrell PA:Hepatic glucose production and insulin sensitivity and responsiveness in iron-deficient anemic rats.Am J Physiol 1993,264:E380–E390.
3. Davies KJ, Donovan CM, Refino CJ, Brooks GA, Packer L, Dallman PR:
Distinguishing effects of anemia and muscle iron deficiency on exercise bioenergetics in the rat.Am J Physiol1984,246:E535–E543.
4. Farrell PA, Beard JL, Druckenmiller M:Increased insulin sensitivity in iron-deficient rats.J Nutr1988,118:1104–1109.
5. Davis MR, Rendina E, Peterson SK, Lucas EA, Smith BJ, Clarke SL:Enhanced expression of lipogenic genes may contribute to hyperglycemia and alterations in plasma lipids in response to dietary iron deficiency. Genes Nutr2012,7:415–425.
6. Reeves PG:Components of the AIN-93 diets as improvements in the AIN-76A diet.J Nutr1997,127:838S–841S.
7. Sanchez-Lozada LG, Mu W, Roncal C, Sautin YY, Abdelmalek M, Reungjui S, Le M, Nakagawa T, Lan HY, Yu X, Johnson RJ:Comparison of free fructose and glucose to sucrose in the ability to cause fatty liver.Eur J Nutr 2010,49:1–9.
8. Borel MJ, Smith SH, Brigham DE, Beard JL:The impact of varying degrees of iron nutriture on several functional consequences of iron deficiency in rats.J Nutr1991,121:729–736.
9. Brooks GA, Henderson SA, Dallman PR:Increased glucose dependence in resting, iron-deficient rats.Am J Physiol1987,253:E461–E466.
10. Linderman JK, Brooks GA, Rodriguez RE, Dallman PR:Maintenance of euglycemia is impaired in gluconeogenesis-inhibited iron-deficient rats at rest and during exercise.J Nutr1994,124:2131–2138.
11. Yamagishi H, Okazaki H, Shimizu M, Izawa T, Komabayashi T:Relationships among serum triacylglycerol, fat pad weight, and lipolysis in iron-deficient rats.J Nutr Biochem2000,11:455–460.
12. Yamagishi HaK T:Alteration of glucose metabolism and increased fructosamine in iron-deficiency anemic rats.Nutr Res2003,23:1547–1553.
13. Gordon DT, Besch-Williford C, Ellersieck MR:The action of cellulose on the intestinal mucosa and element absorption by the rat.J Nutr1983,
113:2545–2556.
14. Rebouche CJ, Wilcox CL, Widness JA:Microanalysis of non-heme iron in animal tissues.J Biochem Biophys Methods2004,58:239–251.
15. Chen OS, Schalinske KL, Eisenstein RS:Dietary iron intake modulates the activity of iron regulatory proteins and the abundance of ferritin and mitochondrial aconitase in rat liver.J Nutr1997,127:238–248. 16. Katsumata S, Katsumata-Tsuboi R, Uehara M, Suzuki K:Severe iron
deficiency decreases both bone formation and bone resorption in rats. J Nutr2009,139:238–243.
17. Subcommittee on Laboratory Animal Nutrition CoAN, Board on Agriculture, National Research Council:Nutrient Requirements of Laboratory Animals. 4th edition. Washington D.C.: The National Academies Press; 1995. 18. Brown ET, Umino Y, Loi T, Solessio E, Barlow R:Anesthesia can cause
sustained hyperglycemia in C57/BL6J mice.Vis Neurosci2005,22:615–618. 19. Pomplun D, Mohlig M, Spranger J, Pfeiffer AF, Ristow M:Elevation of blood glucose following anaesthetic treatment in C57BL/6 mice.Horm Metab Res2004,36:67–69.
20. Gregg SG, Mazzeo RS, Budinger TF, Brooks GA:Acute anemia increases lactate production and decreases clearance during exercise.J Appl Physiol1989,67:756–764.
21. Campos MS, Barrionuevo M, Alferez MJ, Gomez-Ayala AE, Rodriguez-Matas MC, Lopez Aliaga I, Lisbona F:Interactions among iron, calcium, phosphorus and magnesium in the nutritionally iron-deficient rat.Exp Physiol1998,83:771–781.
22. Dallman PR, Refino CA, Dallman MF:The pituitary-adrenal response to stress in the iron-deficient rat.J Nutr1984,114:1747–1753.
23. Saad MJ, Morais SL, Saad ST:Reduced cortisol secretion in patients with iron deficiency.Ann Nutr Metab1991,35:111–115.
24. Gaj S, Eijssen L, Mensink RP, Evelo CT:Validating nutrient-related gene expression changes from microarrays using RT(2) PCR-arrays.Genes Nutr 2008,3:153–157.
25. Jae-Eun Pie Y-RK, In-Kyoung K, Sang-Hui S, Seung Ho L, Hee Ra L, Young Y, Ji Tae C, Jong Pil Y, MoonJu O, Seung Yong H, Meyoung-Kon K:Correlation between nutrition intake and gene expression profiles in children with asthma.Mol Cell Toxicol2010,6:313–319.
26. Henderson SA, Dallman PR, Brooks GA:Glucose turnover and oxidation are increased in the iron-deficient anemic rat.Am J Physiol1986,
250:E414–E421.
27. Iynedjian PB:Molecular physiology of mammalian glucokinase.Cell Mol Life Sci2009,66:27–42.
28. Iynedjian PB, Marie S, Gjinovci A, Genin B, Deng SP, Buhler L, Morel P, Mentha G:Glucokinase and cytosolic phosphoenolpyruvate
carboxykinase (GTP) in the human liver. Regulation of gene expression in cultured hepatocytes.J Clin Invest1995,95:1966–1973.
29. Hagiwara A, Cornu M, Cybulski N, Polak P, Betz C, Trapani F, Terracciano L, Heim MH, Ruegg MA, Hall MN:Hepatic mTORC2 activates glycolysis and lipogenesis through Akt, glucokinase, and SREBP1c.Cell Metab 2012,15:725–738.
30. Shimomura I, Matsuda M, Hammer RE, Bashmakov Y, Brown MS, Goldstein JL:Decreased IRS-2 and increased SREBP-1c lead to mixed insulin resistance and sensitivity in livers of lipodystrophic and ob/ob mice. Mol Cell2000,6:77–86.
31. Accili D, Arden KC:FoxOs at the crossroads of cellular metabolism, differentiation, and transformation.Cell2004,117:421–426.
32. Horton JD, Goldstein JL, Brown MS:SREBPs: transcriptional mediators of lipid homeostasis.Cold Spring Harb Symp Quant Biol2002,
67:491–498.
33. Li S, Brown MS, Goldstein JL:Bifurcation of insulin signaling pathway in rat liver: mTORC1 required for stimulation of lipogenesis, but not inhibition of gluconeogenesis.Proc Natl Acad Sci U S A2010,
107:3441–3446.
34. Medinsky MA, Popp JA, Hamm TE, Dent JG:Development of hepatic lesions in male Fischer-344 rats fed AIN-76A purified diet.Toxicol Appl Pharmacol1982,62:111–120.
35. Stangl GI, Kirchgessner M:Different degrees of moderate iron deficiency modulate lipid metabolism of rats.Lipids1998,33:889–895.
37. Lecube A, Carrera A, Losada E, Hernandez C, Simo R, Mesa J:Iron deficiency in obese postmenopausal women.Obesity (Silver Spring)2006,
14:1724–1730.
38. Pinhas-Hamiel O, Newfield RS, Koren I, Agmon A, Lilos P, Phillip M:Greater prevalence of iron deficiency in overweight and obese children and adolescents.Int J Obes Relat Metab Disord2003,27:416–418.
39. Yanoff LB, Menzie CM, Denkinger B, Sebring NG, McHugh T, Remaley AT, Yanovski JA:Inflammation and iron deficiency in the hypoferremia of obesity.Int J Obes (Lond)2007,31:1412–1419.
doi:10.1186/1743-7075-9-95
Cite this article as:Daviset al.:Comparisons of the iron deficient metabolic response in rats fed either an AIN-76 or AIN-93 based diet.
Nutrition & Metabolism20129:95.
Submit your next manuscript to BioMed Central and take full advantage of:
• Convenient online submission
• Thorough peer review
• No space constraints or color figure charges
• Immediate publication on acceptance
• Inclusion in PubMed, CAS, Scopus and Google Scholar
• Research which is freely available for redistribution