Saturated Load Forecasting Based on Per Capita Electricity Load
Battogtokh Battsooj
1Chen Yuchen
1Xing Jiangtao
1Shiyao
2Zhu Shujie
21. Shanghai University of Engineering Science 2. Shanghai University of Electric Power
1.
Introduction
Power load forecasting is one of the basic links in the construction of smart grid. Precise and timely load forecasting is the basis for smart grid to achieve energy saving, meticulous dispatching management and the foundation of power grid’s early warning[1-2]. As the load scale of power demanding saturation stage in power grid,the prediction of Saturation load’s level helps to determine the final size of the power grid, which is extremely significant to ensure the sustainable development and planning of power grid.The saturated load has two aspects: first, the scale of the whole social electricity consumption in the region into the stage of saturated growth; two, the scale of the annual maximum load in the region into the stage of saturation growth. This paper mainly uses the method of per capita electricity consumption to predict the saturation scale and saturation time of the whole social electricity consumption in a city in East China.
2.
Prediction method Based On Per Capita Electricity
According to the overall planning and all kinds of special planning, studying the maximumsize of the population adapt to the environment and resources first, and referring to foreign major developed countries per capita consumption, and determiningper capita consumption of saturated city, on this basis, the scale of the city saturation load is calculatedand the approximate time of the electricity demand in the city store is estimated. The idea of the method of saturated load forecasting based on per capita electricity is as follows:the product of saturated annual population and per capita saturated electricity consumption is the saturated scale of total electricity consumption in the area, as shown in formula (1)and the saturated scale of peak load can be obtained according to the formula (2)[3-6].
a s
s
N
Q
Q
(1)max s
s
Q
/
T
P
(2)In the formula (1) and (2)
Abstract: Aiming at the difficulty of evaluating the peak load utilization hours in traditional saturated load forecasting, a saturated prediction method based on per capita electricity load is proposed. The method uses unidimensional Logistic model to predict the per capita electricity load and the population saturation value, and the saturation load is effectively obtained by the product of the two. The example in the paper shows that the method is feasible.
s
Q: The scale of electricity consumption in the whole society,
a
Q: The Scale of per capita consumption of electricity
:The Scale of peak load
max
T : The peak load usinghourage
Formula (1) and (2) show the traditional model of the saturation load forecastingbased on per capita electricity method. The prediction of total social electricity consumption used in this paper is the same as that in the previous article. Its load forecasting model is :
a s
s
N
*
Q
P
(3)In the formula (3)
a
Q: The scaleof per capita electricity load saturation
3. Logistic Forecasting ModelBased On Per Capita Saturation Load
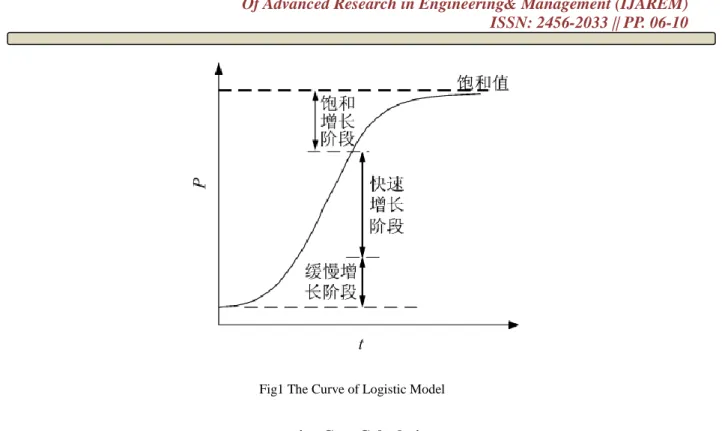
Because of the size of the population, per capita consumption per capita and the development history of the electric load is the load of such a law, which started slowly, then there is a stage of rapid development, to a certain extent because of resource, environment and demand constraints, the growth rate of the scale of development becomes comparatively slow until the respective tends to be stable.Such a whole process shows the trend in development of a S type curve. The Logistic curve of population size, per capita consumption and per capita S power load development to fit and forecast, according to the predictive value of these factors into the equation (1) and (3), you can get the future electricity with the development trend of power load demand.
The mathematical expressions of Logistic model (4) is
bt
e
a
k
*
1
y
t
(3)K>0, a>0, b<0.This curve model plays an important role in the market share of new products, the development and change process of biological groups, population growth, urban electricity consumption and the prediction of economic development and change process, and has also been widely adopted. According to the law of load growth, the whole cycle of load growth can be roughly divided into slow growth stage, rapid growth stage, and saturated growth stage, such as Figure 1.
s
Fig1 The Curve of Logistic Model
4. Case Calculation
The data selected by the case are data from a city in East China, which include electricity consumption, load and population, as shown in Table 1
Table1 Electricity Consumption, Load and Population Data ofACity In East China
Year Electricity Consumption/108kWh Load/MW Population/104
2000 9.9 182.3 66.8
2001 12.6 224.1 67.2
2002 16.7 303.2 67.6
2003 20.3 362.8 68.0
2004 24.1 419.1 68.8
2005 31.4 552.7 69.7
2006 37.5 680.3 70.7
2007 43.2 799.1 71.6
2008 45.2 829.0 72.4
2009 49.2 963.7 73.0
2010 56.3 1066.3 74.0
2011 63.5 1231.1 74.7
2012 67.7 1321.4 75.3
Fig2. The Logistic Fitting Forecast Curve of The City Population
The Logistic fitting forecast curve of the city's per capita electricity consumption development trend is shown in Figure 3.According to Figure 3, the city's per capita electricity consumption is basically saturated in 2030, and its saturation scale is 13340 (kWh) for oneperson.
Fig3. The Logistic Fitting Forecast Curve of The City’s Per Capita Electricity Consumption
The Logistic curve fitting prediction curve of the city's per capita electricity load development trend is shown in Figure 4. According to figure 4, the city's per capita electricity consumption is basically saturated in 2028, and its saturation scale is 2315W for one person.
The Logistic curve of the city’s population, the per capita consumption and per load conditions for fitting and prediction, the predicted household population, per capita consumption per capita reached saturation load size and year, the saturation of electricity and saturation load are shown in table 2.
表2 该市用电量与最大负荷饱和值预测结果
Table2.The Forecasting results of the Power Consumption and the Peak SaturationLoad ofTheCity
Electricity
Consumption/108kWh
Load/MW
Saturated year 2030 2028
Saturation Scale 116 2012
5. Conclusion
At present, there isa littleforecasting model for saturated load, and different models have different emphasis. Because the peak load utilization hours don’t have obvious development rules, so it’s difficult to get a reasonable saturated load prediction value by directly calculating saturated load values by saturation power consumption. This paper provides a prediction model of saturated load based on per capita electricity consumption method. This method does not need to estimate the maximum load utilization hours, but uses the more obvious electricity consumption per capita and population to predict the load saturation scale. The feasibility of the method is proved by an example in this paper, which is also enlightening to the prediction of saturated load.
Reference
[1]. WANG Wei, FANG Ting-ting. The application of per-personelectricity consumption method in
saturation load forecasting [J]. Power Demand Side Management,2012,20 ( 6 ): 34-38
[2]. CUI Kai, LI Jing-ru, LIU Hai-bo, etal. City's power planningmethods at the stage of load saturation and
its application inJinan power grid [J]. Power System Technology,2007,31(S2) : 14
[3]. CUI Kai, ZHANG Li-juan, LI Jing-ru, et al. Analysis andforecast of saturated load for the central city
district of Tianjin [J]. Electric Power Technologic Economics,2008,20 ( 5 ) :33-36.
[4]. CUI Kai, LI Jing-ru, ZHAO Biao, etal.Research on citysaturated load and its forecast methods. Electric
PowerTechnologic Economics,2008,20( 6) : 34-38.
[5]. JIA Yu-dong,LI Sheng-hu,TAN Yun,et al. Improved parametricestamation of logistic model for
saturated load forecast [C]. Power and Energy Engineering Conference, Shanghai:2012: 1-4.
[6]. Papadopoulos S, Karakatsanis I. Short-term electricityload forecasting using time series and ensemble