n TABLE OF CONTENTS
PAGE
LIST OF FIGURES iii
LIST OF TABLES iv
I. INTRODUCTION 1
II. BACKGROUND
Performance Criteria 4
Tracer Gas Technique 8
Statement of Thesis 10
Protocol 11
III. METHODS AND MATERIALS 12
Sulfur Hexafluoride Sampling Strategy 17
Formaldehyde Sampling Stragety 22
IV. RESULTS AND DISCUSSION
Tracer Gas Study Results 24
Formaldehyde Sampling Results 33
V. CONCLUSIONS AND RECOMMENDATIONS 34
BIBLIOGRAPHY 36
APPENDIX A: Health Effects of Formaldehyde 40
APPENDIX B: Formaldehyde Generation Rate Determination 49
APPENDIX C: Calibration of the Long Path Infra-Red Analyzer 51
Gas Analyzer
n 1
LIST OF FIGURES
PAGE
1 Necropsy Laboratory 14
2 Necropsy Hood 15
3 Necropsy Work Station 16
4 12 Point Traverse Locations for Necropsy Hood 19
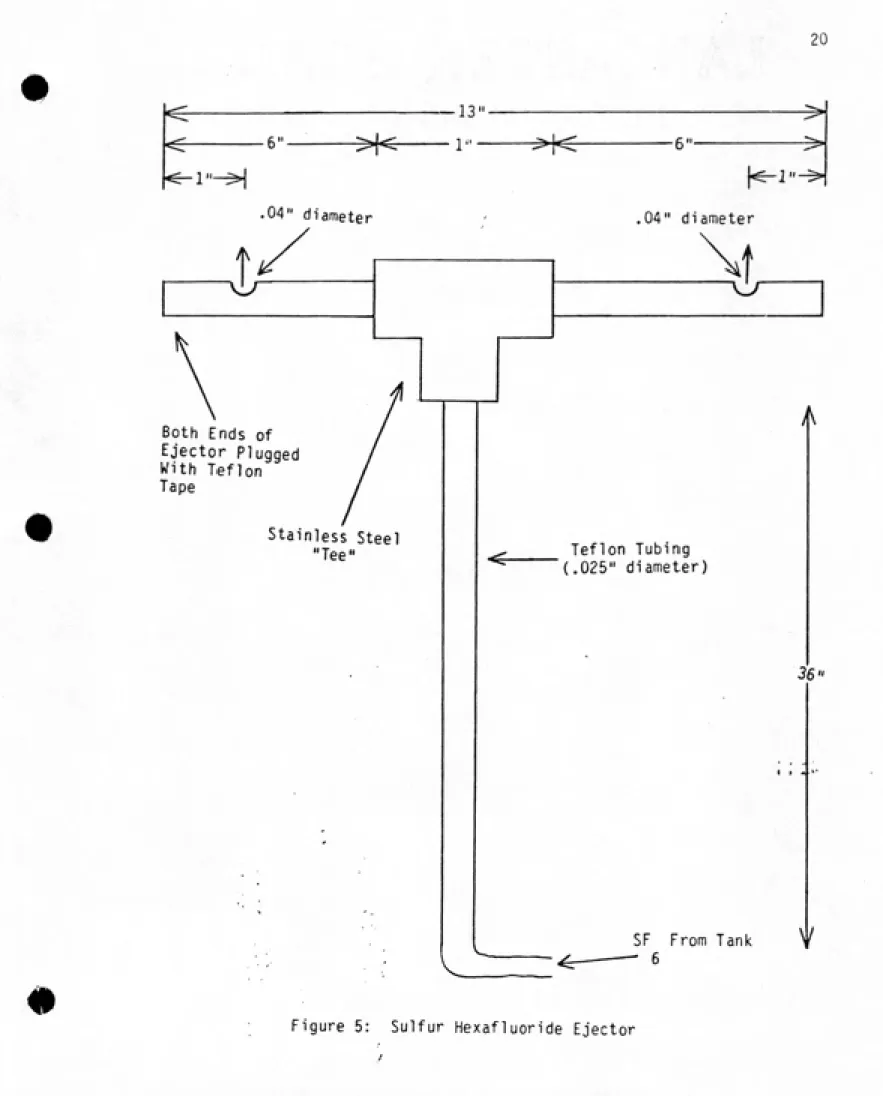
5 Sulfur Hexafluoride Ejector 20
6 Top View of Necropsy Hood Floor Showing Placement of 21
Obstructions
7 Location At Which Air Was Sampled For Formaldehyde 23
8 Hood Face Velocity Versus SF Concentration (No Obstructions 29
Present)
9 Hood Face Velocity Versus SF Concentration (With 30
6Mannequin in Place)
10 Hood Face Velocity Versus SF Concentration (With Hood 31
5Obstructions in Place)
11 Hood Face Velocity Versus SF Concentration (With 32
6Mannequin and Hood Obstructions in Place)
CI Calibration Curve: Sulfur Hexafluoride Concentration Versus 55
Absorbance Units
C2 Calibration Curve: Sulfur Hexafluoride Concentration Versus 57
Absorbance UnitsC3 Calibration Curve: Sulfur Hexafluoride Concentration Versus 59
Absorbance UnitsDl Planimeter Reading 61
El Strip Chart Record of Air Sample 63
iv
LIST OF TABLES
PAGE
1 Summary Data For Test Series #1 27 2 Summary Data For Test Series #2 28
Ci Miran Calibration 54
DAVID BECK LILLEY. Using a Tracer Gas Technique To Evaluate Laboratory
Hood Effectiveness. (Under the direction of DR. DAVID A. FRASER)
ABSTRACT
Animal researchers and pathologists who perform necropsies on
animals may be exposed to significant concentrations of formaldehyde
vapor. Because of complaints of respiratory and eye irritation, nausea,
headaches, and recent animal data that suggests formaldehyde may be a
carcinogen, several types of hoods have been used to control the pro¬
cess. A partial enclosure hood designed to control this process was
evaluated using a tracer gas, sulfur hexafluoride, to determine the
minimal operating conditions necessary to control vapors emitted within
the hood under working conditions. Recommendations are made for
INTRODUCTION
The toxic properties of formaldehyde include eye irritation at
approximately 1.0 parts per million; (ppm) (Bender, 1983; Weber-Tschoop,
1977; Konopinski, 1983) however, it has been reported that the human eye
can be irritated by as little as 0.01 ppm formaldehyde (Schuck, 1966).
Other reported effects of formaldehyde exposure include irritation of
the throat and upper respiratory tract, (Konopinski, 1983; Kerfoot,
1975) headache, (Kane, 1977; Amdur, 1960; Konopinski, 1983; Kerfoot,
1975; NAS, 1980) nausea, (Konopinski, 1983; NAS, 1980; Breysse, 1977)
tiredness, (Konopinski, 1983; NAS, 1980) and formalin asthma (Sakula,
1975; Hendrick, 1975). Other symptoms have been reported, but Bernstein
(1984) states that 30-50% of the population experiences symptoms at
0.5-1.5 ppm which are nonspecific, transient, exposure dependent, and
generally mild.
Prior to October 8, 1979, the hazards associated with formaldehyde
and the limits set for formaldehyde exposure were based on its irritant
properties. However, on the above date, the Chemical Industry Institute
of Toxicology (NIOSH, 1981) released preliminary data from an ongoing
study in which rats were being used to determine the carcinogenic poten¬
tial of formaldehyde gas. It suggested that exposure to 15 ppm for¬
maldehyde for 6 hours per day, 5 days per week for 16 months might be
carcinogenic to rats (NIOSH, 1981). A more recent report by Vaughan,
(1986) also suggests a link between formaldehyde exposure and cancer,
and Fraumen, 1983; Levine et al, 1984; Feyerweather et al, 1982; Marsh,
1982; Blair et al, 1986) did not find a significant increase in nasal
cancers. These studies and others along with the exposure limits for
formaldehyde are reviewed in Appendix A.
In order to establish a data base to determine the effects of
physical, biological, and chemical agents on population groups, exten¬
sive animal research is conducted. The animals used in experimentation
are exposed to the environmental factors in question, sacrificed, pre¬
served, then dissected. Since post-mortem tissue changes occur rapidly,
the use of a chemical fixative is necessary. The most common fixative
used today is formalin, which consists of 37% formaldehyde gas dissolved
in an aqueous solution together with 10-15% methanol to inhibit poly¬
merization. To preserve the animal parts, they are soaked in jars of
the formalin solution. Removal of these parts from the formalin may
create a potential formaldehyde exposure problem for the examiner.
In order to control exposure to formaldehyde, general room ven¬
tilation and laboratory hoods are often used. Care must be used in eva¬
luating such ventilation systems to make sure such rooms are kept under
a negative pressure so that any leakage of air will draw air into the
room, not force potentially contaminanted air out of the room (Clark,
1983).
The goal of this study was to use a tracer gas technique to deter¬
mine the effectiveness of a hood designed for the necropsy of small
laboratory animals. A room with such hoods was available at the
National Institute of Environmental Health Sciences. This room is nor¬
week. Fourteen or fifteen people use the room. Air samples taken in this room after the installation of these hoods showed formaldehyde con¬ centrations between 0.115 ppm and 0.21 ppm. For more information about
the room and the hoods, see page 12.
To evaluate the effectiveness of the hoods, a tracer gas was used
under four different conditions, and formaldehyde samples were taken
during actual operation of the hoods. Since it became apparent that the work practices of the researcher could affect the performance of the
II. BACKGROUND
PERFORMANCE CRITERIA
Local exhaust ventilation is a means of contaminant control in
which the contaminant is captured at the point of generation. This
has many advantages over dilution ventilation. Among these are:
1. Control of the contaminant can be complete.
2. Less air is required than with dilution ventilation, thus
lowering costs of air cleaning,
3. Since these systems require a fan of higher pressure charac¬
teristics, they are less affected by turbulent room air caused
by personnel traffic, opening and closing of doors and windows,
etc. than dilution ventilation.
A local exhaust ventilation system consists of a hood, ductwork, an
air cleaning device, and an air moving device. The hood is the part of
the system that encloses (or partially encloses) the source of the con¬
tamination.
The purpose of a hood for contaminant control is to create an
airflow past the contaminant source with enough mass and velocity to
entrain the contaminant and direct it into the hood. After the con¬
taminant is captured, the flow of air must be sufficient to keep the con¬
taminant from escaping the hood and entering the workers' breathing
zone due to agitation, thermal currents from heating devices, or tur¬
air flow necessary for effective entrainment of the contaminant.
Caplan, 1977, recommended a face velocity of 150 feet per minute (fpm)
for laboratory hoods when using materials of a "highly toxic" nature,
(Threshold Limit Value less than 10 ppm) and goes on to state that 70
fpm is adequate if the room design is "good". Barrett, 1962, states
that a 100 fpm face velocity is adequate if the material is moderately
hazardous, and 125 to 200 fpm is recommended if the contaminant is
highly toxic or radioactive. In any case, the face velocity should
never be below 100 fpm because the air will "follow" the employee as
he/she moves about or leaves the hood. Barrett did not define modera¬
tely hazardous or highly toxic. In 1979, Fuller showed that a hood face
velocity of 0.3 meters per second (60 fpm) through a well designed hood
provides adequate worker protection. Higher face velocities do not pro¬
vide better protection and use more energy. •
Since energy costs have been increasing, many factories have
resorted to sealing small cracks around windows, doors, and piping in
order to conserve energy. This results in a reduction of outside air
entering the building and a consequent increasing in negative pressure
which reduces the efficiency of the fan and lowers the amount of air
exhausted. As factories change, hoods must be re-evaluated to be sure
the contaminants are properly controlled. When evaluating the effec¬
tiveness of an exhaust system, other factors that must be considered
(other than the face velocity of the hood) include the room air
location of workers in relation to the hood face (Peck, 1982). To sum¬
marize, the effectiveness of the laboratory fume hood face velocity is
more important than the actual face velocity (Caplan, 1977).
In an effort to reduce energy costs, many hood designs include
supply air which flows down the front of the hood sash. This make up air
is usually heated or cooled for worker comfort. The velocity of the
make up air at the hood face also has a great effect on the control
level of the hood. As the velocity of the make up air at the face of
the hood increases, turbulence is created within the hood. As a general
rule, face velocity of the hood should exceed the velocity of the make up
air to assure proper control of the contaminant (Caplan, 1982). In
experiments done by Caplan in 1982, a tracer gas, sulfur hexafluoride,
was introduced into the hood at a known flow rate and the concentration
of the gas was measured outside the hood to determine the effect of the
make up air on the effectiveness of the hood. Tracer gas flow rates of
1, 4, and 8 liters per minute (1pm) and face velocities of 50, 100, and
150 fpm were used. For a system in which the make up air was supplied
through the ceiling, the effect of make up air velocity was as important
as the hood face velocity. Also, except for the 50 fpm test, reasonable
control was achieved when the hood face velocity was greater than the
make up air velocity, and locating the make up air directly behind the
work station caused more contaminant to escape than when the make up air
diffusers were slightly to the side. It was also found that the effects
of make up air velocity at the face of the hood is at least as important
as the face velocity in the 50 to 100 fpm range, and unless there is a
the hood provides the best control. According to Caplan, the velocity
of the make up air should be no more than 66% of the face velocity.
The flow of air through the face of the hood should be uniform with
as little turbulence as possible. From the time the air enters the hood
until it leaves the hood, any feature which makes the air change direc¬
tion can cause turbulence. In 1954, Schulte completed a test in which a
fan was set up that blew parallel to the face of a hood, and smoke was
used to observe the effect on airflow patterns. It was found that when
the cross current air velocity was equal to or greater than the hood
face velocity, serious disturbances in the airflow patterns in the hood
resulted. Ketcham, in 1958, found that the part of the airflow pattern
that provides the least control is at the sides and bottom of the hood
opening. Therefore, the source of contamination should be kept as near
the center and as far back in the hood as possible.
A standardized performance test is needed which determines the
overall effectiveness of the hood including the effects of face velocity.
This test should be representative of the actual challenge to the hood,
be practical for field use, for shop use and for developers and/or manu¬
facturers of hoods. Also, the test should be non hazardous and
noncon-taminating, inexpensive and convenient enough to lead to adoption as an
•
TRACER GAS TECHNIQUE
The tracer gas technique for the evaluation of hoods effectiveness
involves injecting a tracer gas at a known rate into a hood and sampling
the air for that gas at some point outside the hood. By measuring the
concentration of tracer gas outside the hood and knowing the tracer gas
release rate, the efficiency of the hood can be determined. Tracer gas
studies are performed because they measure only hood efficiency; there¬
fore, the technique used by the hood user can be evaluated. For
example, if the results of a tracer gas study show that a hood is
operating properly but the room is being contaminated during a certain
process, other factors (such as work practices) may be examined.
There are two areas in which the tracer gas is most commonly
sampled. The first is the ductwork downstream from the hood. However,
there are several disadvantages with air samples taken in the duct.
First, the samples must be taken far enough away from the hood, elbows,
or entries so that the tracer gas is uniformly distributed across the
duct. However, taking air samples in these locations may not be
feasible in all situations. Although a certain amount of turbulence is
necessary to mix the tracer gas with air, any turbulence which causes
the distribution of the tracer gas in the duct to be nonuniform across
the width of the duct causes a decrease in the accuracy of this tech¬
nique (Hampl, 1986). On the other hand. Peck, 1982, showed that by
taking breathing zone samples instead of duct air samples, the effects
of make up air, turbulent room air, and hood design are all taken into
Discretion must be used in the selection of a tracer gas. Caplan,
1977, suggests that a suitable tracer gas should be non-flammable, low
in toxicity, of low odor, reasonably inert, detectable by direct reading
instruments at low concentrations, readily available, and inexpensive.
In addition, the tracer gas should be specific and different from other
emissions in the area, and should be discharged in a pattern similar to
the contaminant's.
The tracer gas release rate is an important variable in measuring
performance. Although the release rate seemed to be arbitrarily chosen
in several studies, (Peck, 1982; Hampl,1984; Hampl,1986) one study
(Caplan, 1982) did describe how the tracer gas release rate was chosen.
Caplan evaluated a hood that was used for mixing solvents, which
involved pouring the solvents from open beaker to another open beaker
several times. Caplan started with several beakers with a known weight
of solvent in each. After the mixing, the beakers of solvent were
reweighed to determine how much was lost during the mixing process. The
10
statement of Thesis
Specially designed partial-enclosure necropsy hoods were evaluated
using sulfur hexafluoride (SF ) as a tracer gas to determine the minimal
6
operating conditions necessary for the control of formaldehyde. The
presence or absence of a person in front of the hood, objects in the
hood, and hood face velocities were evaluated separately and together
to determine which of these factors had a significant influence on the
efficiency of the hood. Air samples were taken for formaldehyde while
the hood was in use to determine the performance of the hood under
11
Protocol
Sulfur hexafluoride (SF ) was injected into the hood at 2 different
6
flow rates, l.U liters per minute (1pm) and 8.5 1pm. The first flow
rate was determined by placing a beaker with the formalin solution under
the hood and determining the evaporation rate. This evaporation rate was used as the SF flow rate for the 1.0 1pm test series. For more
6
details on the determination of the generation rate, see Appendix B.
The SF concentration was measured outside the hood to determine
6
how effectively the hood controlled the contaminant. In the series of
tests using the 8.5 1pm generation rate, the goal was to determine which
factors (presence or absence of mannequin and hood obstructions, face velocity) affected the efficiency of the hood. To do this, a series of 4 tests were made and the significance of the factors determined with the aid of a program for statistical analysis. Formaldehyde samples were collected and analyzed using a modification of the National
Institute of Occupational Safety and Health Physical and Chemical Analytical Method 125, which involved the use of pararosanaline
12
III. METHODS AND MATERIALS
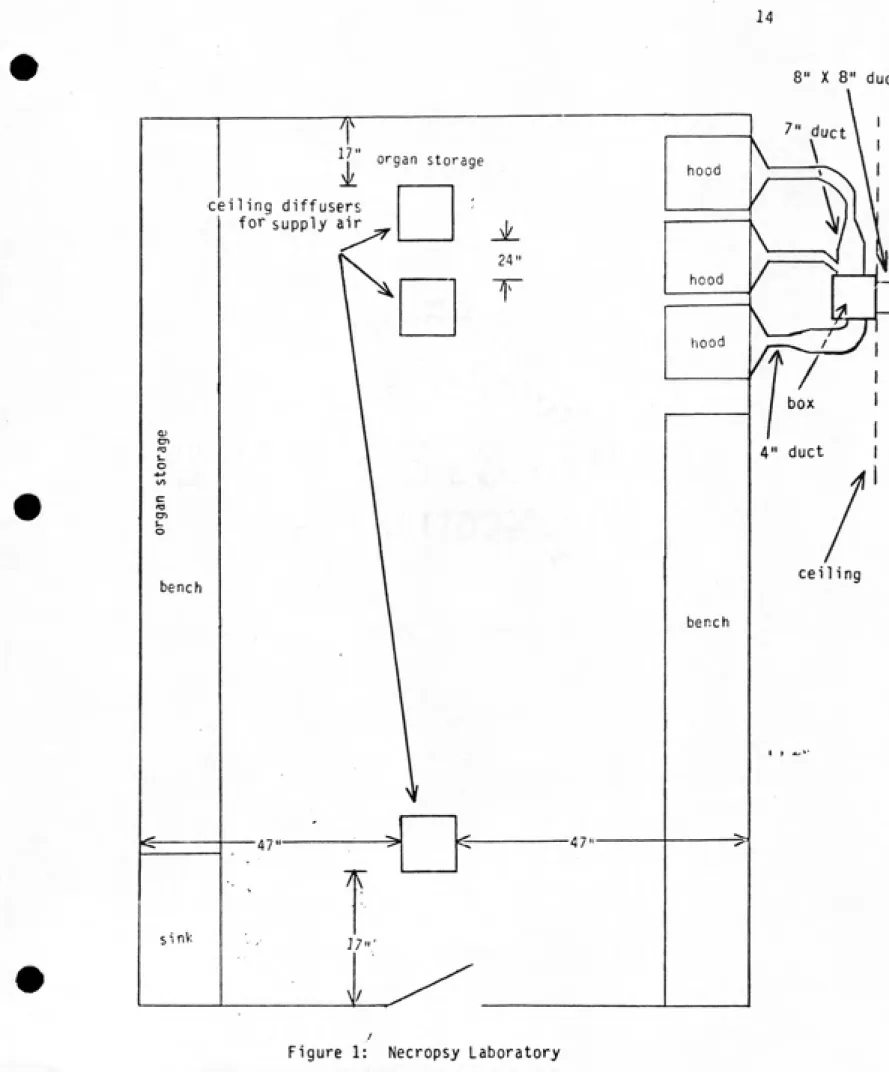
Three necropsy hoods being evaluated were located in a room 9 feet
wide, 20 feet long, and 9 feet high (see Figure 1) on benches which
lined both sides of the room. Above the left bench, there was a cabinet
used to store jars of tissues in a formalin solution. Other jars were
temporarily stored on a cart located at the opposite end of the room
from the door. Make up air delivered through the three 22 inch X 22
inch celling diffusers. A total of approximately 300 cfm of air was
exhausted through the three necropsy hoods. Tests performed in which
puffs of smoke from a smoke tube were emitted around the parameter of
the door showed the room was maintained under a negative pressure.
There were no windows in the room, and one door located at the opposite
end of the room from the necropsy hoods.
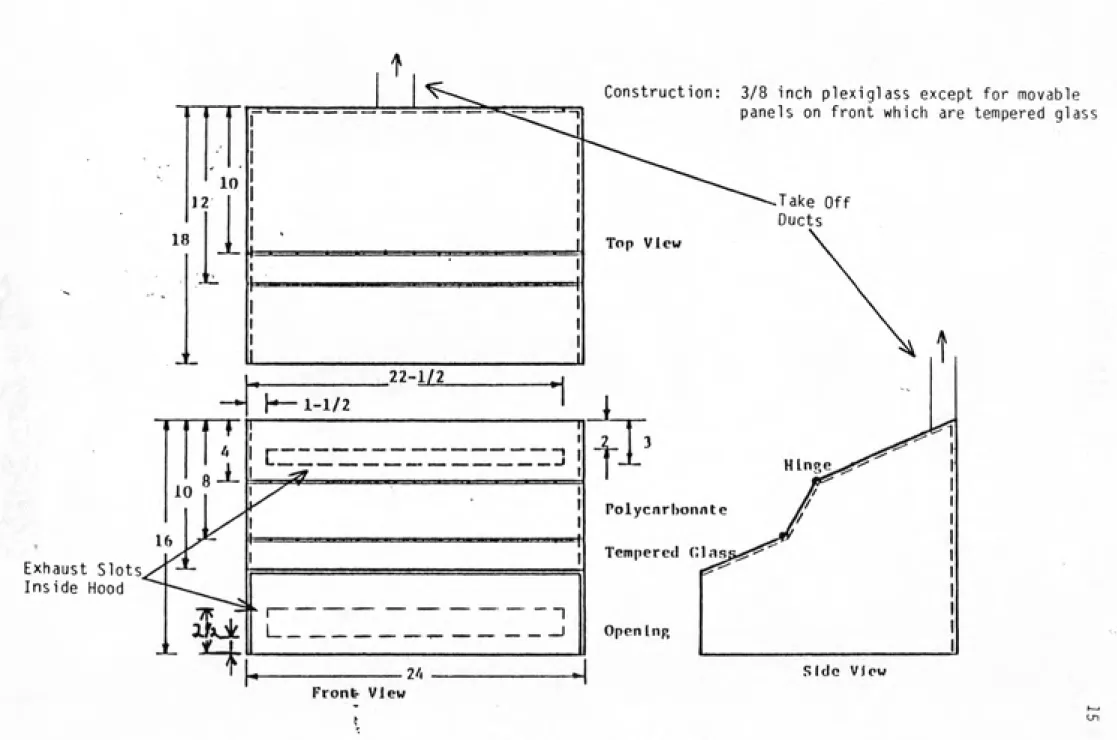
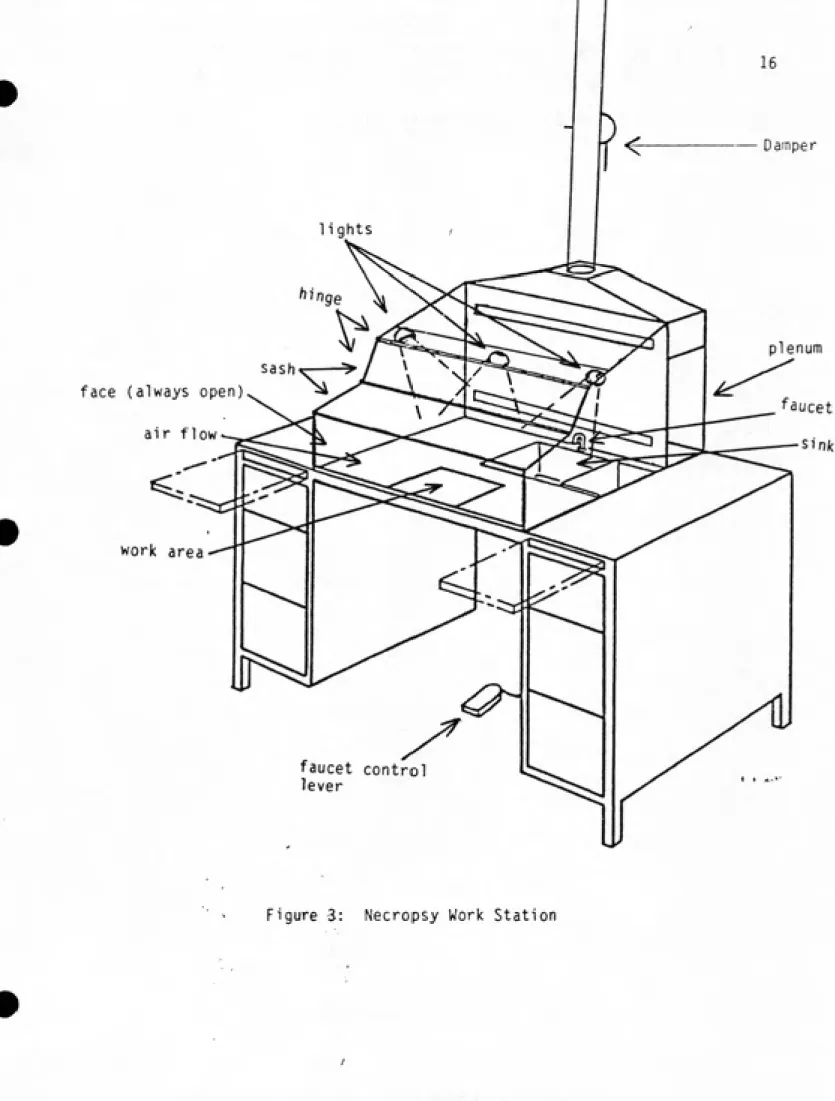
A diagram of the hood being evaluated is given in Figure 2. Within
the hood, there is a faucet and a sink for washing the organs before
trimming. The inside of the hood is illuminated by a light located in a
clear tube that runs the width of the hood so that the light bulbs are
not actually inside the hood (see Figure 3).
The two hoods farthest from the door are both connected to 4 inch
diameter ducts, which in turn are connected to a 7 inch duct. This duct
is connected to a plenum in the ceiling. If the hood dampers are closed
so that less than 300 cfm is exhausted by the three hoods, the automatic
damper located further up in the ventilation system adjusts so that a
13
take the path of least resistance through the plenum. The hood closest
to the door is connected to a 4 inch duct which is connected to a 7 inch
duct, which is also attached to the control box. An 8 inch X 8 inch
14
8" X 8" duet
7" duct organ storage
ceiling diffusers
for supply air
cei ling bench
bench
Exhaust Slots
Inside Hood
Construction:
3/8 inch plexiglass except for movable
panels on front which are tempered glass
Take Off
Ducts
Top View
22-1/2
1—1-1/2
Polycnrljonnte
Tempered ("<]
Opening
Stdc View
Front View
lights
face (always open)
air flow
faucet control lever
Damper
^
plenumfaucet
work area
y^
17
SULFUR HEXAFLUORIDE SAMPLING STRATEGY
The face velocity of the hood was measured using a hot wire anemo¬
meter. The average face velocity of the hood was adjusted from 13 feet
per minute (fpm) to 279 fpm by means of dampers, (see figure 3) and
measured using a 12 point traverse of the face (see figure 4). When the
desired face velocity was obtained, the damper position was noted and a
final face velocity measurment was taken at the center of the face. To
obtain that hood face velocity, the damper was set to the appropraite
position and the center!ine face velocity taken for verification.
Figure 4 also shows a point (indicated by the star) where the face velo¬
city was consistently lower than the other measurments. Sulfur
hexafluoride (SF ) was introduced into the hood by an ejector (see
6
figure 5) and the flow rate measured using a rotameter. The rotameter
was set for a flow of 1.0 liters per minute (1pm) for the first series
of tests, and 8.5 1pm for the second series of tests (see Appendix B,
"Generation Rate Determination").
For the first series of tests, a mannequin was placed in a work
position in front of the hood. The mannequin's hands and forearms were
extended into the hood, and its hands were used to hold the ejector
approximately 1 inch above the hood floor, 6 inches back from the face,
and centered lengthwise in the hood. For the first test in this series,
the probe of the instrument used to measure (SF ) concentration was
6placed in the mannequin's breathing zone. A description of this
instrument and its calibration can be found in Appendix C, and the
18
Appendix E. Since no (SF ) was detected in the breathing zone at the
6two lowest face velocities, the mannequin was removed from the hood and
the probe was placed at the hood face at the point of lowest face
velocity. After measurments were taken at one face velocity, the face
velocity was increased and measurments taken again until no SF was
6
detected. The mannequin was then placed in a work position with its
hands and forearms in the hood. The probe was again placed at the hood
face at the point of lowest face velocity. Three 150 ml beakers, a
cutting board, and a few surgical instruments were placed in the hood to
simulate obstructions during actual operations (see Figure 6). Finally,
the mannequin was placed in a work position in front of the hood, but no
obstructions were placed inside the hood. Air samples were taken under
these conditions at velocities that ranged from 13 fpm to 279 fpm in 25
fpm increments.
In the second series of tests, the objective was to determine if
the presence of the mannequin or obstructions within the hood had a
bearing on hood performance. The face velocity was varied between 13
fpm and 279 fpm while holding the generation rate constant at 8.5 1pm.
As in the first series of tests, the sampling probe was placed in front
of the hood face at the point of lowest face velocity. Four separate
runs were made: #1 had no obstructions within the hood and no man¬
nequin, #2 had no obstructions within the hood but did have a mannequin,
#3 had obstructions within the hood but no mannequin, and #4 had both
obstructions within the hood and the mannequin. To analyze data to
determine the effects of hood face velocity, obstructions within the
hood, and the mannequin on hood performance, a stepwise regression pro¬
12 Point Traverse
Readings Center Velocity
Reading Taken
Here
1"'
ͣ
i
O II iW..
ͣ
.
ͣͣ
±
J
I"1
/
\
. • • •/ •
• • 1 2 3 /" 5 6 V) 13 • • • : • # • 7 8 9 10 11 12 2"\^
K-•4" >|<---4"---^
k-
-4"-
24"--12"- ^
-$>}<---4"--->)< 4" >|( >
--->
.2"
UD
^
6"----^f^
1-H
ͣ
04" diameter
\L/-Both Ends of
Ejector Plugged
With Teflon Tape
Stainless Steel
"Tee"
.13"---
1----H<-20
^
-6"- ->^
\^1"-.04" diameter
—kLt
Teflon Tubing (.025" diameter)
36'•
SF From Tank ^
6
\
Faucet
Cutting
UtensfI
Board
6" \/
Front
\/ V </ M^
Figure 6: Top View of Necropsy Hood Floor Showing
Placement of Obstructions
22
FORMALDEHYDE SAMPLING STRAGETY
A limited number or formaldehyde samples were taken to evaluate
exposures during actual operations. Formaldehyde samples were taken
because the tracer gas technique only measures hood efficiency. If
there are other contaminant sources in the room, the tracer gas tech¬
nique will not detect them. Since the tracer gas used was sulfur
hexafluoride and the contaminant that was controlled for was for¬
maldehyde, the formaldehyde would not be detected during the course of
the tracer gas study.
The locations used for formaldehyde sampling are shown on Figure 7.
During the sampling, a researcher was involved in a process called "tissue trimming". The formalin and animal tissue were poured through a strainer into another jar. The tissues were caught in the strainer and rinsed with tap water. The tissues were then dumped onto a cutting board, small sections of the organs trimmed off and placed in disk shaped pieces of plastic called crickets. The remaining tissues were
then returned to the original bottle along with the original formalin
solution. The crickets containing the tissue samples were placed in an
uncovered 2 liter beaker with about 0.75 liters of the formalin solu¬
tion. This was done in the back of the hood, with the front sash
23
•
organ storage
between hoods hood
\ sample #2
across room
sample #1--->x
, ,»-sample #4 —t
hood
aoove nood
/
hoodo
/
researchers
chair
c re
en
s.
o
bench
sample #3
bench
•
middle of room
1 » *^'
sink
V - ^
^
24
IV. RESULTS AND DISCUSSION
TRACER GAS STUDY RESULTS
The results of the first series of tracer gas tests are summarized
in Table 1. Since no SF concentrations were above the lower detectable
6
limit (LDL = 0.1 ppm) unless the hood's damper was completely closed,
the necropsy hoods are judged to be effective in controlling the con¬
taminant released in the hood at a rate of 1.0 1pm.
To determine if the presence of a mannequin or obstructions within
the hood significantly affect the efficiency of the hood, the second
series of tracer gas experiments was performed. This series of tests was
performed under identical conditions as the first series, except the SF
6
flow rate was increased. The results of these tests are shown in Table
2 and Figures 8 to 11.
The data from these graphs was entered into a stepwise regression
procedure of a statistical analysis program (SAS) which adds the indepen¬
dent variables to the model one at a time.
Model With All Parameters and Interactive Terms
In y ='Pp+^1 (velocity) + Pi(mannequin) +P3(hood obstructions) +
pu(velocity * mannequin) +^^ (velocity * hood obstructions) +
^^(mannequin * hood obstructions) +p-7 (velocity *
mannequin * hood obstructions)
where:
y = SF concentration at the face of the hood
25
After the variable is added, the program checks the variables
already in the model and removes any that do not produce a significant
F statistic. The F statistic tests how well the model as a whole
accounts for the dependent variable's behavior. The F statistic
necessary for a variable to stay in the model must be significant at
the P <.15 level. Then, another variable is added to the model and
accepted or rejected. This procedure continues until none of the
variables outside the model has a partial F statistic significant at
P <.15. Since it was not possible to take measurments for the presence or
absence of hood obstructions or the mannequin, variables (0,1) were used
to denote the absence or presence, of these variables.
The only variable that had a significant effect on the SF
con-6
centration was the face velocity of the hood (P <.0001). Although the
presence of the mannequin had some effect on the SF concentration, it's
6
significance is borderline (P <.079). The rest of the independent
variables were determined not to be significant at the P <.15 level. The
stepwise regression procedure reduced the model of the tracer gas study
to:
1n y = ^'o'*' P|(velocity) + ^^^(mannequin)
where:
$p , P^ , and ^^are regression coefficients calculated by the computer
program, and
^0= 3.626
P, = -0.U18
26
As a general rule, environmental concentration data are log-normally
distributed. The "In" conversion normalizes the distribution which is a
requirement for the assumptions made in the regression analysis. Using the simplified model, the SF concentration for a given hood face
velo-6
city may be predicted. For example, if it is known that the hood face
velocity is 148 fpm and there are no obstructions in front of the hood:
In y = 3.626 + (-0.018)(148) + 0
In y = 1.026
y = 2.79 ppm
This prediction equation should be used with caution, because the
presence of the mannequin and hood obstructions appear to cause an
increase scatter of the data. This added scatter may not be predicted
27
TABLE i
SUMMARY DATA FOR TEST SERIES #1
tracer gas release rate =1,0 1pm
Face Velocity (fpm) Center Velocity (fpm) 44 Mannequin no Obstructions in Hood no Su He Co Ifur xafluoride ncentration (ppm) 28 .19
54 77 no no <LDL
13 0 yes yes .59
28 44 yes yes <LDL
118 146 yes yes <LDL
228 266 yes yes <L0L
13 0 yes no .62
28 44 yes no <LDL
54 77 yes no <LDL
75 104 yes no <LDL
97 122 yes no <LDL
118 146 yes no <LDL
148 167 yes no <LDL
168 195 yes no <LDL
187 240 yes no <LDL
201 242 yes no <LDL
228 266 yes no <LDL
28
TABLE #2
SUMMARY DATA FOR TEST SERIES #2
tracer gas release rate = 8.5 1pm
Hood Face SF6
Velocity Concentration
(fpm) (ppm) Mannequin
yes
Hood Obstructions
28 17.25 yes
54 2.55 yes yes
75 1.20 yes yes
118 17.75 yes yes
148 2.80 yes yes
168 .91 yes yes
187 .93 yes yes
28 28.75 no yes
54 5.20 no yes
75 15.0 no yes
97 29.0 no yes
118 1.60 no yes
148 2.60 no yes
168 2.30 no yes
187 2.65 no yes
279 .335 no yes
28 73.0 yes no
54 25.0 yes no
75 .66 yes no
97 .68 yes no
118 1.40 yes no
28 25.50 no no
54 19.50 no no
75 6.85 no no
97 8.25 no no
118 10.40 no no
148 2.55 no no
168 1.01 no no
187 .27 no no
29 100- 70- 50-^ 30 c o 1 w «> a. in t^ 10 a a. *-^ 2 O 1-< CC h-2 liJ O 2 O o » u. w 1.0- .8- .6-.4-^
.2-generation rate = 8.5 1pm
50 100 150 200 250 300
FACE VELOCITY (feet per min.)
Figure 8; Hood Face Velocity Versus SF6 Concentrati
(No Obstructions Present)
30
100
70
50
30 J
c
O
(0 10 -I
K
z
o
cc I-z UJ o z
o
o
^ 1.0
.8
generation rate = 8,5 1pm
s >
.c«-
"1---150 50
T T
100 150 200 250
FACE VELOCITY (feet permin.)
300
Figure' 9: Hood Face Velocity Versus SF6 Concentration
31
100-. 70
50
30 -I
n
o
= 10
E
m
a
a.
I-<
q:
\-I 10
i 8
*^ .6
CO ,
.2-generation rate = 8.5 1pm
50
•i >
T T
100 150 200 250 300
FACE VELOCITY (feet per min.)
Figure 10: Hood Face Velocity Versus SF6 Concentration
32
100-
70-
50-30 H
.2 10
4> Q.
in
4-O
Cl
z o
I-< I-2
UJ o
2 O
o CO
1.0
.8
.4-^
.2--i-L
generation rate = 8.5 1pm
• •
50 ,; K)0 150 200 250 300
FACE VELOCITY (feet per min.)
Figure 11: Hpod Face Velocity Versus SF6 Concentration
33
FORMALDEHYDE SAMPLING RESULTS
The results of the air sampling for formaldehyde are given below.
The air samples were taken in the locations marked on Figure 7, using a modification of the National Institute of Occupational Safety and
Health's Physical and Analytical Method 125, which involved the use of pararosaniline chloride. As can be seen from the data below, even the
highest formaldehyde concentration of 0.065 ppm is far below both the
American conference of Governmental Industrial Hygienists recommended Threshold Limit Value of 1.0 ppm, and the Occupational Safety and Health Administration's Permissible Exposure Limit of 3.0 ppm (see Appendix A)
sample location concentration (ppm)
between hoods (#1) <.05 across room (#2) <.05 middle of room (#3) .065 above hood (#4) <.05
The air samples were taken while the researcher was performing the
tissue trimming process (see page 22). The hood face velocity was 100
fpm. The highest formaldehyde was found in the middle of the room next to a garbage can the researcher threw paper towels into that she used to
clean formalin spills with, but all the sample results are so low they
34
CONCLUSIONS AND RECOMMENDATIONS
At a face velocity of 100 fpm and under actual working conditions,
the highest formaldehyde concentration found in the necropsy room was 0.065 ppm, which is well below the TLV of 1.0 ppm. Also, a hood face
velocity of 100 fpm should minimize the effects that cross drafts and
drafts created by personnel movement which can have on the efficiency of the hood. Therefore, under normal working conditions, a hood face velo¬
city of 100 fpm is recommended.
For processes in which higher generation rates are involved (in
this case, 8.5 liters per minute) the prediction equation:
In y = 3.626 + (-0.018)(velocity) + (-0.700)(mannequin)
may be used. By substituting in the values from Table 2 for the nine
different velocities used, and 0 or 1 for the absence or presence of the
mannequin, respectively, it is found that contaminant concentration out¬
side the hood is measurable, (in theory) even at the highest face velo¬
city. The equation predicts a concentration of 0.14 ppm of contaminant
outside the hood at a face velocity of 279 fpm. This control level may
be adequate for gases or vapors with higher Threshold Limit Values (>1
ppm) but may not be adequate for highly toxic gases or vapors, or gases or vapors that have a TLV < 1 ppm. Therefore, caution should be used if
these hoods are used for processes involving generation rates greater
than 1.0 ]pm or highly toxic materials.
for-35
maldehyde levels far below the TLV of 1.0 ppm, one researcher still
complained of nausea, headache, dizziness, and a sore throat. There are
two possible explanations for this. One is this particular researcher
is hypersensitive to formaldehyde. However, it was noted that during
the course of tissue trimming, there is often a small amount of formalin
solution on the outside of the jar when it is removed from the hood. If
this was wiped off, the towel may be left in the hood or thrown in the
trash can outside the hood. Also, the lids are not always properly
placed on the jars, permitting formaldehyde vapor to escape. Therefore,
it is probably a series of housekeeping errors that results in the
complaints rather than inadequately performing hoods. It is recommended
that the outsides of all jars should be washed with tap water and dried
36
BIBLIOGRAPHY
1. ACGIH, "Threshold Limit Values for Chemical Substances and
Physical Agents in the Work Environment for 1985-86", American
Conference of Governmental Industrial Hygienists, Cincinnati, Ohio, (1985).
2. Amdur, M., "The Response of Guinea Pigs to Inhalation of
Formaldehyde and Formic Acid Alone and With a Sodium Chloride
Aerosol", International Journal of Air Pollution, Vol.3,
p. 201, (1960).
3. Amdur, M. 0. , "Air Pollutants", Toxicology: The Basic Science of
Poisons, Macmillan Publishing Co., Inc., 2nd edition, (1980).
4. Barrett, James, "Ventilating Research Labs", Air Engineering,
January, pp. 31-36, (1962).
5. Bender, J., Mullin, L., Graepel, G., Wilson, W., "Eye Irritation
Responses of Humans to Formaldehyde", American Industrial
Hygiene Association Journal, Vol. 44, No. 6, pp. 463-465,
June, (1983).
6. Bernstein, R. S., Stayner, L. T., Elliott, L. J., Kimbrough, R.,
Falk, H., Blade, L., "Inhalation Exposure to Formaldehyde: An Overview of It's Toxicology, Epidemiology, Monitoring, and Control", American Industrial Hygiene Association Journal,
Vol. 45, pp. 778-785, (1984).
7. Blair, A., Stewart, P., O'Berg, M., JGaffey, W., Walrath, J., Ward, F., Bales,R., Kaplan, S., Cubit, D., "Mortality Amoung
Industrial Workers Exposed to Formaldehyde", Journal of the National Cancer Institute. Vol. 76, No. 6, pp. 1071-1084,
(1986).
8. Blake, C. L., Coffman, M. A., and Heywood, D. J.: Indoor Air (Quality Problems in Public Buildings, paper presented at 1981
AIHA Conference, Portland, OR.
9. Breysse, P., "Formaldehyde in Mobile and Conventional Homes", Environmental Health and Safety News, University of Washington, Vol. 26, Nos. 1-6, January-June, (1977).
10. Caplan, Knowlton, Knutson, G., "Laboratory Fume Hoods: A
Performance Test", ASHRAE Transactions, 78 (3), pp. 511-521,
(1977). "~
11. Caplan, Knowlton, Knutson, G., "A Performance Test for Laboratory
37
12. Chronister, B., "An Evaluation of Methoxyfurane Delivery Techniques
And Exposures By Laboratory Personnel At A Biomedical Research Institute", thesis presented to the Environmental Science and Engineering Department at the University of North Carolina, Chapel Hill, N.C., in 1983, in partial fulfillment of the requirments for the degree of Masters of Science in Public
Health.
13. Clark, R.P., "Formaldehyde in Pathology Departments", Journal of
Clinical Pathology, Vol. 36, pp. 839-846, (1983).
14. Federal Register, United States Government Printing Office,
Vol. 50, p. 50412, Dec. 10, (1985).
15. Fuller, F. H., "The Rating of Laboratory Hood Performance", ASHRAE
Journal, 21(10), pp. 49-53, (1979).
16. Hampl, V., "Evaluation of Industrial Local Exhaust Hood Efficiency
by a Tracer Gas Technique", American Industrial Hygiene Association Journal. 45(7), pp. 485-490, (1984).
17. Hampl, V., Niemela, R., Shulman, S., Bartley, D., "Use of Tracer Gas Technique for Industrial Exhaust Hood Efficiency Evaluation-Where to Sample?", American Industrial Hygiene Association,
47(5), pp. 281-287, (1986). ~
18. Hayes, R., Raatgever, J., Bruyn, A., Gerin, M., "Cancer of the Nasal Cavity and Paranasal Sinuses, and Formaldehyde Exposure", International Journal of Cancer, Vol. 37, pp.
487-492, (1982).
19. Hendrick, D. J., "Formalin Asthma in Hospital Staff", British
Medical Journal, pp. 607-608, March 15, (1975).
20. Kane, L. E., and Yves, A., "Sensory Irritation to Formaldehyde and Acrolein During Single and Repeated Exposures in Mice", American Industrial Hygiene Journal, Vol. 38, pp. 509-522, October, (1977).
21. Kerfoot, E., and Mooney, T., "Formaldehyde and Paraformaldehyde Study in Funeral Homes", American Industrial Hygiene
Association Journal, Vol. 36, No. 7, pp. 533-537, July, (1975).
22. Ketcham, N. H., "Testing Laboratory Hoods-Evaluation of Design
Changes and Periodic Performance Testing", Industrial Hygiene
Journal, pp. 324-329, August, (1958).
24. Konopinski, V., "Formaldehyde in Office and Commercial
Environments", American Industrial Hygiene Association Journal,
Vol. 44, No. 3, pp. 205-208, March, (1983).
38
25. Levine, R. J., DalCorso, D., Blunden, P., and Battigelli, M.,
"The Effects of Occupational Exposure on the Respiratory Health
of West Virginia Morticians", Journal of Occupational Medicine,
Vol. 26, No. 2, pp. 91-98, Feb., (1984).
26. Loomis, T., "Formaldehyde Toxicity", Archives of Pathology and
Laboratory Medicine, Vol. 103, pp. 321-324, July, (1979).
27. National Academy of Science, Committee of Toxicology, "Formaldehyde;
An Assessment of Its Health Effects", Report Number
N00014-79-C-0049, National Academy of Science, Washington D.C.,
March, (1980).
28. National Research Council, Committee of Air Pollutants: Indoor
Pollutants. National Academy of Sciences Press, Washington
D.C., (1981).
29. Natonal Research Council, Committee on Aldehydes: Formaldehydes
and Other Aldehydes. National Academy of Sciences Press,
Washington DC, (1981).
30. NIOSH, "Criteria for Recommended Standard: Occupational Exposure
to Formaldehyde", Publication Number 77-126, National
Institute for Occupational Safety and Health, Cincinnati,
Ohio, December, (1976).
31. NIOSH, "Formaldehyde: Evidence of Carcinogenicity", Current
Intelligence Bulletin 34, Cincinnati, Ohio, April (1981).
32. Olsen, J., Jensen, S., Hink, M., Faurbo, K., Breum, N., Jensen, 0.,
"Occupational Formaldehyde Exposure and Increased Nasal Cancer
in Man", International Journal of Cancer, Vol. 34, pp.
639-644, (1984).
33. Peck, R., "Validation of a Method to Determine a Protection Factor
for Laboratory Hoods", American Industrial Hygiene Journal,
43 (8), pp. 596-601, (1982).
34. Porter, J.A.H., "Acute Respiratory Distress Following Formalin
Inhalation", Lancet, pp. 603-604, September, (1975).
35. Sakula, A.," Formalin Asthma in Hospital Laboratory Staff", Lancet,
p. 816, October, (1975).
36. Schuck, E., Stevens, E., Middleton, J., "Eye Irriatation Responses
at Low Concentrations of Irriants", Archives of Environmental
Health, Vol. 13, November, (1966).
37. Schulte, H.F., Hyatt, E.C., Mitchell, R.N., "Evaluation of
39
38. Shoenberg, J., Mitchell, C, "Airway Disease Caused by Phenonlic
(Phenol-Formaldehyde) Resin Exposure", Vol. 30, pp. 574-577,
December, (1975).
39. Snedden,I.B.,"Dermatitis in an Intermittent Hemodialysis Unit",
British Medical Journal, Vol. 1, pp 183-184, (1968).
40. Stayner, L., Smith, A., Reeve, G., Blade, L., Elliott, L.,
Keenlyside, R., Halperin, W., "Proportionate Mortality Study of Workers in the Garment Industry Exposed to Formaldehyde", American Journal of Industrial Medicine, Vol. 7, pp.
229-240, (1985).
41. Swenberg, J., Kerns, W., Mitchell, R., Gralla, E., Pavkov, K.,
"Induction of Squamous Cell Carcinomas of the Rat Nasal Cavity by Inhalation Exposure to Formaldehyde Vapor", Cancer
Research, Vol. 40, pp. 3398-3340, September, (1980).
42. Vaughan, T., Strader, C, Davis, S., Darling, J., "Formaldehyde and
Cancers of the Pharynx, Sinus and Nasal Cavity: I.
Occupational Exposures", International Journal of Cancer, Vol.
38, pp. 677-683, (1986).
43. Vaughan, T., Strader, C, Davis, S., Darling, J., "Formaldehyde and
Cancers of the Pharynx, Sinus and Nasal Cavity: II.
Residedtial Exposures", International Journal of Cancer, Vol.
38, pp. 685-688, (1986).
44. Weber-Tschopp, Fischer, A.L., and Grandjean, E.G.,"Irritating
40
APPENDIX A: HEALTH EFFECTS OF FORMALDEHYDE
The health effects of formaldehyde can be categorized as occular,
respiratory, and systemic. In each of these categories, there may be a
small group of hypersensitive persons who react to formaldehyde well
below concentrations necessary to cause the same response in the
majority of the population (Loomis, 1979).
At concentrations below that which causes respiratory irritation,
eye irritation is the most common complaint (Schuck, 1966). The National
Academy of Science, 1980, reported that lacrimation and conjunctivitis
may result from low concentrations of formaldehyde, however, the term
"low concentration" was not defined. In an effort to provide
dose-response data on the eye irritation properties of formaldehyde, a number
of eye exposure experiments have been conducted.
In 1966, Schuck exposed 12 subjects to the formaldehyde by means of
welding masks attached to a chamber. These tests showed that the human
eye is able to detect as little as 0.01 ppm of formaldehyde although the
concentration-response relationship was irregular below 3.0 ppm, and
equivalent irritations were experienced at 0.05 ppm and 0.5 ppm. The
irritant atmosphere was generated by photoxidation of ethylene or propy¬
lene in nitrogen dioxide, resulting in the formation of other eye irri¬
tants, such as ozone and peroxyacetylnitrate (PAN).
In another study by Bender (1983), an aluminum smog chamber was
used to expose people to concentrations from 0.35 ppm to 1.0 ppm. The
test subjects responded to formaldehyde concentrations between 1.3 ppm
41
unresponsive were rejected. The results of this study suggest that the
human eye irritation threshold for formaldehyde is 1.0 ppm. When the
severity of the response was re-evaluated at the end of the 6 minute
test, the severity of irritation was lower, indicating a diminished
response.In another study, Weber-Tschopp (1977) used 33 human subjects and
exposed them to 48 short exposures of formaldehyde of 1.5 minutes
apiece. The irritating effect formaldehyde has on the eyes increased
as the concentration increased, and the eye irritation threshold
was found to be between 1.0 ppm and 2.0 ppm.
There have been cases in which eye irritation complaints have been
investigated and formaldehyde was the only chemical that could be iden¬
tified. In a record shop, complaints of eye irritation have been linked
to formaldehyde released by particle board subflooring and counter framing (Konopinski, 1983). Air samples showed a formaldehyde con¬ centration of 1.0 ppm in the shop, and none was detected outside the
shop. After the particle board subflooring and counter framing were
sealed, the formaldehyde concentration dropped dramatically, and the symptoms of the employees disappeared (Konopinski, 1983).
At the Indiana Vocational Rehabilitation Division in Lafayette,
Indiana, eye, nose and throat irritation, headache, and tiredness were
reported. Air samples (taken with impingers) showed formaldehyde con¬
centrations of 0.13 ppm to 0.17 ppm. Again, these symptoms disappeared
upon sealing of the particle board.
42
Amdur, 1980). Irritation to the nose and throat has been reported when
exposure concentration is from 1.0 ppm to 5.0 ppm; and exposures of 2.0
ppm to 5.0 ppm caused an increase in complaints of irritation of the
pharynx, upper respiratory tract, and some erythema of the exposed areas
of the skin. Due to the fact that intolerable irritation of the upper
respiratory tract is experienced at concentrations necessary to cause
acute airway damage in humans, such damage is rare (Loomis, 1979).
Levine, 1984 studied effects of formaldehyde on the health of 90
white male West Virginia morticians. Air samples taken around the mor¬
ticians during the embalming process showed formaldehyde concentrations
of 0.2 ppm to 0.4 ppm while embalming intact bodies, and 0.5 ppm to 1.2
ppm while embalming autopsied bodies. Eventhough exposures encountered
with autopsied bodies are greater, these are a minority of the total
number of bodies embalmed. A respiratory disease questionnaire recom¬
mended by the American Thoracic Society and the National Heart Lung
Institute Division of Lung Disease was completed by each mortician.
Chronic bronchitis in this test is defined as coughing up phlegm on most
days for 3 or more consecutive months of the year. Lung function tests
were also done. It was found that for non-smoking morticians, the
pulmonary function was equal to or greater than in the controls, and the
prevalence of pulmonary function abnormalities was similar. The
exsmo-kers were comparable to the controls, but the morticians had fewer
spirometeric abnormalities. Analysis of the total group of nonsmokers
showed no significant association between formaldehyde exposure and
decreased pulmonary function. The results of this study suggest that
long term intermittent exposure to low levels of formaldehyde exerts no
43
According to Amdur,(1980), formaldehyde is detectable by odor at 0.5
ppm to 1.0 ppm, and 2.0 ppm to 3.0 ppm will produce a mild irritation of the nose, upper respiratory tract, and eyes, while 4.0 ppm to 5.0 ppm
is intolerable to most people. Below 0.05 ppm, no alterations in any
respiratory criteria used were detectable. A one hour exposure to 0.3 ppm and higher produced pulmonary flow resistance accompanied by a reduced compliance, and respiratory frequency and minute volume were
lowered.
Schoenberg (1975) reported a high percentage of eye, nose, and
throat irritation, and a cough among the workers exposed to
phenol-formaldehyde resin. Lung function tests were significantly lower com¬
pared to employees not exposed.
Formaldehyde has also been linked to a type of respiratory distress
called "formalin asthma" (Sakula, 1975; Hendrick, 1975). In one case, a
41 year old nurse was exposed to vapor from a 34-38% formalin solution
for 5-20 minutes. She developed a persistent dry cough and episodic
attacks of wheezing within 4-5 hours after exposure. Her symptoms
cleared when she avoided all unnecessary exposure to formalin (Hendrick,
1975). In another case, a 27 year old neurology resident noted dyspnoea and chest tightness after 2 hours of preparing brain specimens. During the previous week, he had spent 15 hours in a high concentration of
formaldehyde. Isolated rhonchi and soft diffuse rales were heard over
both lung fields. Chest x-rays showed an increase in interstitial
markings with early edema. After a 5 week recovery period, the resi¬
44
Other symptoms experienced from exposure to low levels of for¬
maldehyde have been headaches, drowsiness, gastrointestional
disturbances, (NAS, 1980) lightheadedness, (Blake, 1981) nausea, and lapse of memory (Breysse, 1977). Reports of occupational dermititis
from exposure to gaseous formaldehyde have been rare and inconclusive (NIOSH, 1976). Bernstein (1984) reports that 30-50% of the population
experiences symptoms which are nonspecific, transient, exposure depen¬
dent, and generally mild at 0.5 ppm to 1.5 ppm formaldehyde.
Formaldehyde does cause allergic sensitization of the skin,
however, evidence for the sensitization of the respiratory tract remains
uncertain (NIOSH, 1976; NRC, 1981; NRC, 1981). There have been reports
describing nurses becoming sensitized to formaldehyde-treated equipment
when formaldehyde was used as a sterilizing agent (Snedden, 1968). Evidence that suggests inhalation of formaldehyde vapor may cause
cancer was first reported to NIOSH in 1979 by the Chemical Industry
Institute of Toxicology (NIOSH, 1981). Rats were divided into four
exposure groups consisting of 0, 2, 6, and 15 ppm formaldehyde. After
24 months, 93 rats in the 15 ppm group developed squamous cell car¬
cinomas of the nasal passages, and two rats developed respiratory
epithelial carcinomas. Also, two rats exposed to 6 ppm developed
squamous cell carcinomas of the nasal passages (NIOSH, 1981). Since the development of squamous cell carcinomas is rare in non exposed rats, (out of 1680 unexposed rats, none developed this disease) it was
concluded that the squamous cell carcinomas in this study were due to
45
In a study done by Vaughan (1986), 552 control subjects were ran¬
domly selected in 13 western Washington counties. Interviews completed
by telephone asked interviewees for a lifetime occupational history
and about possible confounding factors (smoking and drinking). In the
case-control study, 205 cases had oro-and hypopharyngeal cancer
(including unspecified pharyngeal sites) 27 had nasopharyngeal cancer,
and 53 had sinonasal cancer, for a total of 552 cases. The occupational
formaldehyde exposure was estimated from subjects occupational history.
It was found that there was no association between pharyngeal or sinona¬
sal cancer and occupational formaldehyde exposure.
Blair et al (1986) conducted a study in which the exposure
histories of 26,561 people who worked in formaldehyde-producing or
-using facilities were estimated. However, Blair took two added steps
in attempting to estimate the employees' exposure history. First, he
sent an estimate of each employee's exposure history to the industrial
hygienist at the plant the employee worked for review. Second, for¬
maldehyde samples were taken at the employee's work location using
du Pont and 3M passive dosimeters and a NIOSH analytical method.
From this study, it was concluded that cancer was not related to
formaldehyde exposure. However, persons exposed to formaldehyde did
show a slight excess in Hodgkin's disease and cancers of the lung and
prostate gland, but these excess cancers were not related to the dura¬
tion of or average, cumulative, or peak exposure.
In another study done by Vaughan (1986), the relationship between
46
nasal cavity was examined using a population-based case-control study
in 13 counties in western Washington. An attempt was made to include
all cases of pharyngeal cancer (diagnosed between 1980-1983) and sinona-sal cancer diagnosed between 1979-1983) occuring in people 20-74 years
old. Controls were selected randomly. The home interviews consisted
of questioning the people on their residential history since 1950. This included the type of dwelling, use of urea-formaldehyde foam insulation
(UFFI), and occurence of home renovation or new construction using par¬
ticle board of plywood, and a lifetime occupational history.
Information about potential confounding factors, such as smoking,
drinking, and demographic characteristics were also collected. There
were 552 control subjects, 205 with oro-and hypopharyngeal cancers,
(including unspecified pharyngeal sites) 27 nasopharyngeal cancers, and
53 sinonasal cancers. It was found that there was a strong association
between having lived in a mobile home and nasopharyngeal cancer, but not
with cancers of the pharynx or sinonasal cancer. Several other factors
lend credence to this association. First, it is well established that
elevated formaldehyde concentrations occur in mobile homes. Second, the
findings linking nasopharyngeal cancers to living in a mobile home is
consistent with the results a previous report. Vaughan (1986) found
risk estimates consistently but not significantly higher for residents
of mobile homes.
In the Vaughan study, even though an apparent association was found
between nasopharyngeal cancer and residence in a mobile home and the
study was controlled for such confounding factors as smoking, alcohol
47
Also, for some of the cancer victims, the next of kin were interviewed, while the controls themselves were interviewed (Vaughan, 1986).
EXPOSURE STANDARDS:
In 1985, the American Conference of Governmental Industrial Hygienists
(ACGIH) recommended a Threshold Limit Value (TLV) of 1.0 ppm as a:.«^tight
hour Time Weighted Average (TWA),and 2.0 ppm as a Short Term Exposure
Limit (STEL). The STEL is defined by ACGIH as a 15-minute TWA which
should not be exceeded at any time during the work day, even if the
8-hour TWA is within the TLV. Exposures at the STEL should not last for
more than 15 minutes, 4 times a day. Also, there must be 60 minutes
between successive exposures at the STEL. The ACGIH also recognizes
formaldehyde as an Industrial Substance Suspect of Carcinogenic
Potential For Man. This was based on either 1) limited epidemiologic
evidence, exclusive of clinical reports of single cases, or 2) a
demontration of carcinogensis in one or more animal species by
appropriate methods (ACGIH, 1985).
The current Occupational Safety and Health Administration (OSHA)
Permissible Exposure Limit (PEL) is 3.0 ppm as a TWA over an eight hour workshift. As long as this average is met, the ceiling level is 5.0
ppm, and a peak of 10.0 ppm is allowed for no more than thirty minutes.
However, the Occupational Safety and Health, U.S. Department of Labor
determined (based on a review of the health effects of formaldehyde)
that the current PEL'S do not adequately protect workers. The proposed
TWA PEL would be 1.0 ppm over an eight hour workshift, with the ceiling
48
49
APPENDIX B: FORMALDEHYDE GENERATION RATE DETERMINATION
To determine the rate at which the formaldehyde was emitted during
the necropsy procedure, (generation rate) a 150 milliliter beaker was
filled with about 65 milliliters of the formalin solution. A tissue was
soaked in the formalin to simulate the animal organs. The beaker with
the formalin, the tissue, the parafilm sheet the tissue was placed on,
and the plastic bag all the materials were placed in was weighed. The materials were then placed in a hood operating at 200 feet per minute
(fpm). The tissue was removed from the jar and placed on a sheet of
parafilm and allowed to sit out for 30 minutes. Then the beaker,
tissue, and parafilm were all placed in the plastic bag and reweighed.
The following method was used to determine the vapor generation rate:
weight before: 152.8288 grams - weight after: 141.4588 grams
11.37 grams
11.37 grams = .379 grams/minute = weight of formalin evaporated in 30 minutes 1 minute
density of formalin = 1.08 grams/cubic centimeter
Then, using the ideal gas law:
pV = nRT
50
p = pressure = 1.01 atmosphere
V = volume = ?
n = number of moles = # of grams______ = 0.379 grams = 0.0156 moles
Molecular Weight 24.23
R = constant = 0.0821 liter-atmosphere
mole-°K
T = temperature = 23°C + 273.2 = 296.2°K
Assuming everything that evaporates is formaldehyde:
V = nRT = (0.0156 moles)(0.0821 liter-atm.)(296.2 °K) = 0.376 liters
p mole-°K minute
1.01 atmospheres
A flowrate of 1.0 liters/minute was chosen as the sulfur
hexafluoride release rate for the first test series in order to allow
for a conservative margin of error for the maximum anticipated for¬
maldehyde release during actual work.
In the second series of tests, since the objective was to
determine whether obstructions within the hood or the presence of the
mannequin effected hood performance, the hood had to "fail". In this
case, failure was defined as the inability of the hood to control the
contaminant below 0.1 ppm (the lower detectable limit of the instrument
used to detect the SF ) at a face velocity of 100 fpm (the face velocity
6
the hood was designed to pull).
To determine the tracer gas release rate required for hood failure,
the SF was released into the hood until readable concentrations were
6
found. The rotameter was then calibrated for that reading. It was
found that the generation rate of SF necessary for hood failure at 100
6
51
APPENDIX C: CALIBRATION OF THE LONG PATH INFRA-RED GAS ANALYZER
The absorbance of infrared radiation is directly proportional to
the concentration of the gas and the pathlength of the cell. Absorbance
can be defined as:
A= clo/^ where:
A= absorbance
c= concentration of gas in cell 1= pathlength of the cell
<L= absorbance coefficient at specific wavelength
According to the Beer-Lamber law:
1= I 10
o
where:
1= intensity of light traversing the cell
I = intensity of the light source
o
Transmittance can be defined as:
%T= 100 I/I
o
where:
%T= percentage of light transmitted
By rearranging the above equations:
-cl-C -A 3^T/100= I/I = 10 =10
-A %T/100= 10
or log %T-2= -A
52
The above equation predicts a linear response between both absor¬
bance and the percent of light transmitted and the concentration of gas
in the cell. As the concentration of the gas increases, the frequency
of intermolecular collisions increases. The energy normally absorbed by
the light is now absorbed by these intermolecular collisions.
Therefore, the response of the Miran eventually "flattens" with an
increase in gas concentration.
The calibration of the Miran is accomplished by injecting known
amounts of the gas into the closed loop calibration system provided with the Miran. First, the range the calibration curve must cover is deter¬
mined. Using the equation: '
C = V/V
(ppm) where:
C= concentration of the gas in the cell
V= cummulative volume of calibration gas (microliters)
V = volume of Miran cell and calibration loop (liters)o
the amount of gas to be injected for that concentration range is deter¬
mined. The closed loop system furnished is attached to the sampling ports. A gas tight syringe is used to inject the 99.75% pure sulfur
hexafluoride into the septum of the system. After each injection, the absorbance was recorded after the reading stabilized. After each injec¬ tion, the calibration system was flushed with "zero air" until the
53
f
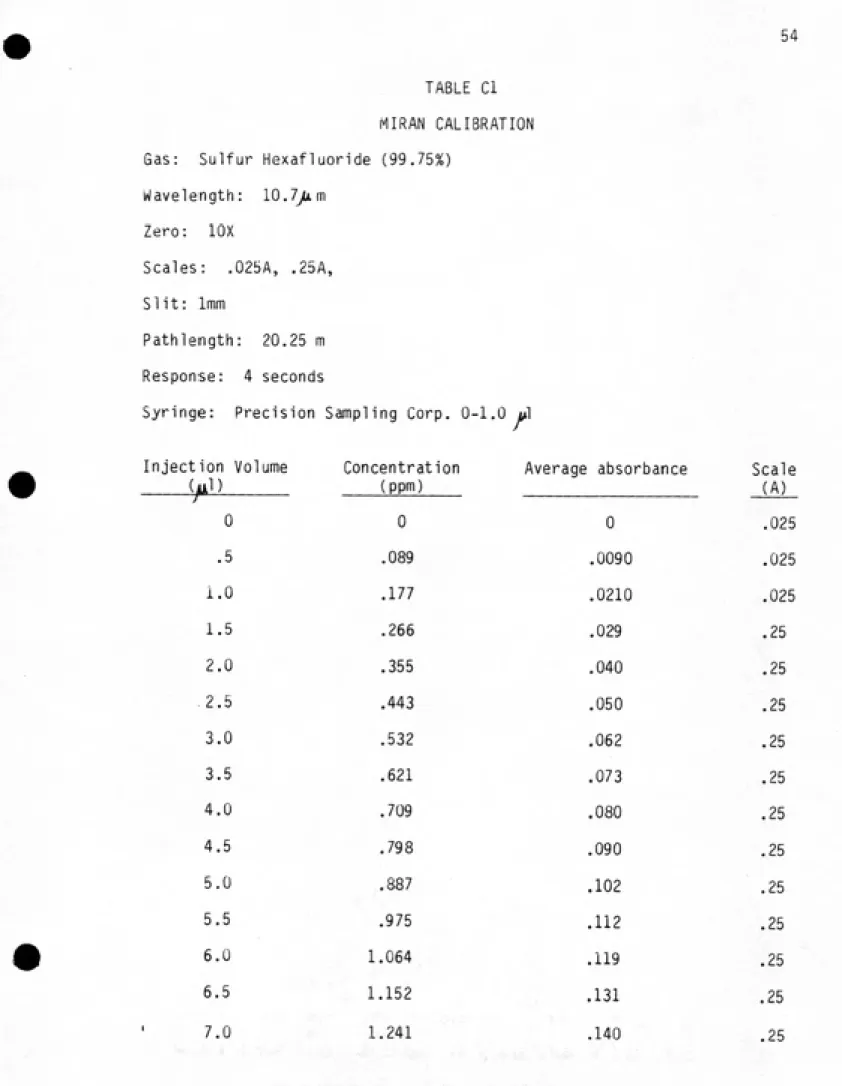
Three injections were made at each injection volume. The average
absorbance reading along with the Miran settings can be found in Tables
Ci to C3, and the calibration curve can be found on Figures CI to C3.
Also, the Miran settings used during calibration were used during the
54
TABLE CI
MI RAN CALIBRATION Gas: Sulfur Hexafluoride (99.75%)
Wavelength: 10,7^m
Zero: lOX
Scales: .025A, .25A,
Slit: 1mm
Pathlength: 20.25 m
Response: 4 seconds
Syringe: Precision Sampling Corp. 0-1.0 ul
Injection Volume
(ill)
Concentration
(ppm)
Average absorbance Scale
(A)
r
0 0 0 .025
•5 .089 .0090 .025
1.0 .177 .0210
.025
1.5 .266 .029 .25
2.0 .355 .040
.25
2.5 .443 .050
.25
3.0 .532 .062 .25
3.5 .621 .073
.25
4.0 .709 .080
.25
4.5 .798 .090
.25
5.0 .887 .102
.25
5.5 .975 .112
.25
6.0 1.064 .119
.25
6.5 1.152
.131 .25
3
<
0 .4
Figure CI;
.5 .6 .7
Cone, (ppm)
.8
en
on
Calibration Curve: Sulfur Hexafluoride
56
TABLE C2
MIRAN CALIBRATION Gas: Sulfur Hexafluoride (99.75%)
Wavelength: 10.7u.m
Zero: lOX
Scales: .25A, lA
Slit: 1mm
Pathlength: 20.25 m
Response: 1 second
Syringe: Precision Sampling Corp. 0-10^
Injection Volume Concentration
(ppm)
Average Absorbance Scale
(A)
5.5 .975 .112 .25
11.0 1.95 .200 .25
16.5 2.93 .257
22.0 3.90 .295
27.5 4.88 .326
33.0 5.85 .352
38.5 6.83 .374
44.0 7.80 .392
49.5 8.78 .409
55.0 9.75 .424
.50
.40
.30
.20-.10 _.
I
4
T
8
T
9 10
T"
11
Cone, (ppm)
Figure C2: Calibration Curve: Sulfur Hexafluoride
58
TABLE C3
MI RAN CALIBRATION Gas: Sulfur Hexafluoride (99.75%)
Wavelength: 10.7^m
Zero: lOX Scale: lA Slit: 1mm
Pathlength: 20.25 m Response: 1 second
Syringe: Precision Sampling Corp. 0-•50 >1
Injection Vo"
(hi)
ume Concentration
(ppm)
Avei"age Absorbance Scale
(A)
60.5
4
10.73 .45
110.5 19.59 .555
160.5 28.46 .63
210.5 37.23 .692
260.5 46.19 .738
310.5 55.05 .78
360.5 63.92 .817
410.5 72.78 .845
460.5 81.65 .87
510.5 90.51 .893
1.00 ^
.90 H
.601
60
Cone (ppm)
Figure C3: Calibration Curve: Sulfur Hexafluoride
Concentration Versus Absorbance Units