2 ABSTRACT Kevin Mensah-Biney
The Effect of Exercise on the Antibody Response to Influenza Vaccine in Type 2 Diabetics
(Under the direction of Melinda Beck, Ph.D.)
Obesity is a growing health problem that is affecting over one third of the adult population in the United States. Obesity increases an individual’s risk for diseases such as hypertension, cardiovascular disease, and type 2 diabetes. The prevalence of type 2 diabetes is growing in a trend similar to obesity in the United States. Obesity and type 2 diabetes has been shown to be immunosuppressive and increase an individual’s
susceptibility to influenza infection. Increased physical activity and exercise has been shown to decrease the risks for complications associated with obesity and type 2 diabetes as well as increasing immune function. In the present pilot study we wanted to look at the differences in antibody response between obese non-diabetics and obese diabetics based on exercise and physical activity. To do this we collected serum from obese non-diabetics and obese diabetics pre- and post-vaccination of the influenza vaccine and used an
3
ACKNOWLEDGEMENTS
4
TABLE OF CONTENTS
LIST OF TABLES ...5
LIST OF FIGURES ...6
LIST OF ABBREVIATIONS ...7
Chapter 1. INTRODUCTION 1.1 Obesity ...8
1.2 Diabetes Mellitus ...9
1.3 Influenza Virus...10
1.4 Influenza Vaccine ...11
1.5 Immunoglobulin G ...12
1.6 Obesity and Influenza Vaccination ...13
1.7 Diabetes, Obesity, and Exercise ...14
2. SPECIFIC AIMS AND HYPOTHESES ...15
3. METHODS 3.1 Study Design ...16
3.2 Serum Collection ...20
3.3 Enzyme-Linked Immunosorbent Assay (ELISA) ...20
3.4 Statistical Analysis ...22
4. RESULTS 4.1 Demographics of the Study Population ...23
4.2 Antibody Response ...23
5. DISCUSSION 5.1 Immune Response to Influenza Vaccine...32
5.2 Limitations ...33
5.3 Future Studies ...34
5
LIST OF TABLES Table
6
LIST OF FIGURES Figure
1. The RAPA survey given to all of the participants in the ongoing prospective observational study at the University of North Carolina Family Medicine Center to assess the amount of physical activity the participants conducted ...18 2. The mean percent change in IgG1 antibody titer from pre- to post-vaccination
among the different groups ...24 3. The mean percent change in IgG2 antibody titer from pre- to post-vaccination
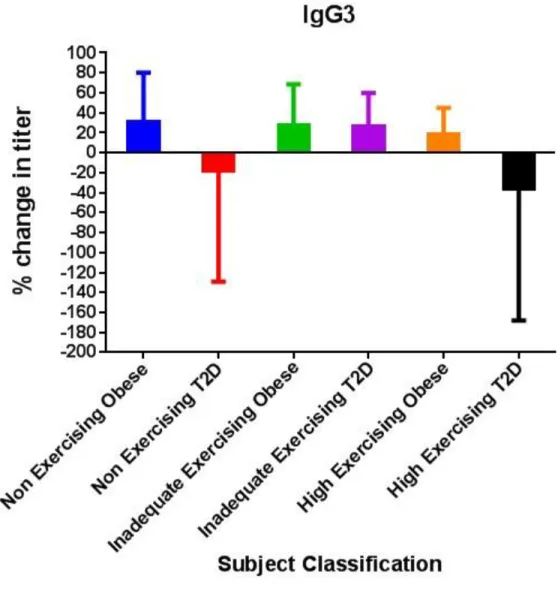
among the different groups ...26 4. The mean percent change in IgG3 antibody titer from pre- to post-vaccination
among the different groups ...27 5. The mean percent change in IgG4 antibody titer from pre- to post-vaccination
among the different groups ...29 6. Vaccine treatment induced significant expression in IgG1 and IgG3, but not in
IgG2 and IgG4 ...30 7. The percentage of each group that had a least a 30% percent change four each of
7
LIST OF ABBREVIATIONS U.S. United States
BMI body mass index
CDC Centers for Disease Control and Prevention GLUT4 glucose transporter type 4
HbA1c hemoglobin A1c H hemagglutinin
N neuraminidase
WHO World Health Organization FDA Food and Drug Administration TIV trivalent inactive vaccines
LAIV live attenuated cold-adapted influenza vaccines IgG Immunoglobulin G
RAPA rapid assessment of physical activity xg times the acceleration due to gravity ELISA enzyme-linked immunosorbent assay PBS phosphate buffered saline
PBSt phosphate buffered saline with Tween® TMB tetramethylbenzidine
8 CHAPTER 1 INTRODUCTION 1.1 Obesity
Obesity is a health condition associated with excessive accumulation of adipose tissue. Obesity has become a growing health concern in the United States and around the world. In the U.S., the percentage of obese individuals has dramatically increased in the past two decades to approximately 35.7% among the adult population.1 Obesity is typically caused by an individual’s behavioral choices such as eating high calorie diets and lacking physical activity. Obesity is related to many health problems since the condition increases one’s risks for diseases such as type 2 diabetes, hypertension, heart disease, etc. In addition to these conditions, obesity has been shown to weaken immune responses.2
9
adipose tissue, an individual with a high amount of muscle mass could have a high BMI despite having a low amount of body fat.
1.2 Diabetes Mellitus
Approximately 11.3% of adults in the United States have diabetes.4 The disease is associated with high blood glucose levels known as hyperglycemia. Complications from hyperglycemia include heart disease, stroke, kidney disease, and neuropathy. The
hyperglycemia can be attributed to problems with insulin, one of the hormones involved in regulating blood glucose.
Insulin is secreted by the beta cells in the pancreas when the levels of glucose in the blood are high such as after a meal. Insulin signals cells such as adipocytes, skeletal muscle cells, and heart muscle cells to transfer GLUT4 transporters to the cell membrane to take in more glucose and reduce the amount of glucose in the blood. Insulin also inhibits glucagon, a hormone that is secreted when blood glucose levels are low to result in more glucose being secreted in the blood.
There are two forms of diabetes, Type 1 and Type 2 diabetes. Type 1 diabetes is caused by an autoimmune attack of the beta cells of the pancreas and results in the body failing to produce insulin. Type 2 diabetes is associated with insulin resistance that comes from a disruption in the insulin signaling pathway. One of the risk factors for Type 2 diabetes is being overweight or obese since it contributes to insulin resistance. Other risk factors include old age and genetics. Type 2 diabetes accounts for 90-95% of the
10
Type 2 diabetes can be diagnosed by three different types of blood tests which include a fasting plasma glucose test, an oral glucose tolerance test, and measuring the levels of hemoglobin A1c. The fasting plasma glucose test involves testing the levels of glucose in the blood of an individual that has fasted in at least eight hours.6 A level below 100 mg/dL is considered normal.6 An individual with a level between 100 and 125 mg/dL is classified as pre-diabetic and an individual with levels higher than 125 mg/dL is
classified as diabetic.6 Pre-diabetics are individuals that have a higher than normal fasting blood glucose level but are not considered diabetic.6 The oral glucose tolerance test is similar to the fasting plasma glucose test but the individual drinks 75 grams of glucose dissolved in water after an eight hour fast and 2 hours before the test.6 The classifications for this test are pre-diabetics have a plasma glucose level between 140 and 199 mg/dL and diabetics have a level higher than 199 mg/dL.6 The hemoglobin A1c test does not involve fasting and represents blood glucose levels over the past three months.6 Glucose covalently binds to the protein hemoglobin in red blood cells to form hemoglobin A1c and red bloods cells have an average lifespan of three months. A level between 5.7 and 6.4% is classified as pre-diabetic and a level higher than 6.4% is classified as diabetic.6 1.3 Influenza Virus
11
Some individuals that are more vulnerable to the flu include older adults, children, pregnant women, and people with compromised immune systems.8
The flu is caused by infection with influenza virus. Individuals can spread the flu from approximately 6 feet away in droplets that come from talking, coughing, or
sneezing.9 The viruses in these droplets can be inhaled into another person to infect their respiratory tract through the nose, throat, and lungs.9 Adults can infect others about a day before flu symptoms appear and symptoms can arrive one to four days after the virus enters a host.9
There are three different types of influenza viruses which are A, B, and C.
Influenza A and B are the two types most associated with epidemics.10 The viral genome of Influenza A is composed of 8 RNA segments. Influenza A is classified into different subtypes based on two proteins on the viral surface known as hemagglutinin (H) and neuraminidase (N).10 There are 18 hemagglutinin subtypes that are classified from H1 to H18 and 11 neuraminidase subtypes that are classified from N1 to N11.10
Influenza viruses can change through processes known as antigenic drift and antigenic shift.11 In antigenic drift, there are mutations in the genome of the virus that can result in changes in the surface H protein such that antibodies do not recognize the altered H protein. In antigenic shift, a new viral strain forms from two different viral strains infecting a host cell and combining their segmented genetic material to form a new viral strain.
1.4 Influenza Vaccine
12
based on the recommendations. In the US, the Food and Drug Administration (FDA) determines the influenza strains that will be included in the vaccine. The vaccine contains the strains of viruses that are predicted to be the most common during the upcoming flu season. The vaccine typically is trivalent with three viral strains but for the 2013-2014 flu season, a quadrivalent vaccine with four viral strains was made available.12 The trivalent vaccine contains two Influenza A strains and one B strain while the quadrivalent vaccine contains two A strains and two B strains.12 Trivalent inactive vaccine (TIV) and live attenuated influenza vaccine (LAIV) are the two methods of vaccination.12 TIV is injected into the muscle and contains inactivated virus which is enriched in the H and N for antigen recognition. TIV is recommended for individuals older than 6 months.12 LAIV is a nasal spray administered into the nostril and contains live and weakened viral strains. This type of vaccine is recommended for individuals between the ages of 2 and 49.12
1.5 Immunoglobulin G
13
encounter with an antigen, B cells differentiate into plasma cells that secrete antibodies that can bind to the antigen and prevent infection.15
Antibodies include IgG, IgM, IgD, and IgE. IgG is the most common antibody found in the blood.15 IgG antibodies are more active during a secondary response.15 IgG antibodies can be further classified into four different subclasses from IgG1 to IgG4. The number of the subclass correlates to each subclass’s relative abundance in the blood with IgG1 as the most abundant and IgG4 as the least abundant. IgG1 and IgG3 are more associated with reacting with viruses such as influenza.15 IgG2 is associated with reacting with pathogens with polysaccharide antigens such as bacteria like Streptococcus
pneumonia.15 IgG4 is associated with repeated exposures to an antigen.15 1.6 Obesity and Influenza Vaccination
Studies have shown that obesity is immunosuppressive and decreases the antibody response to tetanus toxoid and the hepatitis B vaccine.2 Diet-induced obese mice have a greater mortality to flu infection and weakened innate immune responses.2 An ongoing prospective observational study at the University of North Carolina Family Medicine Center examined the effect of BMI on the immune response to flu vaccine in human adults.2 Based on data from the first two years, it was determined that obese and healthy weight individuals increased their IgG antibodies specific for the vaccine one month after vaccination, However, one year after vaccination, the obese had a greater decline in antibody titers when compared with the healthy weight population.2 The decline in antibody titer in the obese from the study demonstrates that the obesity may have impair the immune response to the influenza vaccine.
14
As highlighted in the previous section, the immunosuppressive nature of obesity can put obese individuals at a higher risk for infection and possibly reduce the
effectiveness of vaccination. The immunity impairment may be due to leptin resistance, inflammation, metabolic changes, or other unknown mechanisms.2 Diabetes has also been shown to impair immunity. The impaired immunity can be due solely to diabetes or the common characteristics shared by diabetics such as old age and obesity.
Exercise and increased physical activity has been known as a behavioral change to treat and reverse the effects of obesity and diabetes. Exercise can decrease body fat and increase insulin sensitivity. Exercise has also been shown to reduce inflammation that can cause immunosuppression.13 The CDC recommends an equal mix of moderately intense to vigorous aerobic exercise per week and muscle strengthening exercise on 2 or more days a week for adults.14
15 CHAPTER 2
SPECIFIC AIMS AND HYPOTHESES
Specific Aim One: To determine if vaccination for influenza increases the antibody titer for IgG1, IgG2, IgG3, and IgG4 in the study subjects.
Hypothesis: The titer will increase for all four antibodies in all of the study subjects. Specific Aim Two: To determine if exercise exhibits a unique difference in antibody response to influenza vaccine in Type 2 diabetic subjects as compared to obese non-diabetic subjects.
16 CHAPTER 3
METHODS 3.1 Study Design:
The subjects in the study were taken from volunteers in an ongoing prospective observational study at the University of North Carolina Family Medicine Center which is an outpatient primary care facility located in Chapel Hill, NC. The larger study enrolled participants that were at least 18 years of age and were scheduled to receive the seasonal flu vaccine for the 2013-2014 flu season. All participants were excluded if they had the following criteria: immunosuppresion, self-reported use of immunomodulator or immunosuppressive drugs, acute febrile illness, history of hypersensitivity to any
influenza vaccine components, history of Guillian-Barre syndrome, or use of theophylline preparations or Warfarin.
After enrollment, informed consent was obtained from all of the participants. The height and weight for all the participants were measured and a baseline blood sample was taken from each participants. The participants were then injected with one dose of the 2013-2014 TIV (0.5 mL Fluzone (Sanofi Pasteur, Swiftwater, PA, USA) containing A/California/7/2009 (H1N1)pdm09-like virus, A/Texas/50/2012 (H3N2) and
17
In this study we selected serum samples from 107 participants. The participants were separated into six groups: non-exercising obese, non-exercising diabetics,
inadequate exercising obese, inadequate exercising diabetics, high exercising obese, and high exercising diabetics. All of the participants reported their diabetes status orally after enrollment and were confirmed from their medical records. All of the obese participants in the study were participants that did not report diabetes (and confirmed from the medical record) and had a BMI classified as obese. The diabetic participants were participants that had reported having type 2 diabetes and had a BMI classified as obese. The high exercising obese category includes diabetics with a BMI that is classified as overweight to increase the sample size of the group. Exercise status was classified based on the participants’ response to the RAPA survey shown in Figure 1. Non-exercising participants were classified as such if they answered “no” to question 3 through question 7, answered “yes” to either question 1 or question 2, and answered “no” to the question corresponding to “strength.” High exercising participants were classified as such if they met the CDC’s recommendation for physical activity which includes both activities to increase muscle strength and aerobic activity every week. To fit in this category,
18
19 Table 1. Demographics of the study population Groups Number
of Subjects Sex Ratio (M:F) Mean Age ± SD Age Range
Race Mean BMI ± SD BMI Range Non Exercising Obese
15 3:12 56±9 41-69 9 white and
6 black
35.9±6 30.3-49.6
Non Exercising T2D
18 8:10 57±10 32-70 11 white
and seven black
37.6±7 28.7-54.2
Inadequate Exercising Obese
27 5:22 50±10 32-71 18 white
and 9 black
35.4±4 30.6-41.9
Inadequate Exercising T2D
28 10:18 59±7 43-71 14 white, 13 black, 1 Asian
38±7 30.0-55.6
High Exercising Obese
9 3:06 57±12 33-71 5 white, 3
black, 1 Hispanic
35±4 29.9-42.1
High Exercising T2D
10 5:05 62±9 46-73 4 white and
6 black
20 3.2 Serum Collection
Pre- and post-vaccine blood draws were collected into a vacutainer tube and allowed to clot for 30-60 minutes at room temperature and then refrigerated at 4°C. The blood was then centrifuged in the tubes at 800 xg for 10 minutes in a IEC Centra MP4R. After the centrifuge step, 0.5 mL of the serum was aliquoted into the small 1.2 mL serum tubes. These tubes were stored in a freezer at -80°C.
3.3 Enzyme-Linked Immunosorbent Assay (ELISA)
To quantify the four different IgG antibodies, ELISA was used with the 2013-2014 seasonal TIV as the antigen. The vaccine was diluted in a carbonate coating buffer to be absorbed in 96-well microtitration ELISA plates. Four different ELISA plates were used for the four different antibodies. For three of the plates that would quantify IgG1, IgG2, and IgG3, the vaccine was diluted in a 1:160 ratio in the coating buffer. For the fourth plate that would quantify IgG4, the vaccine was diluted in a 1:80 in the coating buffer. All of the plates were filled with 50 μL of the diluted vaccine solution in each well. The plates were refrigerated overnight at 4°C.
After refrigeration, the plates were discarded of the vaccine solution and the wells were filled with 200 μL of block buffer to block the remaining protein-binding sites in the well. The block buffer was composed of coating buffer and 3% of nonfat dry milk. The plates were then incubated in 37°C for at least one hour.
21
serum. Each thawed serum samples were individually diluted into four different
solutions. One solution had the serum diluted in a 1:6400 ratio, another solution had the serum diluted in a 1:100 ratio, another solution had the serum diluted in a 1:400 ratio, and the last solution had the serum diluted in a 1:200 ratio.
After the incubation, the plates were washed three times with PBSt solution using an ELISA plate washer. All of the plates were filled with 50 μL triplicates of each
sample. The IgG1 plate was filled with the 1:6400 dilution solution, the IgG2 plate was filled with the 1:100 dilution solution, the IgG3 plate was filled with the 1:400 dilution solution, and the IgG4 plate was filled with the 1:200 dilution solution. The plates were then incubated in 37°C for 2 hours. The antibodies in the serum would react and bind to the vaccine antigen in the wells.
The next step involved detecting the bound antibodies with a corresponding horseradish peroxidase-conjugated goat anti-human IgG subtype (Abcam, Cambridge, MA, USA). Anti-human IgG1, IgG2, and IgG3 were diluted in dilution buffer in a 1:1000 ratio. Anti-human IgG4 was diluted in dilution buffer in a 1:500 ratio. After the
incubation, the plates were washed three times with PBSt using the ELISA plate washer. The anti-human IgG solutions were added to the plate corresponding to specific antibody subtype. Each well was added with 50 μL of the solution. The plates were incubated in 37°C for 1 hour.
After the incubation, the plates were washed three times with PBSt using the ELISA plate washer. Immediately after the plate washing, every well was filled with 100 μL of TMB substrate solution mix which was composed of an equal mix of TMB
22
blue solution of varying intensities based on the samples. The plates were incubated at room temperature for 30 minutes. The wells were then added with 100 μL of 2M sulfuric acid to stop the reaction with the TMB substrate solution and turn the blue solution into a yellow solution. The color intensity of each well was measured by absorbance at 450 nm using an ELISA plate reader. The color intensity would correspond with the antibody titer in the well.
3.4 Statistical Analysis:
23 CHAPTER 4
RESULTS 4.1 Demographics of the Study Population
The participants in the study were classified into six groups: non-exercising obese, non-exercising type 2 diabetics, inadequate exercising obese, inadequate
exercising type 2 diabetics, high exercising obese, and high exercising type 2 diabetics. The demographics of the participants are listed in Table 1.
4.2 Antibody Response
For IgG1, there was a significant change in antibody titer for all groups from pre- to post-vaccination with influenza vaccine. There was not a significant change in
24
Figure 2. The mean percent change in IgG1 antibody titer from pre- to post-vaccination among the different groups.
25
32%, and 17% respectively showing a decreasing trend (Figure 7). In non-exercising diabetics, there was a 12% ± 40 percent change in IgG2 expression. In inadequate
exercising diabetics, there was a slight decrease in expression to 6.7% ± 120 and while in high exercising diabetics, the expression was 9.3 ± 30 percent change. The percentage of diabetics with at least a 30% percent change in IgG2 among the non-exercising,
inadequate exercising, and high exercising were 30%, 22%, and 14% respectively showing a decreasing trend (Figure 7)
26
Figure 3. The mean percent change in IgG2 antibody titer from pre- to post-vaccination among the different groups.
For IgG3, there was a significant change in antibody expression in all groups from pre- to post-vaccination. The difference in expression between the groups was not
significant. For the obese, exercise slightly correlated with a decreases in IgG3
27
there was a 31% ± 50 percent change from pre- to post-vaccination. From inadequate exercising to high exercising diabetics, there was a 27% ± 40 percent change and an 18% ± 27 percent change respectively. The percentage of diabetics with at least a 30% percent change in IgG3 among the non-exercising, inadequate exercising, and high exercising were 55%, 45%, and 50% respectively showing no clear trend (Figure 7).
28
29
Figure 5. The mean percent change in IgG4 antibody titer from pre- to post-vaccination among the different groups.
30
percent change in IgG1, a 2.4% percent change in IgG2, a 27% percent change in IgG3, and a 9.0% percent change in IgG4. In the inadequate exercising diabetic group, there was a -7.1% percent change in IgG1, a 6.7% percent change in IgG2, a 26% percent change in IgG3, and a -47% percent change in IgG4. In the high exercising obese group, there was a 35% percent change in IgG1, a -32% percent change in IgG2, an 18% percent change in IgG3, and a 14% percent change in IgG4. In the high exercising diabetic group, there was a 40% percent change in IgG1, a 9.3% percent change in IgG2, a -36% percent change in IgG3, and a 7.7% percent change in IgG4.
31
Figure 7. The percentage of each group that had a least a 30% percent change four each of the antibodies.
0% 10% 20% 30% 40% 50% 60% 70%
Non Exercising Obese Non Exercising T2D Inadequate Exercising Obese Inadequate Exercising T2D High Exercising Obese High Exercising T2D
Percentage of Subjects with at least a 30% fold increase
Su
b
jec
t
Gr
o
u
p
s
IgG4
IgG3
IgG2
32 CHAPTER 5 DISCUSSION 5.1 Immune Response to the Influenza Virus
Vaccination has been recommended as the most effective protection against influenza infection. Obesity and diabetes are immunosuppressive conditions so it is important for individuals with these conditions to be vaccinated to better protect
themselves from the flu. It is important to measure how individuals with these conditions respond to the flu vaccine to determine if they are potentially protected from flu
infection. In this study, we observed obese individuals that are either diabetic or non-diabetic and measured their differences in antibody response to influenza vaccination based on their level of exercise. We hypothesized that the participants that did the higher amounts of exercise would have an increased expression of all four IgG antibody
subclasses after vaccination for the flu. The study came up with some unexpected results. IgG1 antibodies react with viral antigens so it is expected that vaccine treatment would result in increased expression. The trend was seen in all groups except the
inadequate exercising diabetic group. More exercise correlated with an increase in IgG1 expression in the obese suggesting that exercise can help immune response for the obese. The same trend was seen between non-exercising and high exercising diabetics similar to the obese which would suggest that exercise improves immune response in diabetics in the same way as obesity.
33
For IgG3 antibodies, exercise correlates with decreased percentage changes in expression after vaccination in the obese. For diabetics, exercise does not show a clear trend in IgG3 expression. For all groups except non-exercising diabetics and high
exercising diabetics, there was an increase in antibody expression for IgG3. The increase in expression is expected since IgG3 is another antibody associated with viral antigens such as the flu.
For the obese, exercise shows a slight increasing trend in IgG4 antibody
expression. In the diabetic groups, exercise does not show trend in antibody expression. This could be due to IgG4 not being associated with viral antigens.
5.2 Limitations
34
on a survey meaning that their responses on the survey may not actually reflect actual exercise habits.
5.3 Future Studies
35 References:
1. Overweight and Obesity [Internet]. Atlanta (GA): Center for Disease Control and Prevention; [2012 Apr 27, cited 2014 Mar 24]. Available from:
http://www.cdc.gov/obesity/data/facts.html
2. Sheridan, PA, Paich HA et. al. 2012. Obesity is associated with impaired immune response to influenza vaccination in humans. International Journal of Obesity [Print]. [cited 2014 Mar 24] 36: 1072-1077.
3. Measuring Obesity [Internet]. Boston (MA): Harvard School of Public Health; [cited 2014 Mar 24]. Available from http://www.hsph.harvard.edu/obesity-prevention-source/obesity-definition/how-to-measure-body-fatness/
4. Assessing Your Weight and Health Risk [Internet]. Washington (DC): National Institutes of Health; [cited 2014 Mar 24]. Available from
http://www.nhlbi.nih.gov/health/public/heart/obesity/lose_wt/risk.htm
5. Age-Adjusted Percentage of Adults Aged 18 Years or Older with Diagnosed Diabetes Who Have Risk Factors for Complications, United States, 2010 [Internet]. Atlanta (GA): Center for Disease Control and Prevention; [2013 Nov 19, cited 2014 Mar 24]. Available from
http:/www.cdc.gov/diabetes/statistics/comp/fig10.htm
6. Diagnosis of Diabetes and Prediabetes [Internet]. Bethesda (MD): National Institute of Diabetes and Digestive and Kidney Diseases; [2014 Mar 5, cited 2014 Mar 24]. Available from http://diabetes.niddk.nih.gov/dm/pubs/diagnosis/
7. Seasonal Influenza (Flu). [Internet]. Atlanta (GA): Center for Disease Control and Prevention; [2013 Sep 20, cited 2014 Mar 24]. Available from
http://www.cdc.gov/flu/about/qa/disease.htm
8. Key Facts about Influenza (Flu) & Flu Vaccine. [Internet]. Atlanta (GA): Center for Disease Control and Prevention; [2013 Sep 26, cited 2014 Mar 24]. Available from http://www.cdc.gov/flu/keyfacts.htm
9. How Flu Spreads. [Internet]. Atlanta (GA): Center for Disease Control and Prevention; [2013 Sep 12, cited 2014 Mar 24]. Available from
http://www.cdc.gov/flu/about/disease/spread.htm
10. Types of Influenza Viruses. [Internet]. Atlanta (GA): Center for Disease Control and Prevention; [2014 Jan 15, cited 2014 Mar 24]. Available from
http://www.cdc.gov/flu/about/viruses/types.htm
11. How the Flu Virus Can Change: “Drift” and “Shift.” [Internet]. Atlanta (GA): Center for Disease Control and Prevention; [2011 Feb 8, cited 2014 Mar 24]. Available from http://www.cdc.gov/flu/about/viruses/change.htm
12. Key Facts About Seasonal Flu Vaccine. [Internet]. Atlanta (GA): Center for Disease Control and Prevention; [2014 Mar 6, cited 2014 Mar 24]. Available from
http://www.cdc.gov/flu/protect/keyfacts.htm
13. Gleeson, Michael, Bishop NC et. al. 2011. The anti-inflammatory effects of exercise: mechanisms and implications for the prevention and treatment of disease. Immunology [Print]. [cited 2014 Mar 24] 11: 607-615.
14. How much physical activity do adults need? [Internet]. Atlanta (GA): Center for Disease Control and Prevention; [2014 Mar 3, cited 2014 Mar 24]. Available from
36
15. Meulenbroek, AJ. 2008. Human IgG subclasses: useful diagnostic markers for immunocompetence. [Internet]. Amsterdam (The Netherlands): Sanquin; [cited 2014 Mar 24]. Available from