PAM SUSIE. Evaluation of School Worker Exposure To Methanol
From Spirit Duplicator Use. (Under The Direction of Dr. MICHAEL R. FLYNN)Methanol breathing zone exposures to schoolworkers using
spirit duplicators were measured using a Miran IR gasanalyzer. Sufficient data was collected to describe the
distribution of exposures to teachers and teaching assistants. A questionnaire focusing on duplicator use patterns was
distributed throughout sampled schools. The mean exposure to teachers from duplicator operation is 404 ppm with a standard deviation of 296 ppm. The mean exposure to teaching
assistants is 355 ppm with a standard deviation of 423. Time weighted average exposures of two clerical workers who
duplicate materials for multiple classes exceeded 780 ppm. The mean maximum daily exposure duration reported in
questionnaires was: 53 minutes for clerical workers, 33 minutes for teaching assistants and 18 minutes for teachers.
Collating and handling freshly duplicated materials
contributes significantly to total methanol body burden. The probability that teachers and teaching assistants are
receiving exposures in excess of the OSHA 15 minute STEL of
250 ppm is over 13% after 5 minutes of duplicator use. This
probability increases to 61% for teachers and 46% for teaching
1.0. Introduction...1
I. Duplicator Use & Methanol Exposure Hazard...1
II. Spirit Duplicator Process & Materials...5
2.0. Background...8
I. Literature Review of Methanol Exposure from Spirit Duplicators...8
II. Literature Review of Acute Effects of Methanol Exposure...11
III .Toxicokinetics of Acute Effects...16
IV. Toxicodynamics of Ocular Effects...21
V. Literature Review of Chronic & Subacute Effects...25
3.0. Experimental Methods &. Analysis...29
I. Sampl ing Methods...29
II. Data Analysis...36
4.0. Results...39
I. Sampling Results...39
II. Questionnaire Results...51
III.Probability of Exceeding an Occupational Exposure Limit...71
5.0. Discussion...74
I. Sampl ing Methods...74
II. Validity of Statistical Inferences...76
III.Exposure Distribution...77
IV. Methano 1 Body Burdens...79
V. Probability of Exceeding an Occupational Exposure Limit...81
6.0 Conclusions...83
7.0. Recommendations for Further Research...85
8 . 0 References...87
throughout my studies in the Environmental Sciences and
Engineering Department. I have enjoyed having him as both an
academic and project advisor. I would also like to thank Dr.
Louise Ball and Dr. Stephen Rappaport, for serving on my
committee and giving generously of their time throughout the
preparation of this report.This project would not have been possible without the
financial and logistical support of Pat Curran and the NC
Department of Environment, Health and Natural Resources,
Asbestos Program staff. I am grateful for their encouragement
during the course of this research.
I acknowledge Gary Tencer and Dr. Woodhall Stopford of
Duke University Medical Center, whose skilled insights into
the field of occupational health and hygiene led me to a
research topic which I found interesting and meaningful.
I acknowledge the enduring support and patience of my
I
husband, Rob, and my daughter, Delaney, throughout the
duration of my graduate studies.Finally, I am grateful to the teachers, teaching
assistants and school administrative staff members, all of
which provided enthusiastic cooperation during the course of
I. Duplicator Use and Methanol Exposure Hazards
Teachers routinely produce tests, hand-outs and parent
memos. Consequently, a reliable method of copying large
volumes of materials is required by schools. Due to
limited budgets, school administrators are forced to
minimize costs wherever possible. Since spirit duplicators
offer a relatively inexpensive and simple method of
satisfying copying needs, they are commonly found in North
Carolina schools
Duplicators utilize fluids or "spirits" which contain
methanol in varying concentrations. Methanol is very
volatile, with a rate of evaporation of 610 (n-butyl acetate
"= 100) (11) . This characteristic contributes to the
generation of high vapor concentrations from duplicators.
Since school duplicators are seldom ventilated,
methanol vapors are allowed to build up in the work area.
Many North Carolina schools still rely on natural
ventilation in the warmer months and antiquated steam pipes
for heating in the winter. In newer schools, where central
heating and cooling are being incorporated, HVAC and
movement are a product of this common misconception about non-industrial indoor air quality. None of the schools visited during the course of this study had any type of
local exhaust ventilation.
Poor placement of duplicators in schools exacerbates exposure hazards. In many neighborhoods, the rate of
student enrollment exceeds the pace of school construction and renovation. Spacing pressures motivate the placement of duplicators in small storage areas or in areas of multiple use, such as lounges and occupied offices. Methanol
concentrations can quickly reach high levels in small areas. And in areas of multiple use, the exposed population is expanded to include all workers using the area.
A potential methanol exposure hazard resulting from spirit duplicator use could easily go unrecognized. Among critiqued, primary sources, odor detection thresholds ranged from 4.2 - 5960 ppm with a geometric mean of 160 ppm.
Recognition odor thresholds ranged from 53 - 8940 ppm, with a geometric mean of 690 ppm (3). An earlier review of odor
thresholds (31) described a range between 13 mg/m^ and
26,840 mg/m^. The concentration described as irritating was
q
respectively, are consistent with these values (2). As discussed earlier, schools are perceived as "clean environments" in which to work. Therefore, it is not
surprising that hazard communication programs are often weak or absent altogether . Posted warning placards, which
provide information on methanol exposure hazards, are seldom
seen in schools either.
The extent to which schools rely on spirit duplicators is difficult to gage because use varies from school to
school. In preliminary phone interviews made at the onset of researching this topic, eight out of 9 NC school systems contacted still used spirit duplicators on some level. A school system in Virginia was also contacted and verified that spirit duplicators are still commonly found in their area as well. Many schools have come close to replacing duplicators entirely with photocopiers or other copying
methods. Some teachers and administrators cite
philosophical reasons as an impetus for reducing dependence on spirit duplicators and other types of reproduction
equipment. That is, hand-outs or "dittos" are seen as a poor choice of curriculum for stimulating educational development in children. In the school system where
what they were using ten years ago. Despite a probable trend towards replacement of spirit duplicators with
photocopiers and higher speed machinery. Gray & Creech Inc., a Raleigh based office equipment supplier, sells spirit
duplicators to schools throughout the state. Duplicators are described by sales staff as being very popular with schools because they are far more economical than alternate copying methods. Table I compares the cost differences between a low end photocopier and a standard model spirit duplicator. In addition to the initial equipment cost, both supplies and services required for the spirit duplicator are less expensive than those required for a basic photocopier.
TABLE I
______________PHOTOCOPIER___________ SPIRIT DUPLICATOR Cost: $1,125 ... $975
Supplies: $3.61/1000 copies $1.04/1000 copies (Toner & Developer) (Duplicator fluid
& Masters)
Service: $240/year or 60,000 $214/year,
copies, excess unlimited copies copies $.008 each
Photocopier cost based on State of NC contract no. 600-37 for a Mita DC-1205 with capability of reproducing 8 1/2" x 11" and 8 1/2" x 14", with a volume of 1000-5000 copies per month at the rate of 12 copies per minute. Spirit
Duplicator costs based on School contract information for an
355,660 were employed as teachers assistants (35). Given
the magnitude of these numbers and the prevalence of spirit
duplicators in schools, the population of workers being
exposed to methanol vapors is probably quite large.
The difficulty in assessing school worker exposures
lies in the transient nature of duplicator use. In some
schools, an assistant or clerical worker may be designated
to do all duplicating for an entire grade level or school.
In this case, exposure would occur on a nearly continuous
basis. However, in most cases, teachers or teaching
assistants do their own class duplicating as needed, such
that exposures would occur intermittently over periods of
varying duration.
II. Spirit Duplicator Process and Materials
Reproduction using a spirit duplicator requires the
following materials:
i. duplicator fluid or "spirits" ii. a spirit master
iii. duplicator paper
Spirit masters consist of a cover sheet with an ink backing.
Writing or typing on the cover sheet results in the transfer
around the spirit duplicator drum. Duplicator paper is fed into the machine from an attached tray. Fluid is delivered to a sponge like wick from either an inverted reservoir or a pump. The continuously wetted wick transfers fluid to a small cylinder by which all sheets of duplicator paper will pass and in turn become moistened. Each sheet then passes under the revolving drum containing the master. As this occurs, a small part of the methanol soluble ink is
dissolved onto the duplicating paper. Methanol serves not only as a transferring agent, but also as a drying agent because it evaporates so rapidly .
The methanol concentration of duplicator fluid ranges between 30 to 100%. Three types of blends are manufactured. Type I has the lowest methanol content. Type II contains approximately 60% methanol and type III, which is what is used in schools, contains the highest concentration of methanol (1). The material safety data sheets for the
of methanol exposure to school workers during duplicator operation. A randomly collected sample of log-normally distributed, breathing zone concentrations will form the basis for calculating the mean and standard deviation of methanol breathing zone exposures to workers at the sampled schools. In addition to estimating these distribution
parameters directly, log-transformed data will be used to calculate the geometric mean and standard deviation and the
maximum likelihood estimate of mean and standard deviation.
Exposure durations will also be described using sampling data, as well as questionnaires completed by workers. In addition, questionnaires will provide
2.0 Background
I. Literature Review of Methanol Exposure From Spirit
Duplicator Use
References dealing specifically with methanol exposure resulting from spirit duplicators are relatively few. The first citation appears in 1948 and reports on an
investigation conducted by the Connecticut State Department of Health, which involved three plants using spirit
duplicators (25). The first plant used duplicating
equipment at a rate which required 1 gallon of duplicator fluid per day. Methanol air concentrations measured at this plant were 286-430 ppm. The second plant used fluid at a rate of 1/2 gallon per week and produced methanol
concentrations of 40-50 ppm. Both plants used fluids which were 50% methanol. The third plant, which used 10 gallons of fluid per week, had methanol air concentrations between 510-635 ppm. The fluid at this plant was 75% methanol. In 1954, McAllister (25) reported that samples taken during
runs of 300-500 copies in a small test room resulted in
breathing zone concentrations between 400-800 ppm.also reports area concentrations reaching as high as 1000 ppm in the small test room, which he attributes to the rapid evaporation of methanol when finished sheets were "handled
or rifled".
The first report of health effects associated with spirit duplicator use came in 1955 when Kingsley and Hirsh
(19) described a group of clerical workers suffering from repeated and persistent headaches. These symptoms were
noticed to appear when cooler weather required the closing
of windows and air movement became stagnant. Area samples,
taken after 60 minutes of duplicator operation, revealed concentrations between 200-375 ppm. The fluid used in the sampled duplicators was described as methanol based, but no specific concentration is provided. The most recent primary reference to spirit duplicator exposures reports on the
results of a NIOSH Health Hazard Evaluation (HHE) (13) conducted in a Washington State school district. The HHE
(28) was conducted in 1980. In addition to environmental sampling, a questionnaire was distributed to exposed workers
(cases) and a similar group of unexposed workers (controls). The data resulting from survey responses indicated that
difference was in reported incidence of blurred vision, with 23% of the cases experiencing this symptom as compared to
only 1.5% of the controls (x2=12.01, p<0.001). Other
symptoms which produced significantly different results were headaches (p<0.05), dizziness (p<0.001), nausea (p<0.10) and skin problems (p<0.10). No significant difference between cases and controls occurred with respect to symptoms
unrelated to methanol exposure included on the survey . The attack rate of methanol related symptoms increased with
increasing time spent at the duplicator. Environmental sampling involved 12 schools, 21 duplicators and a cross-section of small and large rooms. Breathing zone
concentrations measured during use of unventilated machinery ranged between 365-3080 ppm. Breathing zone measurements taken at machines equipped with a variety of existing, unenclosed ventilation systems produced concentrations between 80-1340 ppm. Measurements were taken again after simple enclosures were fabricated for existing ventilation systems. This reduced concentrations to between 9-130 ppm. Breathing zone concentrations during collating and stapling materials which had been duplicated 3 hours earlier were between 180-870 ppm..The duplicator fluid used in the
Washington state school system was 99% methanol. The NIOSH report is the only citation which documents exposures
(99% methanol), such as was used by the workers included in this study. It is also the only literature source which provides a quantitative measure of both effects and
exposures resulting from spirit duplicator generated methanol exposures.
II. Literature Review Of Acute Effects Of Methanol Exposure
Ample literature citations have long given weight to the acute effects associated with methanol exposure. Among the earliest references was a report by MacFarlen (22), in 1855, which noted the adverse effect of methanol vapors on the eyes. During this period, production of methanol
resulted from a wood distillation process, hence the
historical name "wood alcohol". Because this method
resulted in low scale production and the resulting unrefined
distillate had an objectionable odor and taste, the number
of intoxication cases were relatively infrequent (18). With the advent of a deodorization process in the 1890s, the use of methanol in both consumer and industrial applications became widespread. Tyson and Schoenberg (35) report an
increase in methanol production from 400,000 gallons in 1880 to 8,000,000 gallons in 1910. By 1914, they estimated an exposed population of two million.
case reports of diminished vision or deaths prior to 1912, Tyson & Schoenberg were the earliest investigators to
provide experimental support for this idea. In reporting their results, they attempted to dispel commonly held
misconceptions which underestimated the potential hazard of methanol inhalation exposure.
As physicians who had treated numerous victims of
methanol poisoning, they advocated protective legislation to restrict the sale and use of methanol. As evidence of the gravity with which they viewed the situation, they
recommended that such laws be enforced under threat of jail penalty. From their view, such an inducement was necessary
since "...certain number of manufacturers who value human
life cheaply will continue to be a menace to society by disregarding the law and causing blindness and death (35)".
Unfortunately, in Roe's extensive historical review of methanol (30), published in 1946, he contends that the
toxicity of methanol remained widely disputed in the medical community until the 1920s. Those who doubted the toxicity of methanol, asserted that the impurities found in marketed preparations were responsible for the numerous cases of diminished vision, blindness and deaths, unarguably
Although it is now understood that metabolic differences between species produce less toxic effects in rodents than
in humans and non-human primates (24), early rat studies which produced no vision effects or fatal outcomes after high, pure methanol exposure supported the argument of those who viewed impurities as the etiological factor in
poisoning. Variable responses between individuals also made it difficult to establish a clear dose/response
relationship. Roe asserts the controversy was settled in 1922 when an outbreak of methanol poisoning occurred among dockworkers handling a shipment of pure grade methanol bound
for a chemistry lab in Hamburg. Since impurities were
present in such miniscule quantities (less than 0.015%), it was no longer plausible to assert their role in poisoning.
Despite conclusive evidence of methanol's lethality, during periods of liquor scarcity, such as prohibition, war or destitution, poisonings continued to occur and often in epidemic proportions. This was largely due to economic factors, since the development of a synthetic production
method in the mid-1920s had reduced methanol costs below that of ethanol (26). An example of the epidemic
contaminated bootleg liquor. Of these, 41 resulted in fatalities (5). When methanol production increased yet a third time during World War II, additional interest in
defining safe conditions for industrial exposure to methanol began to emerge (21). These studies focused on the acute effects associated with high exposure concentrations.
Numerous citations (18) describe case reports and experiments verifying inhalation and skin absorption as viable routes of exposure. De Schweinitz (10) published a
case report in 1901 of a painter and varnisher who worked on
and off for three years, with intermittent exposure tomethanol. The worker described becoming dizzy when working in small areas on hot days. He also used methanol to remove varnish from his hands, arms and face. After working two months consecutively, he began experiencing chills,
numbness, and pain in his lower extremities. The next day he become blind. Despite a brief and partial recovery some weeks later, he was eventually left totally blind. During
landmark experiment by McCord (26), involving animal exposure to methanol by skin absorption, inhalation and ingestion, demonstrated that intoxication occurred through all routes of exposure. The experiment, which involved 31 rhesus monkeys, 58 rabbits and 176 rats, concluded that
species differences were more critical to toxic effects than was route of exposure.
Evidence of the toxicity of methanol by skin absorption in humans was provided by Giminez (14) in 1968. He reports that a common home remedy in Argentinian culture for colic in small children and infants was application of alcohol
saturated cloth to the stomach. Methanol, in the form of
fuel oil, was easily obtained and used for this purpose. Cloth soaked with alcohol was placed under rubber panties such that evaporation was prevented and exposure by
(posterior inner region of eye) bleeding in 2 cases and edema and softening of the brain in another case. Given that the acute effects of methanol can be produced by inhalation and skin absorption, as well as ingestion, and that there is ample case reporting regarding effects
resulting from ingestion, the acute toxicity of methanol is relatively well understood.
Methanol is also a contact skin irritant. Continuous
or extended exposure to the skin can result in defatting, drying, cracking, and brittleness (23). Tissue studies
involving animals demonstrated a progression from irritation to ulceration and necrosis (34). Scaling and erythema have also been reported (14). Like other alcohols, methanol is also a general central nervous system depressant (20) and a
1iver toxin (7).
III. Toxicokinetics of Acute Effects
The cumulative evidence provided by a large body of literature indicates that methanol is easily and rapidly absorbed by inhalation, skin absorption and ingestion in all species. Conversely, it is very slowly eliminated.
Distribution throughout the body is proportional to tissue water content (9). Skin uptake on the lower forearm has
been reported as 0.19 mg/cm^/min (9). Absorption through
between 30-60 minutes after ingestion, with some variation contributed by the presence of food (9). A literature
review from the Netherlands concludes that methanol is able
to traverse membranes to a greater degree than water (9). The same report states that methanol passes through the
blood-brain barrier of rhesus monkeys in equal proportion to water and was shown to penetrate the placental barrier in sheep and guinea pigs to a greater extent than water.
Clearance of methanol from the body occurs through
three mechanisms:
1) Elimination of unaltered methanol through the kidneys
2) Exhalation of unaltered methanol through the lungs
3) Metabolism to CO2 and H2O in the liver
The respective clearance rates of the above mechanisms are
0.0014 h~^, 0.006 h~^. and 0.23 h~^. Since total clearance
is governed by a rate constant of 0.24 h~^, elimination
occurring through the kidneys and lungs is negligible when compared to the contribution of liver metabolism.
Although metabolism of methanol involves a saturable system, Kavet and Nauss (18) state that at low doses of exposure, first order kinetics are followed. After review of three references, they conclude that a clearance
less than 100 mg/kg, while a half-life of 24 hours or more
is seen for doses of 1 g/kg or more.The sequence of metabolic reactions, depicted in Figure
I. occurs in the liver and is the same for all species
studied (18). Formate is the agent believed responsible for
the acute effects associated with methanol poisoning. Thus,
toxicity is seen when reactions JL & 2^, from Figure I,
proceed at a rate in excess of reaction rate 3. When this
imbalance occurs, two acute effects may result. First, an
accumulation of formate induces metabolic acidosis, which
can ultimately lead to death if allowed to progress
untreated. Secondly, ocular toxicity, such as blurred
vision, temporary or permanent blindness, may occur. Visual
effects may be preceded by metabolic acidosis, however, they
have also occurred when blood pH was within physiological
1imits.The reaction steps outlined above can be further broken
down to elucidate the basis for species differences in
methanol sensitivity. The first reaction involves the
oxidation of methanol to formaldehyde. This step plays the
largest role in clearance of methanol from blood
circulation. Although reaction rates are comparable between
non-human primates and rats, the former use an alcohol
dehydrogenase enzyme system while the latter use a catalase
SEQUENCE OF METHANOL METABOLISM IN THE LIVER
METHANOL
1
FORMALDEHYDE
FORMATE (+ H+)
This dehydrogenase system appears to involve
formaldehyde-specific, NAD dependent enzymes which require glutathione. The two reactions catalyzed by this enzyme system are as follows:
l)The combination of formaldehyde with reduced glutathione to form S-formyl glutathione.
2)The hydrolysis of S-formyl glutathione to form formic acid and reduced glutathione.
The second reaction is not reversible and thus explains the observed irreversibi1ity of the breakdown of
formaldehyde to formate.
The final step of metabolism involves the breakdown of
formate to CO2 and H2O. At the onset of this step, formate
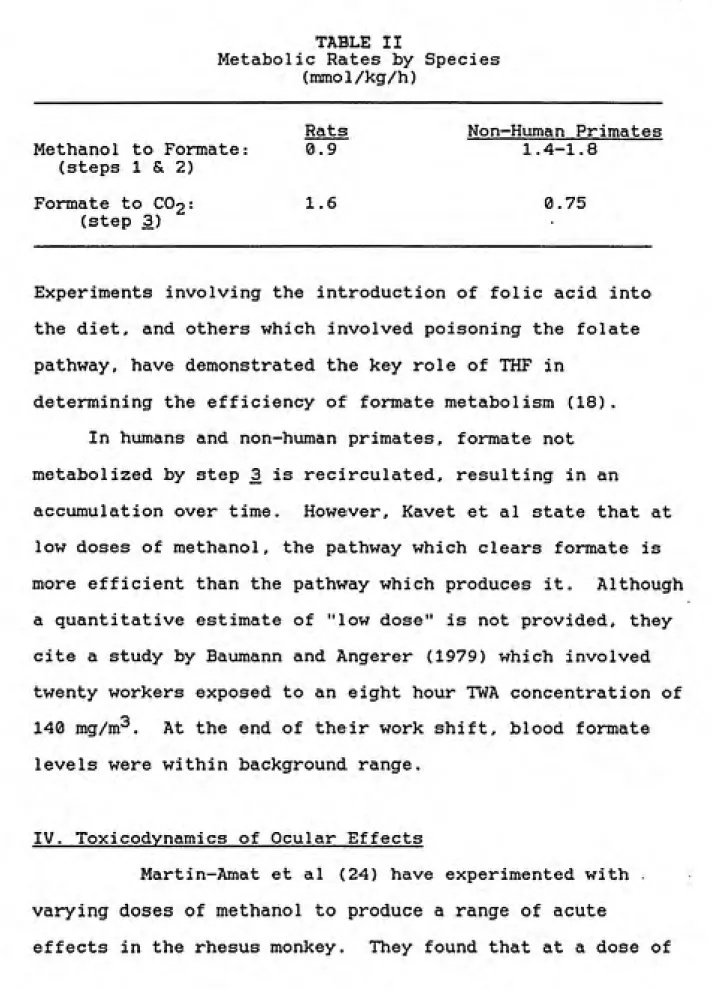
complexes with tetrahydrofolate (THF). THF is generated from folic acid in the diet and also regenerated by the folate pathway. While both species use the folate pathway, the clearance of formate from the blood and subsequent
metabolism to CO2 occurs two to two and one-half times
faster in rats than in non-human primates (18). This difference accounts for the disparity in effects seen between species. In non-human primates, steps jL & 2
metabolize methanol to formate at a faster rate than step 3
metabolizes formate to CO2, while the reverse is true in
TABLE II
Metabolic Rates by Species (mmol/kg/h)
Methanol to Formate (steps 1 & 2)
Formate to COg:
(step 3)
Rats
0.9
1.6
Non-Human Primates
1.4-1.8
0.75
Experiments involving the introduction of folic acid into the diet, and others which involved poisoning the folate
pathway, have demonstrated the key role of THF in
determining the efficiency of formate metabolism (18). In humans and non-human primates, formate not metabolized by step _3 is recirculated, resulting in an
accumulation over time. However, Kavet et al state that at low doses of methanol, the pathway which clears formate is
more efficient than the pathway which produces it. Although
a quantitative estimate of "low dose" is not provided, they cite a study by Baumann and Angerer (1979) which involved
twenty workers exposed to an eight hour TWA concentration of
140 mg/m^. At the end of their work shift, blood formate
levels were within background range.
IV. Toxicodynamics of Ocular Effects
Martin—Amat et al (24) have experimented with .
varying doses of methanol to produce a range of acute
22
3 g/kg, an irreversible metabolic acidosis was Induced which
was followed by death 20-30 hours after exposure. In order
to study sub-lethal effects, specifically ocular toxicity,
they reduced doses to 2 g/kg followed by supplemental doses
sufficient to maintain an acidotic state. Formate levels in
the animals were at least 7 mEq/liter of blood 20 hours
after initial dosing. Optic disc edema was a routine
outcome of exposures maintained at this level. The optic
disc is commonly referred to as the blind spot and is the
region at the back of the eye where the optic nerve enters
the retina. The authors point out that ocular effects are
not seen until an extended chronic acidosis generated by the
accumulation of formic acid occurs. Hayreh et al (15)
conclude that optic disc edema from methanol poisoning is
related to reduction of axoplasmic flow in the optic nerve.
Formate can enter the optic nerve through the peripapillary
choroid and cerebrospinal fluid (CSF). The peripapillary
choroid is a vascular coating of the eye adjacent to the
optic disc. It has a high rate of blood flow and is also
highly permeable. Diffusion can also occur from the CSF
which envelops the optic nerve. In two monkeys with the
most pronounced evidence of optic disc edema, CSF formate
concentrations were equal to blood concentrations.
A more detailed mechanism proposed for optic nerve
formate. Cytochome oxidase provides the metabolic energy
(ATP) necessary for normal cellular functioning. The cells
that make up the myelin sheath (white matter) are relatively
low in cytochrome oxidase. This suggests the source of the
optic nerve's apparent sensitivity to formate. Normal nerve
conduction is dependent on the axoplasmic flow of
mitochondria, proteins, and neurotubules from the neural
cell body through the axon to the synaptic junctions located
in the retina (4). Metabolic interruption of this flow
creates a "damming" effect which increases the density of
mitochondria and fragments neurotubules and neurofilaments
at cross sections of the axon. Morphological analysis of
optic nerve slices taken from the rhesus monkeys have
verified these effects (4). Disruption of flow results in
intraaxonal swelling, an ocular effect seen in methanol
poisoning. In addition to disturbance of axon transport,
other systems vital to conduction of electrical impulse
are dependent on ATP and could contribute to visual
disturbances as well. Figure II depicts a schematic of the
SUGGESTED MECHANISM OF METHANOL OCULAR TOXICITY
source: Baumbach. et ai. Mettiyl Aicoiiol Poisoning, Arcli Ophtlialmol, 95(1977)
Methanol conversion to formate
t
Inhibition of cytochome oxidase by formate
t
Inhibition of ATP formation
Stasis of axoplasmic flow
Alteration of Na-K ATP-ase activity
I
V. Literature Review of Chronic and Sub-Acute Effects Of
Methanol Exposure
Until recently, few studies have focused on the effects
of low dose exposures to methanol. However, the potential
for widespread, low level exposures to methanol, in the
event that it is adopted as an alternative motor fuel, has
generated much more research in this area. Ubaidullaev (36)
exposed male albino rats to vapor concentrations of 5 mg/m^
and 0.5 mg/m . Electroencephalography and biological
monitoring were used to measure physiological changes.
While no alterations were observed in controls or rats
exposed to 0.5 mg/m"^, the following changes were observed
ͣ
o
among rats exposed to 5 mg/m :
i) Changes in chronaxie of antagonistic muscles.
That is, the minimum duration of electrical
current required to cause contraction of muscles was altered after six weeks of continuous
exposure.
ii) Choiinesterase activity was reduced. iii) Serum protein fractions were altered.
iv) Urinary coproporphyrin/100 grams of body
weight fell off sharply after seven weeks
of continuous exposure.Based on these observations, the author recommended a mean
maximum permissible daily exposure concentration of
0.5 mg/m^.
case-control study (16), conducted in 1979, demonstrated that
women with offspring born with central nervous system (CNS)
defects were significantly more likely to have been exposed
to organic solvents during their first trimester of
pregnancy than were controls.
Nelson et al (27) investigated morphological defects in
the offspring of Sprague-Dawley rats exposed to varying
concentrations of methanol vapor during gestation. Rats
exposed to 20,000 ppm and 10,000 ppm for seven hours/day,
during days -1-19 of gestation, produced offspring with CNS
defects at dose dependent rates. However, the difference
between exposed and control groups was only significant for
rats exposed to 20,000 ppm (p<0.001). There was also a dose
response relationship for reduced fetal weights. Dams
exposed to methanol at a concentration of 20,000 ppm
produced nine fetuses out of four litters which were born
with either exencephaly (brain is located outside of skull)
or encephalocele (brain protrudes through a fissure in the
skull). Two fetuses from dams exposed to 20,000 ppm and 4
fetuses from dams exposed to 10,000 ppm were hydrocephalic
(born with increased cerebrospinal fluid in the ventricles
of the brain). The authors conclude that methanol is aThe behavioral effects on offspring of methanol exposed animals has also been investigated. Infurnia (17) exposed Long-Evans rats to 2% methanol in drinking water during
gestation days 15-17 and 17-19. Since the authors were only interested in behavioral endpoints, these days were selected because they represent a period of gestation well beyond organogenesis. They found significant differences in suckling and homing behavior between exposed animals and controls. Aberrations in suckling behavior became evident 24 hours after birth. The time required for offspring of exposed dams to successfully find their way to their nests was two times the time required by controls. The authors suggest that this latter outcome can be partly attributed to a tendency on the part of the offspring of exposed dams to
initially set out in the wrong direction during homing trials. They conclude that methanol is a behavioral
teratogen. Previous studies conducted by Infurnia showed that maternal ingestion of 2 g/kg of methanol produced fetal brain tissue concentrations equal to maternal tissue
concentrations in less than one hour. Because this
investigation produced teratogenic effects at exposure levels much lower than those utilized by Nelson et al
earlier, and because of the widely recognized difference in methanol sensitivity between primates and rodents, Infurnia
3.0 EXPERIMENTAL METHODS & ANALYSIS
I. Sampling Methods
The county based school system where sampling was
conducted, represents 23 schools. All 23 schools were
contacted by telephone and questioned about spirit
duplicator use. Most schools used both photocopiers and
spirit duplicators. Six schools reported using spirit
duplicators as their primary, if not only, reproduction
method. In some cases, photocopiers were used only to
prepare the spirit duplicator master or for copy sets of
five or less or for special jobs requiring high quality
reproduction, such as school transcripts. Five of these
schools were elementary schools and one was a junior high.
One elementary school had an enrollment of 375. However,
the other five schools all ranged between 600-800 in student
body size. In the interest of collecting a greater number
of samples for statistical strength and to sample schools
more uniform in size and duplicator use patterns, the
smaller school was omitted from the survey. This left five
schools from which to sample. These schools will be
Four schools had two separate duplicating areas and one
had three, resulting in eleven sampling sites. Adescription of each area and the spirit duplicator models in
use at each site is presented in Table III, One full day of
sampling was conducted at each site, with the exception of
school E, where the principal asked that I conduct all
sampling in one day.A Miran - lA Gas Analyzer (N.C. Division of Health
Services #31922), manufactured by Foxboro Analytical, was
used to measure methanol air concentrations in the breathing
zones (BZ) of workers. The Miran was calibrated, before and
after sampling at each school, using a 0.04 liter metal
bellows, model #MB-41, serial no.15060, in a closed loop
system. Technical grade methanol was injected into a rubber
septum, attached to the bellows, using a "Pressure-Lok"
series C-160 10 ul syringe (Lot # 1185B). Calibration
curves and information on the Miran settings used during
sampling can be found in Appendix I. To further verify the
acceptable performance of the instrument, samples were
randomly collected using alternative methods at all sampled
schools.were continuously recorded every 0.5-2 minutes into a
sampling log during duplicator use. A time-use log was also
maintained, which included the names of all duplicator users
and the time that they entered and exited the duplicating
area.
Data from these two logs were entered into a computer and a Microsoft Works spreadsheet package was used to
calculate TWA breathing zone concentrations for each worker.
The basic formula used for calculation of TWA exposures was
as follows:TWA = 1/T E [t/2 (C^ + C^+i)] (2)
where, T = Total exposure interval
t = Interval between measurements
C^ = Concentration at nth measurement
Personal samples, using silica gel tubes and breathing
zone samples, using detector tubes, were randomly pulled
throughout sampling to corroborate measurements made using
the Miran lA. Personal samples were collected during
collating in three instances as well. All samples collected
on silica gel were analyzed using gas chromatography at the
State of North Carolina Laboratory of Public Health in
Raleigh.
A questionnaire was distributed to all sampled
The questionnaire was also tailored to obtain additional
information about duplicator work practices and usepatterns. A copy of the questionnaire appears in Appendix
II.Sampling sites were similar in ventilation
characteristics. Local exhaust ventilation was not utilized
by any of the schools sampled. HVAC systems were in place
at two schools. One site had a wall mounted fan which was
too remote from the point of operation to expect a
significant effect on the vapor plume in the breathing zone
of workers. Three different models of spirit duplicators
were used among schools. All used gravity fed systems to
deliver fluids and operated in exactly the same manner.
Because machines were nearly identical in structure, vapor
generation rates were expected to be reasonably similar.
Use rates were also expected to be similar, since all
schools were relatively uniform in student enrollment anddepended on spirit duplicators for all class copying.
TABLE III
DESCRIPTION OF SAMPLING SITES
SITE______DUPLICATOR MODEL_________DESCRIPTION A-1 AB Dick 215 Media Center Office;
occupied by 2 full-time media specialists;
heavily trafficked by students & faculty using computer, AV equipment and periodicals;
2 interior doors opening to library & computer
class.
A-2 AB Dick 227 Janitors closet converted
to duplicating room; there small, inoperable ceiling exhaust; one
interior door to hall.
B-1 AB Dick 217G Work room with type
writer; 3 interior doors
to lounge areas and hall. B-2 AB Dick 217G Lounge area and work
room; Workers eat, use
phone & conduct meetings in this room; office
space for full time TA; 1
interior door to hall.
C-1 AB Dick 227 Work room & curriculum
storage; 1 interior door
to hall.
C-2 AB Dick 217G Copy room; 2 interior doors open to hall & lounge; window in room remains closed in winter
and summer (window AC
unit in lounge).
D-1 AB Dick 217G (2) Work room & curriculum storage; teacher mail
room; 1 interior door to
hall.
SITE______DUPLICATOR MODEL_________DESCRIPTION
E-1 AB Dick 227 Work room & storage area. E-2 AB Dick 217G Office of full-time TA,
whose desk is adjacent to duplicator; 1 interior
door to hal1.
E-3 AB Dick 227 Closet area with door
opening to office of
full-time worker.
Room dimensions varied from 60 sq. ft. at the smallest extreme to 825 sq. ft. at the upper extreme. The other nine sites, represented dimensions fairly well spread throughout this range. Room dimensions and ventilation characteristics are presented in Table IV. While breathing zone
concentrations seemed to reach high levels more rapidly in smaller areas, given the close proximity of workers to the source of contaminant and the relatively short periods of exposure for most sampled workers, the concentration of methanol in the vapor plume generated from the duplicator was probably more relevant to breathing zone exposures than were area concentrations dictated by room volume. Given continuous generation of vapors and extended exposure periods, dilution ventilation principles would predict
VENTIUTION CHARACTERISTICS OF
SAMPLING SITES
Site
Dimensions
(feet)
Ventilation
A-1
30X27.5
Central HVAC
A-2
10X7.5
None
B-1
15X20
Central HVAC
B-2
15X30
Central HVAC
C-1
23X14
None
C-2
10X10
None
D-1
15X20
18" Wall Fan
D-2
20X40
None
E-l
8X15
None
E-2
8X15
None
provide an approximate description of the actual exposure distribution, data collected from all schools was compiled
into one sample set.
Bulk samples of freshly duplicated paper and skin wipes made after collating were collected for estimation of skin
exposure. Samples were analyzed for methanol content using
gas chromatography at the State of NC Laboratory of Public Health in Raleigh.II. DATA ANALYSIS
Variance is effected by the averaging time used to calculate exposure concentrations (32). Therefore, it is necessary to use a uniform averaging time when trying to characterize an exposure distribution. A uniform 3 minute averaging time was used for determining the exposure
concentration distribution of sampled schools. When
exposures of less than 3 minutes ,in duration were excluded from the sample set, 48 workers with varying durations of exposure remained. Each period of worker exposure was
divided into 3 minute blocks, resulting in sets of 3 minute TWAs for each worker. If total exposure duration was not divisible by 3, exposure was broken into 3 minute blocks beginning with the first minute and working forward, and again with the last minute working backward. This was done to prevent biasing TWAs by always using averages at the
Exposure variability exists between workers as well as
between measurements for any individual worker (29).
Quantitative assessment of each source of variability
requires collecting multiple measurements for each worker.
The data collected at schools did not facilitate this type
of analysis, since multiple exposures were only recorded for
a small number of workers. Therefore one exposure value was
randomly selected for each sampled worker. The resulting
distribution represents the total variation arising from
both within-worker and between-worker components. The set
of 3 minute-TWA BZ exposures for each worker was numbered
consecutively beginning with one. A random number table was
then used to select one 3 minute TWA for each worker.
Natural logs of the resulting exposure concentrations were
calculated and tested for goodness of fit to a normal
distribution using the Shapiro-Wilks- W test. Breathing
zone concentrations were also plotted on log-probability
paper to empirically verify the log-normality of data.
Given a log-normal distribution , the following
parameters can be calculated: the mean exposure
concentration and standard deviation, the geometric mean
exposure concentration and standard deviation, and the
maximum likelihood estimate of mean and standard deviation
in Appendix III. These parameters were calculated for the distribution of breathing zone exposures described above.
In order to determine the distribution of exposure durations, an average exposure duration for each worker was calculated. The resulting 60 average exposure durations
were then used to estimate the mean, standard deviation and
median durations. Mean exposure durations, as reported in questionnaires, were also evaluated.
Since all workers sampled received exposures which would not be expected to saturate the folate pathway, first
order kinetic formulas were used to estimate methanol body burdens of sampled workers. Data recorded in the time-use log used during sampling and TWAs measured using the Miran, provided sufficient information to complete these
4.0 RESULTS
I. Sampling Results
Over nine days of sampling, 85 TWA breathing zone concentrations were collected during use of the duplicator by 60 workers. Since samples were collected over full shifts, bias associated with intraday variation was
eliminated.
Distribution of Breathing Zone Concentrations
As stated earlier, the sample set on which estimates of exposure parameters are based, consisted of randomly
selected 3-minute TWA breathing zone concentrations of 48 workers. Figure III presents a frequency polygon of this data. A frequency polygon of log transformed data appears in Figure IV.
FREQUENCY POLYGON OF 3-MIN. TWA
BREATHING ZONE CONCENTRATIONS OF METHANOL
FREQUENCY (PPM)
12
10
8
-6 —
2
-0 1-0-0 2-0-0 3-0-0 4-0-0 5-0-0 6-0-0 7-0-0 8-0-0 9-0-0 1-0-0-0 11-0-0 12-0-0 13-0-0
FREQUENCY POLYGON OF LN(3-MIN. TWA)
FREQUENCY BREATHING ZONE CONCENTRATIONS OF METHANOL
6.0
LII{TWA)
period of the day and vapor concentrations were not yet above the Miran lower detection level. When the Shapiro-Wilks test was repeated on the separated groups log
normality was satisfied for both teachers (W=0.948501, p<0.3794) and teaching assistants (W=0.943999, p<0.1797). There was not a sufficient number of clerical worker exposures to construct a sample distribution. Log probability plots of the total, teachers and teaching assistant distributions appear in Appendix V.
Given that BZ concentrations of the teachers and
teaching assistants can be described by a log-normal
distribution, the mean and the standard deviation of the
log-transformed data were used to calculate the maximum
likelihood estimate of mean and standard deviation and the
geometric mean and standard deviation. The mean and
standard deviation of the sampled clerical workers was also calculated. Statistical parameters appear in Table V.
Rappaport et al state that for intermediate sample
sizes, (20 < n < 50), either a direct estimate of the mean
or a maximum likelihood estimate of the mean adequately describe a log-normal distribution. For samples sizes less than 20, they recommend using a direct estimate of the mean. Given these guidelines, both the maximum likelihood estimate and the direct estimate of the mean are suitable
STATISTICAL PARAMETERS OF BREATHING ZONE
EXPOSURE DISTRIBUTION
Teacliers
(n=19)
Teaching Assistants
(n=26)
C erical Worlvers
(n=2)
Direct Estimate:
Mean (ppm)
404.44 321.771,041.00
Standard Deviat on
295.53 247.65 106.07Log-Transformed:
Mean
5.75 5.43Standard Deviation
0.79 0.94Max. Livelihood Est:
Mean (ppm)
429.25 354.89Standard Deviation
399.59 422.84Geometrc:
Mean (ppm)
314.19 228.15VThile the direct estimate of the mean ife likely to best describe the exposure distribution of teachers.
Measurements of Exposure Duration
Because use of spirit duplicators, among school workers, is extremely intermittent with a high degree of variability in individual durations of exposure, it was also necessary to describe the distribution of exposure durations among school workers. Frequency of exposure periods is also an important factor in assessing the extent of exposure to methanol since its elimination from the body is relatively
slow and accumulation over time can occur.
Over the entire nine day sampling period, 85 discrete intervals of exposure to methanol, during duplicator
operation, were recorded. These exposures were spread across 60 workers, indicating multiple within work shift exposures to 15 workers. For the sake of assessing average duration of exposure during each period of duplicator use, multiple exposures were averaged to obtain one value for
EXPOSURE DURATION OF 60 SAMPLED WORKERS
DURING DUPLICATOR OPERATION
FREQUENCY
2520
15
10
0.5-4.5 8.5-12.5 16.5-20.5 24.5-28.5 32,5-36.5 40.5-44.5
4.5-8.5 12.5-16.5 20.5-24.5 28.5-32.5 36.5-40.5
MINUTES
Estimation of Body Burdens Resulting from Duplicator Operation
Estimates of body burdens resulting from first order
metabolism can be made using the following equation:
B^ = C^K/kg [l-exp(-k^t^)] + B^_^ exp(-k^tj^)
where, B^^ = Burden at end of nth exposure interval
(mg)Cyj = TWA exposure concentration during nth
interval (mg/m^)
K = Uptake rate constant (approximated at
0.83 m^/hr
assuming twice resting ventilation and 100^ absorption
kg = Elimination constant (0.231 hr~-^ for
methanol at doses less than 100
mg/kg (18)
tn = Duration of nth exposure interval
(hrs)
tjj = Duration of interval between
termination of n-1 interval and
termination of nth interval
Since methanol follows first order kinetics at body
burdens less than 100 mg/kg, this formula was used to
estimate peak body burdens of sampled workers. The results
are presented in Tables VI.I-VI.III.Exposure During Collating
Although the focus of this study was methanol exposure
during duplicator operation, exposures received during
collating may contribute significantly to overall exposure.
Personal sampling was conducted in such a way as to provide
anecdotal information on this type of exposure. A Gillian
FROM DUPLICATOR USE EXPOSURE Worker
(initials)
Exposure durations
(minutes)
BZ concentrations
(mg/m3)
P^ body burden
(mg)
EA 5 117 7.99
AA 3 537 22.17
SB 8 258 28.13
JD 3 556 2Z93
CH 2 14 0.40
WH 10 1229 166.80
AN 4 160 8.78
OP 2 312 8.60
JB 17 1320 300.38
BR 4 567 31.16
JS 5 110 7.54
AS 8 862 93.97
NT 4 128 7.05
AT 5 595 40.76
CT 12 402 65.27
JB 1 0 0.00
MB 38 620 303.11
AC 3 109 4.51
TJ 5 295 20.18
MK 9 400 48.96
FROM DUPLICATOR USE EXPOSURES
Worker
(initials)
Exposure Durations
(minutes)
BZ concentrations
(mg/m3)
Peak body burden
(mg)
PL 2 211 5.83
AM 5 204 14.00
BM 9 100 12.19
so 13 415 72.76
so 5 402 27.56
LW 10 263 35.68
AW 4 84 4.61
PA
5.5,6
193,309
30.54HC 2 318 0.78
LD 6 79 0.45
JH 4.5 176 10.84
ML 24 459 145.45
IM 2.5 164 5.64
BM
3,15,32,4.5
548,316,1043,294
490.07AO 1 326 440
AS
5,3
495,294,503
40.48IW
6,23
202,638
19431KA
15,13
-330,198 66.58BA 1.5 102 2.11
FROM DUPLICATOR USE EXPOSURES
WorkerCinitials)
Exposure Durations
(minutes)
BZ concentrations
(mg/m3)
Peak body burden
(mg)
SB 29 371 140.7?
MC 5 85 5.84
MC 14, 22. a 2 418,718,457,271 280.85
TH 9 287 35.12
FH 1.5,1 208,803 1221
KH 24 307 97.24
DM 10 507 68.82
DP 8,9 461,295 5a91
BP 18 461 110.96
MR a 4.5 519,693 47.91
TS 9 406 49.71
DW ^5,3.13 183,277,522 96.49
TW 2 190 5.24
AW 70,8 588.181 505.11
JW 5.24,4 180,480,292 177.03
KY a 3. 3 26,55.76 a65
DB 2 16 0.43
AG 44 1116 625.11
GQ 3 33 1.35
DR 2 62 1.70
JR 17 1029 234.16
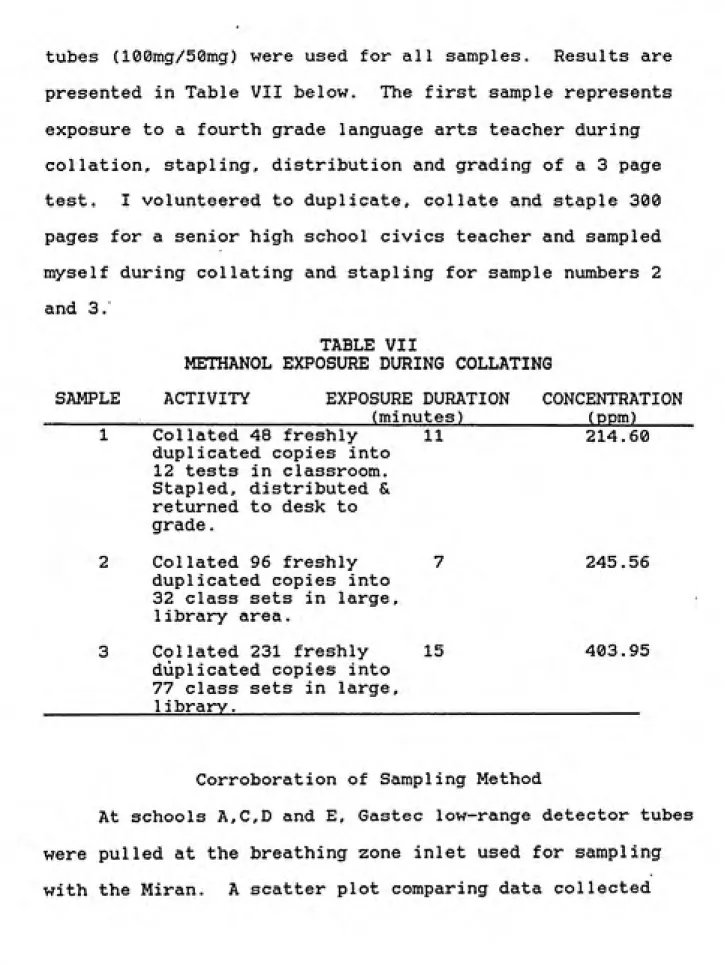
tubes (100mg/50mg) were used for all samples. Results are
presented in Table VII below. The first sample represents
exposure to a fourth grade language arts teacher during collation, stapling, distribution and grading of a 3 page test. I volunteered to duplicate, collate and staple 300 pages for a senior high school civics teacher and sampled myself during collating and stapling for sample numbers 2and 3.
TABLE VII
METHANOL EXPOSURE DURING COLLATING
SAMPLE ACTIVITY EXPOSURE DURATION CONCENTRATION ______________________________(minutes)____________(ppm)_____
1 Collated 48 freshly 11 214.60 duplicated copies into
12 tests in classroom. Stapled, distributed & returned to desk to
grade.
2 Collated 96 freshly 7 245.56 duplicated copies into
32 class sets in large, 1ibrary area.
3 Collated 231 freshly 15 403.95 duplicated copies into
77 class sets in large,
__________1 i brary._____________________________________
Corroboration of Sampling Method
At schools A,C,D and E, Gastec low-range detector tubes
were pulled at the breathing zone inlet used for sampling
using the Miran to data collected using detector tubes appears in Figure VI.
Personal samples were collected at schools B,C and D using a Gillian low-flow pump and large silica gel tubes
(100 mg/50 mg). This provided data, not only with which to verify the accuracy of the Miran, but also to utilize in comparing breathing zone sampling versus personal sampling. A representation of these results appears in Figure VII.
There was relatively close agreement between
measurements obtained using the Miran and those resulting from alternative sampling methods. The overall mean
difference between the Miran and both alternative sampling methods was very small. However, the standard deviation of the differences between Miran and personal sampling
measurements using silica gel media was large (160.99).
This is probably a reflection of the sensitivity of personal sampling to true exposure variability.
II. Questionnaire Results
Three hundred and thirty three questionnaires were distributed to all sampled schools. Table VIII presents distribution and response rates at each individual school.
One hundred and thirty-nine questionnaires were returned.
Of these, 20 respondents did not use the duplicator at all,
CORROBORATION OF MIRAN MEASUREMENTS
USING METHANOL DETECTOR TUBES
Detector Tubes
1.200
1.000
800
600
400
200
•B---'
::::--"^
Za-^" ''"
...g--S-*'...
ͤ
200 400 600 800 1,000
Miran Measurements
Detector Tubes Reference
Mean dnerence between mettndt: 17.11 ppm
CORROBORATION OF MIRAN MEASUREMENTS
USING PERSONAL SAMPLES COLLECTED ON SILICA GEL
Silica Gel
1,000
800
600
400
200
..."""*•'•••"...w
D
.^.^.
.
ͣ
•
ͣ
•
ͣͣ
-"...
ͣ
--^,-^-^-'...D...
»-«£'»!.-....-...__«...~...>...-...-...
D
J___________L
200 300-400 500 600 700 800 900
Miran Measurements
SicaGel Reference
Mean dfferenM betwMn methods: ai19 ppm
QUESTIONAIRE RESPONSE RATES
SCHOOL
NUMBER DISI ROUTED
NUMBER RblURNED
PERCENT RESPONSE
A
80
29
36
B
78
27
35
C
80
34
43
D
75
38
51
E
20
11
55
333 Questionaires Distributed,
55
questionnaires were thoroughly completed, therefore,
responses for particular questions usually do not add up to
119. Figure VIII provides a graphical representation of the
percentage of responses coming from each school. Because schools C and D had favorable response rates, 43% and 51% respectively, responses are somewhat weighted in favor ofthese schools. School E also had a high response rate
(55%), however, since the principal requested that only 20
questionnaires be distributed to targeted workers, responses
from this school made up only 10% of the entire set of
results.
Proximity To Duplicator During Operation As described in the experimental methods section,
sampling was conducted as near to the breathing zone of.
workers as possible. However, movement among workers in the
vicinity of the duplicator may have created some disparities between actual BZ concentrations and air concentrationscollected through stationary sampling inlets. In order to
assess the importance of this difference, workers were asked
to describe:1) the distance between themselves and the
duplicator when using the machines, and
2) the percentage of time spent standing adjacent
PERCENTAGE OF QUESTIONNAIRE RESPONSES FROM
DUPLICATOR USERS BY SCHOOL OF ORIGIN
B 16.0%
27.0%
it
Total nimber of respondents whkdi use the
8piiitciupfcalor = 119
A 18.0%
A bar graph of the distribution of responses to these questions is provided by Figure IX. Thirty-four percent selected 3" as the distance separating them from the duplicator during operation. This answer was closely •followed by 6", accounting for 32% of all answers to this
question. A clear majority of 82% reported standing
adjacent to the duplicator 100% of the time required to run copies. Therefore, placment of stationary sampling inlets adjacent to duplicators will result in measurements which adequately approximate BZ exposures.
Average Exposure Duration Per Day
When workers were asked to estimate the average time spent using the duplicator per day, 75 responses produced a
mean duration of 14.33 minutes with a standard deviation of
20.07 minutes and a median of 10.00 minutes. However, when
responses were separated by job classification, a marked difference between distribution parameters was apparent. The average exposure duration distribution described by
teachers appears in Figure X. Their answers indicate a mean exposure duration of 9.04 minutes per day with a standard deviation of 9.64 minutes and a median of 7 minutes. The distribution of exposure durations for teaching assistants produces a mean twice that of teachers at 18.00 minutes
PERCENTAGE OF TIME SPENT
ADJACENT TO DUPLICATOR DURING OPERATION
(number Of responses » 93)
Percent of time
29%
DISTANCE BETWEEN WORKER AND DUPUCATOR
OURINQ OPERATION
(numb«r of fnpontNB B 93)
Distance Cnches)
90%
79%
100%
0
8
6
>6
L-..1.,,..,, j . i .
-Ji 1 1 .1, 1___.20 40 eo
Frequency of responses
10 IS 2D 25 30
Frequency of response
Frequency
14
AVERAGE EXPOSURE DURATION PER DAY
_L ± I
a54.5 a5-1Z5 1&5-2a5 24.5-2a5 3a5-36.5 4a5^.5 4S.b^SL5 56.&^.5
4.M.5 125-1&5 2a5-24.5 2a&^3Z5 3ft5^5 44.&4a5 52.5^a5
Minutes
Number responding
39.00Mean (minutes)
ao4Standard Deviation
9.6460
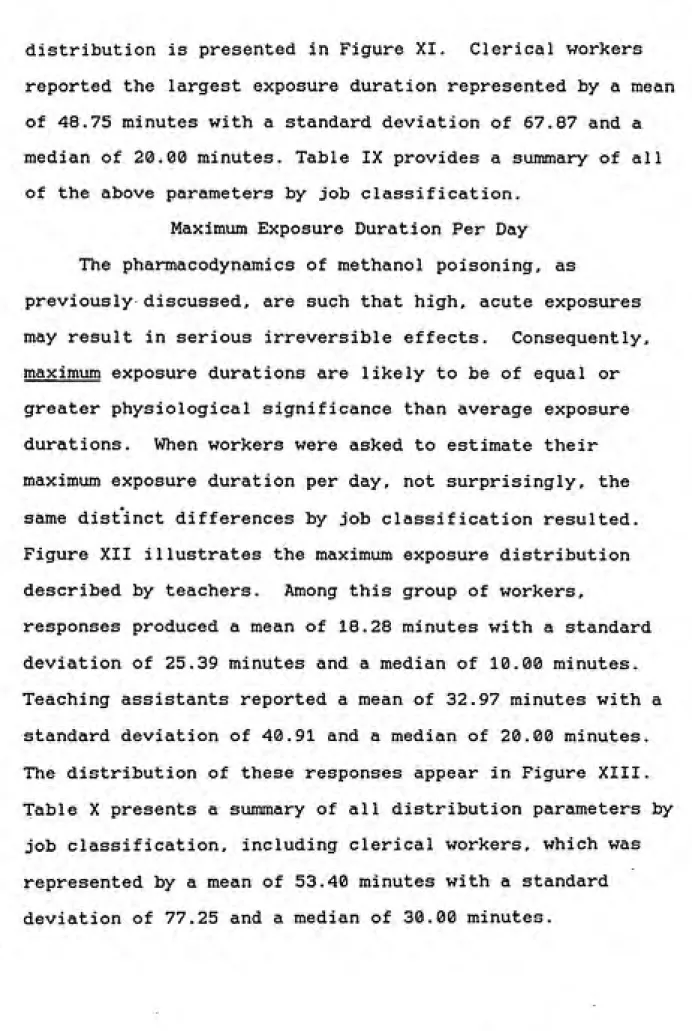
distribution is presented in Figure XI. Clerical workers reported the largest exposure duration represented by a mean of 48.75 minutes with a standard deviation of 67.87 and a
median of 20.00 minutes. Table IX provides a summary of all
of the above parameters by job classification.Maximum Exposure Duration Per Day
The pharmacodynamics of methanol poisoning, as
previously discussed, are such that high, acute exposures
may result in serious irreversible effects. Consequently,
maximum exposure durations are likely to be of equal or greater physiological significance than average exposure durations. When workers were asked to estimate theirmaximum exposure duration per day, not surprisingly, the
same distinct differences by job classification resulted.Figure XII illustrates the maximum exposure distribution
described by teachers. Among this group of workers,responses produced a mean of 18.28 minutes with a standard deviation of 25.39 minutes and a median of 10.00 minutes. Teaching assistants reported a mean of 32.97 minutes with a
standard deviation of 40.91 and a median of 20.00 minutes.
The distribution of these responses appear in Figure XIII. Table X presents a summary of all distribution parameters by
job classification, including clerical workers, which was
represented by a mean of 53.40 minutes with a standard
Frequency
8
a
4
-TEACHING ASSISTANTS
AVERAGE EXPOSURE DURATION PER DAY
-...
___________ '
^^
. i... A.,.,
...J.___ iHI 1
1
a&4.5 &5-1Z5 ia5-2a5 245-2a5 3Z&^5 40.5^5 4a5^5 5&5^.5
4.5^5 1Z5-1615 2a^2i5 2a5^5 d&5^5 44&4a5 525^5
Mimites
Number responding
29.00Mean (minutes)
18.00Standard Deviation
14.82AVERAGE EXPOSURE DURATION PER DAY
Teachiers
Teaching Assistants
Clerical Worlcers
**Total
Number Responding
39.00
29.00
4.00
75.00
Mean (minutes)
9.04
18.00
48.75
14.33
Standard Deviation
9.64
14.82
67.87
20.07
l\^edian (minutes)
7.00
14.00
20.00
10.00
*'niis includes respondents that use the
Frdquency
30
TEACHERS
± ± ±
0.5-8.5 16.5-24.5 32.5^.5 48.5^.5 64.572.5 80.5-88.5 96.5-104.5 112.5-120.5
8.5-16.5 24.5-32.5 40.5-48.5 56.5-64.5 72.5-80.5 88.5-96.5 104.5-112.5
Minutes
Workers were asked to descrSie the maximum
amount of time they sport usiig the dupBcalor
on a daly basis.
Number responding
47.00Mean
18.28Standard Deviation
23.59Frequency
12
MAXHIKIM EXPOSURE DURATION PER DAY AMONQ TEACHINQ ASSISTANTS
10
-I I
± ±
G5-125 24w&^5 48.5^5 72.5^.5 9a5-1(]&5 12a&^1325 1415-1Sa5 16a5-180.5
1Z5-24.5 3&&^5 ea5-7Z5 84.&«a5 108L5-12a5 13Z5-144wS 15&5-16&5
Minutes
Number respondrig
34.00Mean (minutes)
32.97Standard Deviation
4a9iMAXIMUM EXPOSURE DURATION PER DAY
Teachers
Teaching Assistants
Clerical Wortrers
**Totai
Number Responding
47.00 34.00 5.00 90.00l\fean (minutes)
18.28 32.97 53.40 25.08SlEuidard Deviation
23.59 40.91 77.25 35.77l\^lan (minutes)
10.00 20.00 30.00 15.00*ail respondents answering this question.
Daily Use Patterns
Since all sampling was conducted early in the week
(either Monday or Tuesday), it was necessary to evaluate any
bias introduced by excluding certain days of the week. With
this objective in mind, workers were asked if their use of
the duplicator followed any regular pattern throughout the
work week. Forty respondents (39%) answered that they did
follow a regular weekly pattern of use, while 63 (61%)
answered that they did not. Among pattern users, a large
interday variation was not seen, however, there was somewhat
heavier use of the duplicator on Monday. Figure XIV
presents average daily use among pattern users and Figure XV
presents the same information for individual schools. The
mean exposure duration among pattern users was 14.35
minutes.
Work Practices Related To Skin Exposure
Because methanol can penetrate the skin, an evaluation
of overall exposure to duplicator fluids would not be
complete without some consideration of skin exposures. In
addition to breathing methanol vapors, workers handle
methanol when transferring fluid from gallon fluid
containers to duplicator reservoirs. Skin exposure may
AVERAGE DAILY USE AMONG PAHERN USERS
Minutes
...^.jmamnm
:SSffft¥5f^5f::*Wfe5:
kVJVO».*.W.V.VA>'.WA'A-(, ,
^^^
ͣ
JMM.I .Wjiai .Mjli |f<JII|,Mjm yi
...
Days
MONDAY
ͣ
TUESDAY s
DaR/paltems nustraled above represent the
answers of 40 (39^ which said Iheiruse of the
dupScfltor Mtowed a daily pattern.
MINUTES
100
80
60
40
AVERAGE DAILY USE PAHERN BY
INDIVIDUAL SCHOOL
20
-iMiM
n<'fWv'«**''i*i'^vH
iAM&im\,mmii
;S«¥S¥S
MONDAY
TUESDAY WEDNESDAY THURSDAY
SCHOOL
FRIDAY