Sharif University of Technology
Scientia IranicaTransactions E: Industrial Engineering http://scientiairanica.sharif.edu
Ecient ratio-type estimators of nite population mean
based on correlation coecient
M. Irfan
a,b;, M. Javed
a,b, and Zh. Lin
aa. Department of Mathematics, Institute of Statistics, Zhejiang University, Hangzhou 310027, China. b. Department of Statistics, Government College University, Faisalabad, Pakistan.
Received 28 September 2016; received in revised form 4 February 2017; accepted 20 May 2017 KEYWORDS
Auxiliary variable; Bias;
Correlation coecient; Eciency;
Mean squared error; Ratio-type estimators.
Abstract. We proposed ecient families of ratio-type estimators to estimate nite population mean using known correlation coecient between study variable and auxiliary variable by adopting Singh and Tailor's [Singh, H.P., and Tailor, R. \Use of known correlation coecient in estimating the nite population means", Statistics in Transition, 6(4), pp. 555-560 (2003)] estimator and Kadilar and Cingi's [Kadilar, C., and Cingi, H. \An improvement in estimating the population mean by using the correlation coecient", Hacettepe Journal of Mathematics and Statistics, 35(1) pp. 103-109 (2006a)] class of estimators in simple random sampling without replacement. The newly proposed estimators behaved eciently as compared to the common unbiased estimator, traditional ratio estimator, and the other competing estimators. Bias, mean squared error, and minimum mean squared error of the proposed ratio-type estimators were derived. Moreover, theoretical ndings were proven with cooperation of two real data sets.
© 2018 Sharif University of Technology. All rights reserved.
1. Introduction
The ratio estimator suggested by Cochran [1] plays an important role in the scenario of positive (high) correlation among study and auxiliary variables. One of the hottest issues in the theory of sample survey is the estimation of nite population mean with dierent sampling techniques. Extensive work has been done on this issue using auxiliary information, such as pop-ulation median, mean, quartiles, deciles, coecient of variation, coecient of correlation, coecient of skew-ness, coecient of kurtosis, etc. Various estimators or classes of estimators have been proposed by several authors, including Sisodia and Dwivedi [2], Upadhyaya and Singh [3], Singh and Tailor [4], Kadilar and *. Corresponding author.
E-mail addresses: [email protected] (M. Irfan);
[email protected] (M. Javed); [email protected] (Zh. Lin) doi: 10.24200/sci.2017.4455
Cingi [5,6], Singh et al. [7,8], Gupta and Shabbir [9], Koyuncu and Kadilar [10,11], Yan and Tian [12], Haq and Shabbir [13], Singh and Solanki [14], Yadav and Kadilar [15], Subramani and Kumarapandiyan [16, 17], Subramani and Prabavathy [18], Yadav et al. [19], Khan et al. [20], Kumar [21], Irfan et al. [22], Walia et al. [23] etc., as solutions to this issue to get improved results.
Let \N" be the population size and \n" be the sample size such that n < N is drawn under simple random sampling without replacement (SRSWOR) scheme. Assume y and x are the study and auxiliary variables, respectively. Here, yi and xi represent the
values of y and x for the ith unit of the population. Some important formulae used in this manuscript are given as follows:
Population mean of study variable:
Y = N 1XN i=1yi:
Population mean of auxiliary variable:
X = N 1XN i=1
xi:
Sample mean of study variable: y = n 1Xn
i=1
yi:
Sample mean of auxiliary variable: x = n 1Xn
i=1
xi:
Sampling fraction: f =Nn:
Ratio of population mean of study variable to popula-tion mean of auxiliary variable:
R = XY: Constant term:
=
1 n
1 N
:
Relative error terms and their expectations have been dened in order to get the bias, Mean Squared Error (MSE), and minimum MSE for the existing and proposed ratio-type estimators in this way.
Let 0= y YY and 1= x XX such that E(i) = 0
for i = 0 and 1, where E(:) represents the mathematical expectation and:
E(2 0) =
S2 y
Y2; E(21) = S 2 x
X2; E(01) =
Syx
Y X; where:
S2
y = (N 1) 1 N
X
i=1
(yi Y ) 2;
S2
x= (N 1) 1 N
X
i=1
(xi X) 2;
Syx= (N 1) 1 N
X
i=1
(yi Y )(x i X):
The motivation behind this manuscript is to develop new ecient families of ratio-type estimators to esti-mate population mean using SRSWOR scheme with the help of known correlation coecient between study variable and auxiliary variable. In the following,
some well-known traditional and existing estimators in SRSWOR are provided.
Commonly used unbiased estimator of Y is:
^Y = y: (1)
Estimator in Eq. (1) has the following mean squared error or variance:
MSE( ^Y ) = V ( ^Y ) = S2
y: (2)
The traditional ratio estimator of population mean suggested by Cochran [1] is dened as:
^YR= y Xx
; x 6= 0: (3)
Bias and MSE of ^YR up to the rst degree of
approxi-mation are, respectively, given as:
Bias ( ^YR) Y Cx2 yxCyCx; (4)
and:
MSE ( ^YR) Y2Cy2+ Cx2(1 2')
; (5)
where: ' = yxCCy
x; Cy=
Sy
Y ;
Cx= SXx; yx = (SySx) 1Syx:
Given below is the introduction of some other compet-ing ratio-type estimators that take known correlation coecient between study and auxiliary variables into account.
1.1. Singh and tailor estimator
In order to estimate nite population mean, Singh and Tailor [4] proposed ratio estimator by utilizing the known correlation coecient yx:
^YST = y X + x + yx yx
: (6)
Bias and MSE up to the rst order of approximation of ^YST in Eq. (6) are given by:
Bias ( ^YST) Y Cx2 yxCyCx; (7)
and:
MSE( ^YST) Y2Cy2+ Cx2( 2')
; (8)
where:
= X
1.2. Kadilar and Cingi estimators
Kadilar and Cingi [24] proposed a class of ratio estima-tors to estimate population mean under SRSWOR in the light of the work done by Upadhyaya and Singh [3] and Singh and Tailor [4]. Their proposed class of estimators is:
^YKC1= y XCxCx+ yx x+ yx
; (9)
^YKC2= y Xxyx+ Cx yx+ Cx
; (10)
^YKC3= y Xx2(x) + yx 2(x) + yx
; (11)
^YKC4= y Xxyx+ 2(x) yx+ 2(x)
; (12)
where yx, Cx, and 2(x) are the correlation coecient
between study and auxiliary variables, coecient of variation, and coecient of kurtosis of the auxiliary variable, respectively.
Bias and MSE of the above-mentioned estimators in Eqs. (9) to (12) are listed below:
Bias ( ^YKCi) Y Cx2i(i '); i = 1; 2; 3; 4: (13)
and:
MSE ( ^YKCi) Y2Cy2+ Cx2i(i 2');
i = 1; 2; 3; 4; (14)
where: 1=
XCx
XCx+ yx; 2=
Xyx
Xyx+ Cx;
3=
X2(x)
X2(x) + yx; 4=
Xyx
Xyx+ 2(x):
Kadilar and Cingi [25] dened another class of ratio-type estimators as:
^Y KCi=
y + b( X x)i; i = 1; 2; 3; 4; 5; (15)
where: 1=
X + yx
x + yx; 2=
XCx+ yx
xCx+ yx;
3=
Xyx+ Cx
xyx+ Cx; 4=
X2(x) + yx
x2(x) + yx ;
5=
Xyx+ 2(x)
xyx+ 2(x):
The following are the expressions for bias and MSE of
the ^Y
KCi estimators:
Bias ( ^Y
KCi) Y Cx2i2; i = 1; 2; 3; 4; 5; (16)
and: MSE ( ^Y
KCi) Y2
h
i2Cx2+ Cy2(1 2yx)
i ;
i = 1; 2; 3; 4; 5; (17)
where:
1=
X
X + yx;
2=
XCx
XCx+ yx;
3=
Xyx
Xyx+ Cx;
4=
X2(x)
X2(x) + yx;
5=
Xyx
Xyx+ 2(x):
2. Proposed families of ratio-type estimators Inspired by Singh and Tailor [4] and Kadilar and Cingi [24,25], we propose ecient families of ratio-type estimators, i.e., ( ^YP i, i.e., i = 1; 3; 5; :::; 11) and
( ^YP j, i.e., j = 2; 4; 6; :::; 16), to estimate population
mean using the correlation coecient between study and auxiliary variables under SRSWOR scheme. 2.1. The rst proposed family of ratio-type
estimators ^YP 1= ky XCxCx+ yx
x+ yx
XCx
XCx+yx
; (18)
^YP 3= ky Xx2(x) + yx 2(x) + yx
X2(x)
X2(x)+yx
; (19)
^YP 5= ky Xx2(x) + yxCx 2(x) + yxCx
X2(x)
X2(x)+yxCx
; (20)
^YP 7= ky Xxyx2(x) + Cx yx2(x) + Cx
Xyx2(x)
Xyx2(x)+Cx
; (21)
^YP 9= ky X + x + yx yx
X
X+yx
; (22)
^YP 11= ky XCxCx2(x) + yx x2(x) + yx
XCx2(x)
XCx2(x)+yx
; (23)
where k is the selected appropriate constant whose value is determined later in Theorem 2.1 and X pop-ulation mean, Cx population coecient of variation,
yxpopulation correlation coecient, and 2(x)
Theorem 2.1
The properties of ^YP i, i.e., i = 1; 3; 5; :::; 11 are:
1) Bias ( ^YP i) Y (k 1)
+ Y k
1
2( i4+ i3)Cx2 2iyxCyCx
; (24) 2) MSE ( ^YP i) Y2
A1i
A2i 1
2
+
A1i
A2i
2
E(2 0)
+ (2 4
i + 3i)E(12) 4 2iE(01)
A1i
A2i ( 4
i + 3i)E(12) 2 2iE(01); (25)
3) MSEmin( ^YP i) Y2
1 A21i
2A2i
; (26)
where:
1=
XCx
XCx+ yx; 3=
X2(x)
X2(x) + yx; 5=
X2(x)
X2(x) + yxCx; 7=
Xyx2(x)
Xyx2(x) + Cx; 9=
X
X + yx; 11=
XCx2(x)
XCx2(x) + yx:
Proof
To prove Eqs. (24)-(26), the proposed family of ratio-type estimators ( ^YP i, i.e., i = 1; 3; 5; :::; 11) can be
written in terms of 0 is as:
^YP i = k Y (1 + 0)[1 + i1] i; (27)
or:
^YP i = k Y (1 + 0)
1 2
i1+12 3i( i+ 1)21
: (28) Simplifying the R.H.S. of Eq. (28) up to the rst degree of approximation and, then, subtracting Y from both sides, we get:
^YP i Y = Y
k + k0 k 2i1+21k( i4+ 3i)12
k 2
i01 1
: (29)
Bias and the MSE of the proposed family of ratio-type estimators ( ^YP i, i.e., i = 1; 3; 5; :::; 11) are, respectively,
given as:
Bias( ^YP i) =E( ^YP i Y ) Y (k 1)
+ Y k
1
2( 4i+ 3i)Cx2 i2yxCyCx
; (30) and:
MSE( ^YP i) = ( ^YP i Y ) 2 Y2
(k 1)2
+ k2E(2
0) + (2 i4+ i3)E(21)
4 2
iE(01)
k
( 4
i + i3)E(12)
2 2
iE(01)
: (31)
To get the optimal value of k, dierentiating Eq. (31) with respect to k and equating to zero, we have:
k = 2 + ( 4i + 3i)E(12) 2 2iE(01)
2 + 2 [E(2
0) + (2 i4+ 3i)E(12) 4 i2E(01)];
k = 1 +2
( 4
i + 3i)Cx2 2 2iyxCyCx
1 + C2
y+ (2 i4+ 3i)Cx2 4 2iyxCyCx;
k = A1i A2i;
where:
A1i= 1 +2( 4i + i3)Cx2 2 i2yxCyCx;
and:
A2i= 1 + Cy2+ (2 i4+ 3i)Cx2 4 2iyxCyCx:
Putting the optimal values of k in Relation (31), we have MSE as:
MSE( ^YP i) Y2
A1i
A2i 1
2 +
A1i
A2i
2 E(2
0)
+ (2 4
i + i3)E(21) 4 i2E(01)
A1i
A2i ( 4
i + 3i)E(21) 2 i2E(01): (32)
Simplifying Relation (32), we have the minimum MSE of the proposed ratio-type estimators:
MSEmin( ^YP i) Y2
1 A21i
2A2i
2.2. Second proposed family of ratio-type estimators
^YP 2= t
2
4y Xyx+ R
xyx+ R
Xyx
Xyx+R
+ b( X x) 3 5 ; (34) ^YP 4= t
y Xxyx+ RCx
yx+ RCx
Xyx
Xyx+RCx
+b( X x)
; (35) ^YP 6=t
y Xxyx+ R2(x)
yx+ R2(x)
Xyx
Xyx+R2(x)
+ b( X x)
; (36)
^YP 8=t
y Xxyx+ RCx2(x)
yx+ RCx2(x)
Xyx
Xyx+RCx2(x)
+ b( X x)
; (37)
^YP 10= t
2
4y X + Ryx
x + Ryx
X
X+Ryx
+ b( X x) 3 5 ; (38) ^YP 12= t
y X + RyxCx x + RyxCx
X
X+RyxCx
+b( X x)
; (39) ^YP 14=t
y X + Rx + Ryx2(x)
yx2(x)
X
X+Ryx2(x)
+ b( X x)
; (40)
^YP 16=t
y X + Rx + RyxCx2(x)
yxCx2(x)
X
X+RyxCx2(x)
+ b( X x)
; (41)
where t is the unknown constant, which is to be determined later on, and X, Cx, yx, and 2(x) are
the known population parameters. Theorem 2.2
The properties of ^YP j, i.e., j = 2; 4; 6; :::; 16, are:
1) Bias( ^YP j) Y (t 1)
+ Y t
1
2('4j+ '3j)Cx2 '2jyxCyCx
; (42)
2) MSE( ^YP j)
A3j A4j Y Y 2 + A3j A4j 2 Y2E(2
1) +
2'4
jY2+ b2X2
+ '3
jY2+ 2'2jb Y X
E(2
1)
4'2
jY2
+ 2b Y X
E(01)
A3j
A4j
'4
jY2
+ '3 jY2
E(2
1) 2'2jY2E(01)
: (43)
3) MSEmin( ^YP j)
"
Y2 A23j
2A4j
#
; (44)
where: '2=
Xyx
Xyx+ R; '4=
Xyx
Xyx+ RCx;
'6=
Xyx
Xyx+ R2(x); '8=
Xyx
Xyx+ RCx2(x);
'10=
X
X + Ryx; '12=
X
X + RyxCx;
'14=
X
X + Ryx2(x); '16=
X
X + RyxCx2(x):
Proof
To prove Relations (42) to (44), the proposed estima-tors ( ^YP j, i.e., j = 2; 4; 6; :::; 16) may be written in
terms of 0
is as follows:
^YP j= t( Y + Y 0)(1 + 'j1) 'j b X1;
or: ^YP j= t
( Y + Y 0)
1 '2
j1+12'3j('j+ 1)12
b X1
; (45)
where: b = yxSy
Sx :
Subtracting Y from Eq. (45) and expanding it up to the rst degree of approximation, we obtain:
^YP j Y =
t Y + t Y 0 t Y '2j1 tb X1
+12t Y ('4
j+'3j)12 t Y '2j01 Y
: (46)
The bias and the MSE of ^YP j; i.e., j = 2; 4; 6; :::; 16, up
to the rst degree of approximation are given as: Bias ( ^YP j) Y (t 1) + Y t
1
2('4j+ '3j)Cx2
'2
jyxCyCx
; (47)
MSE( ^YP j)
(t Y Y ) 2+ t2Y2E(2 0)
+
2'4
jY2+ b2X2+ '3jY2+ 2'2jb Y X
E(2
1)
4'2
jY2+ 2b Y X E(01)
t'4
jY2+'3jY2 E(12) 2'2jY2E(01)
: (48) Dierentiating Eq. (48) with respect to t and equating to zero, we have t as shown in Box I, where:
A3j= Y2+2('4j+ '3j)R2Sx2 2'2jRSyx;
and:
A4j= Y2+
S2
y+
2'4
jR2+ b2+ '3jR2
+ 2'2 jbR
S2
x f4'2jR + 2bgSyx
: Inserting the value of t in Eq. (48), we obtain:
MSE( ^YP j)
A3j
A4j
Y Y
2
+
A3j
A4j
2
Y2E(2
0)
+2'4
jY2+ b2X2+ '3jY2+ 2'2jb Y X E(21)
4'2
jY2+ 2b Y X E(01)
A3j
A4j
'4
jY2+'3jY2E(12) 2'2jY2E(01)
: (49) Thus, the minimum MSE is as follows:
MSEmin( ^YP j)
"
Y2 A23j
2A4j
#
: (50)
Interesting note
Many more ratio-type estimators based on correlation coecient can be formulated by taking dierent mea-sures of i and 'j.
3. Eciency of the proposed estimators
This section deals with the derivation of algebraic sit-uations under which the proposed estimators will have minimum MSE as compared to unbiased estimator (sample mean), traditional ratio estimator, Singh and Tailor's [4] estimator, and Kadilar and Cingi's [24,25] classes of estimators.
Theorem 3.1
1. ^YP i (i.e., i = 1; 3; 5; :::; 11) perform better than ^Y
if: C2
y+ A 2 1i
2A2i
> 1: (51)
2. ^YP j (i.e., j = 2; 4; 6; :::; 16) perform better than ^Y
if:" C2
y+
A2 3j
2 Y2A4j
#
> 1: (52)
Proof
1. By comparing Relations (2) and (33): MSEmin( ^YP i) < MSE( ^Y );
Y21 A21i
2A2i
< S2
y;
t = 2 Y2+ f'4jY2+ '3jY2gE(12) 2'2jY2E(01) 2 Y2+ 2 Y2E(2
0) +
2'4
jY2+ b2X2+ '3jY2+ 2'2jb Y X E(12)
4'2
jY2+ 2b Y X E(01);
t = Y2+2
('4
j+ '3j)R2Sx2 2'2jRSyx
Y2+ S2 y+
2'4
jR2+ b2+ '3jR2+ 2'2jbR S2x
4'2
jR + 2b Syx;
t = A3j A4j;
C2
y+ A 2 1i
2A2i
> 1:
2. By comparing Relations (2) and (50): MSEmin( ^YP j) < MSE( ^Y );
"
Y2 A23j
2A4j
# < S2
y;
" C2
y+
A2 3j
2 Y2A4j
# > 1: Theorem 3.2
1. ^YP i (i.e., i = 1; 3; 5; :::; 11) perform better than
traditional ratio estimator, ^YR, if:
C2
y+ Cx2(1 2')
+ A21i
2A2i > 1: (53)
2. ^YP j (i.e., j = 2; 4; 6; :::; 16) perform better than
traditional ratio estimator, ^YR, if:
C2
y+ Cx2(1 2')
+ A23j
2 Y2A4j > 1: (54)
Proof
1. By comparing Relations (5) and (33): MSEmin( ^YP i) < MSE( ^YR);
Y21 A21i
2A2i
< Y2C2
y+ Cx2(1 2')
; C2
y+ Cx2(1 2')
+ A21i
2A2i > 1: 2. By comparing Relations (5) and (50):
MSEmin( ^YP j) < MSE( ^YR);
"
Y2 A23j
2A4j
#
< Y2C2
y+ Cx2(1 2')
; C2
y+ Cx2(1 2')
+2 YA223jA
4j > 1:
Theorem 3.3
1. ^YP i (i.e., i = 1; 3; 5; :::; 11) perform better than
Singh and Tailor's [4] estimator, ^YST, if:
C2
y+ Cx2( 2')
+ A21i
2A2i > 1: (55) 2. ^YP j (i.e., j = 2; 4; 6; :::; 16) perform better than
Singh and Tailor's [4] estimator, ^YST, if:
C2
y+ Cx2( 2')
+ A23j
2 Y2A4j > 1: (56)
Proof
1. By comparing Relations (8) and (33): MSEmin( ^YP i) < MSE( ^YST);
Y21 A21i
2A2i
< Y2C2
y+ Cx2( 2')
; C2
y+ Cx2( 2')
+ A21i
2A2i > 1: 2. By comparing Relations (8) and (50):
MSEmin( ^YP j) < MSE( ^YST);
"
Y2 A23j
2A4j
#
< Y2C2
y+ Cx2( 2')
; C2
y+ Cx2( 2')
+ A23j 2 Y2A4j > 1:
Theorem 3.4
1. ^YP i (i.e., i = 1; 3; 5; :::; 11) perform better than
Kadilar and Cingi's [24] estimators, ^YKCi, if:
C2
y+ Cx2i(i 2')+ A 2 1i
2A2i > 1: (57) 2. ^YP j (i.e., j = 2; 4; 6; :::; 16) perform better than
Kadilar and Cingi's [24] estimators, ^YKCi, if:
C2
y+ Cx2i(i 2')+ A 2 3j
2 Y2A4j > 1: (58)
Proof
1. By comparing Relations (14) and (33): MSEmin( ^YP i) < MSE( ^YKCi);
Y21 A21i
2A2i
< Y2C2
y+ Cx2i(i 2');
C2
y+ Cx2i(i 2')+ A 2 1i
2A2i > 1: 2. By comparing Relations (14) and (50):
MSEmin( ^YP j) < MSE( ^YKCi);
"
Y2 A23j
2A4j
#
< Y2C2
y+ Cx2i(i 2');
C2
y+ Cx2i(i 2')+ A 2 3j
Theorem 3.5
1. ^YP i (i.e., i = 1; 3; 5; :::; 11) perform better than
Kadilar and Cingi's [25] estimators, ^Y KCi, if:
h
i2Cx2+ Cy2(1 2yx)
i + A21i
2A2i > 1: (59) 2. ^YP j (i.e., j = 2; 4; 6; :::; 16) perform better than
Kadilar and Cingi's [25] estimators, ^Y KCi, if:
h
i2Cx2+ Cy2(1 2yx)
i
+2 YA223jA
4j > 1: (60)
Proof
1. By comparing Relations (17) and (33): MSEmin( ^YP i) < MSE( ^YKCi );
Y21 A21i
2A2i
< Y2h
i2Cx2+ Cy2(1 2yx)
i ; h
i2Cx2+ Cy2(1 2yx)
i + A21i
2A2i > 1: 2. By comparing Relations (17) and (50):
MSEmin( ^YP j) < MSE( ^YKCi );
"
Y2 A23j
2A4j
#
< Y2h
i2Cx2+ Cy2(1 2yx)
i ; h
i2Cx2+ Cy2(1 2yx)
i
+2 YA223jA
4j > 1:
4. Empirical study
This section evaluates the performance of the proposed families of ratio-type estimators, i.e., ( ^YP i i.e., i =
1; 3; 5; :::; 11) and ( ^YP j i.e., j = 2; 4; 6; :::; 16), with
competitive estimators. For this purpose, we consider two natural populations described below.
Population 1 (source: Kadilar and Cingi [24]): The data relates to 104 villages of East Anatolia Region of Turkey in 1999. The following variables are taken into consideration:
y The level of apple production (in 1000 tones);
x The number of apple trees.
Values of dierent required parameters are: N = 104, n = 20, yx = 0:865, Y = 625:37, X = 13:931, Cy =
1:866, Cx= 1:653, and 2(x) = 17:52.
Population 2 (source: Murthy [26]): The variables are dened as follows: y The output for 80 factories; x The number of workers.
Values of dierent required parameters are: N = 80, n = 20, yx = 0:9150, Y = 51:8264, X = 2:8513,
Cy= 0:3542, Cx= 0:9484, Sy= 18:3569, Sx= 2:7042,
and 2(x) = 1:3005.
Consider the MSE given in Section 1 and derived in Section 2; the values for existing and proposed families of estimators are computed and placed in Tables 1 and 2. The following are some important ndings observed in Tables 1 and 2:
It is important to note that the traditional ratio estimator is more ecient than the suggested class of estimators by Kadilar and Cingi [25], i.e., ^Y
KC1,
^Y
KC2, ^YKC3 , ^YKC4 , and ^YKC5 , for both real
popu-lations discussed in this manuscript;
It can be concluded that proposed families of ratio-type estimators are more ecient as they have lesser values of MSE as compared to the usual unbiased es-timator, traditional ratio eses-timator, Singh and Tai-lor's [4] estimator, and Kadilar and Cingi's [24,25] classes of estimators;
It is perceived in both populations that the two proposed estimators ^YP 11 and ^YP 6 have the least
Table 1. MSEs of the competing estimators for Population 1.
Estimators MSE Estimators MSE Estimators MSE Estimators MSE
^Y 54993.750 ^Y
KC1 52102.800 ^YP 5 13335.710 ^YP 8 13372.840
^YR 13869.960 ^YKC2 53933.140 ^YP 7 13341.230 ^YP 10 13718.360
^YST 13898.700 ^YKC3 47217.400 ^YP 9 13847.380 ^YP 12 13489.420
^YKC1 13852.970 ^YKC4 56697.220 ^YP 11 13328.150 ^YP 14 13373.720
^YKC2 14252.910 ^YKC5 21012.160 ^YP 2 13556.390 ^YP 16 13373.020
^YKC3 13863.330 ^YP 1 13540.760 ^YP 4 13436.650
^YKC4 27816.360 ^YP 3 13330.560 ^YP 6 13373.240 Bold value indicates minimum MSE.
Table 2. MSEs of the competing estimators for Population 2.
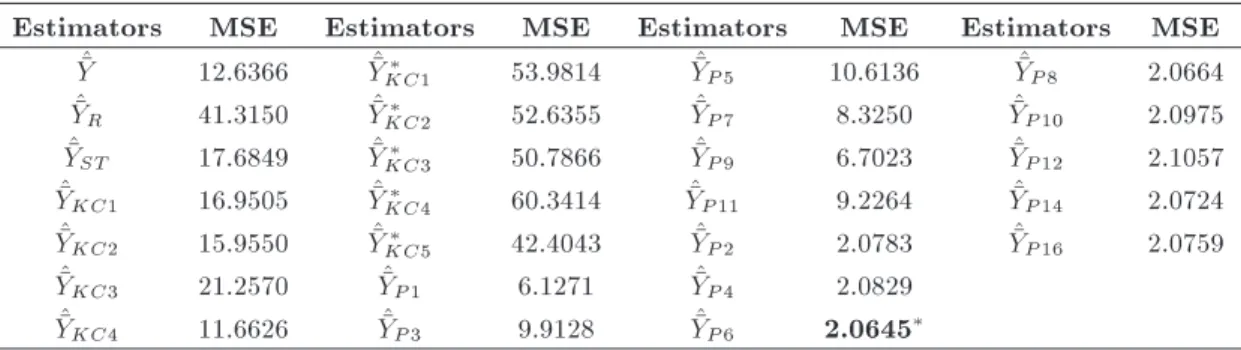
Estimators MSE Estimators MSE Estimators MSE Estimators MSE
^Y 12.6366 ^Y
KC1 53.9814 ^YP 5 10.6136 ^YP 8 2.0664
^YR 41.3150 ^YKC2 52.6355 ^YP 7 8.3250 ^YP 10 2.0975
^YST 17.6849 ^YKC3 50.7866 ^YP 9 6.7023 ^YP 12 2.1057
^YKC1 16.9505 ^YKC4 60.3414 ^YP 11 9.2264 ^YP 14 2.0724
^YKC2 15.9550 ^YKC5 42.4043 ^YP 2 2.0783 ^YP 16 2.0759
^YKC3 21.2570 ^YP 1 6.1271 ^YP 4 2.0829
^YKC4 11.6626 ^YP 3 9.9128 ^YP 6 2.0645 Bold value indicates minimum MSE.
Table 3. PREs of the competing estimators for Population 1.
Proposed Existing estimators
estimators Y^ Y^R Y^ST Y^KC1 Y^KC2 Y^KC3 Y^KC4 Y^KC1 Y^KC2 Y^KC3 Y^KC4 Y^KC5
^
YP 1 406.1349 102.4312 102.6434 102.3057 105.2593 102.3822 20 5.4269 384.7849 398.3022 348.7057 418.7152 155.1771
^
YP 3 412.5389 104.0463 104.2619 103.9189 106.9191 103.9966 208.6661 390.8523 404.5827 354.2042 425.3176 157.6240
^
YP 5 412.3796 104.0062 104.2217 103.8788 106.8778 103.9564 208.5855 390.7014 404.4265 354.0674 425.1534 157.5631
^
YP 7 412.2090 103.9631 104.1786 103.8358 106.8336 103.9134 208.4992 390.5397 404.2591 353.9209 424.9775 157.4979
^
YP 9 397.1419 100.1631 100.3706 100.0404 102.9286 100.1152 200.8781 376.2647 389.4826 340.9844 409.4437 151.7411
^
YP 11 412.6135 104.0652 104.2808 103.9377 106.9384 104.0154 208.7038 390.9230 404.6559 354.2682 425.3945 157.6525
^
YP 2 405.6666 102.3131 102.5251 102.1878 105.1379 102.2642 205.1900 384.3413 397.8429 348.3036 418.2324 154.9982
^
YP 4 409.2817 103.2248 103.4387 103.0984 106.0749 103.1755 207.0186 387.7663 401.3883 351.4075 421.9595 156.3795
^
YP 6 411.2223 103.7143 103.9292 103.5872 106.5778 103.6647 208.0002 389.6049 403.2915 353.0738 423.9602 157.1209
^
YP 8 411.2346 103.7174 103.9323 103.5903 106.5810 103.6678 208.0064 389.6166 403.3036 353.0843 423.9729 157.1256
^
YP 10 400.8770 101.1051 101.3146 100.9812 103.8966 101.0568 202.7674 379.8034 393.1457 344.1913 413.2944 153.1682
^
YP 12 407.6806 102.8210 103.0341 102.6951 105.6599 102.7719 206.2087 386.2494 399.8181 350.0328 420.3088 155.7677
^
YP 14 411.2076 103.7106 103.9255 103.5835 106.5740 103.6610 207.9927 389.5909 403.2770 353.0611 423.9450 157.1153
^
YP 16 411.2291 103.7160 103.9309 103.5889 106.5796 103.6664 208.0036 389.6113 403.2981 353.0796 423.9672 157.1235
MSE values (13328.150 and 2.0645) among all the proposed estimators;
It is interesting to note that the Kadilar and Cingi's [24] estimators, ^YKC1 and ^YKC3, are the
special cases of the proposed estimators, ^YP 1 and
^YP 3. When we put the values of k = 1 and i= 1,
where i = 1 and 2, in ^YP 1and ^YP 3, these estimators
give the same result as the estimators ^YKC1 and
^YKC3.
This study calculated the Percentage Relative Eciencies (PREs) for both populations under con-sideration to prove the dominance of the proposed families of ratio-type estimators, i.e., ( ^YP i, i.e., i =
1; 3; 5; :::; 11) and ( ^YP j, i.e., j = 2; 4; 6; :::; 16), over
the existing estimators, i.e., ^Y , ^YR, ^YST, ^YKC1, ^YKC2,
^YKC3, ^YKC4, ^YKC1 , ^YKC2 , ^YKC3 , ^YKC4 , and ^YKC5 .
Here, the Percentage Relative Eciency (PRE) is the ratio of MSE of the existing estimators (e) to the MSE of the proposed ratio-type estimators (p) and is given by:
PRE(e; p) = MSE(e)
MSE(p) 100: (61)
Tables 3 and 4 provide the PREs calculated for both populations. It is revealed in Tables 3 and 4 that the proposed families of ratio-type estimators are more competent than the existing estimators for both popu-lations as they have higher values.
To get deeper insight, another important tool, i.e., Relative Root Mean Square Error (RRMSE), is computed in this study. It is the most useful measure to compare the precision of the estimators (see, e.g., [12,22,27,28]). The RRMSE of an estimator can be calculated by the relation given below:
RRMSE = q
MSE( ^)
; (62)
where MSE may be dened as: MSE( ^) = n1 Xn
i=1
( ^ )2; (63)
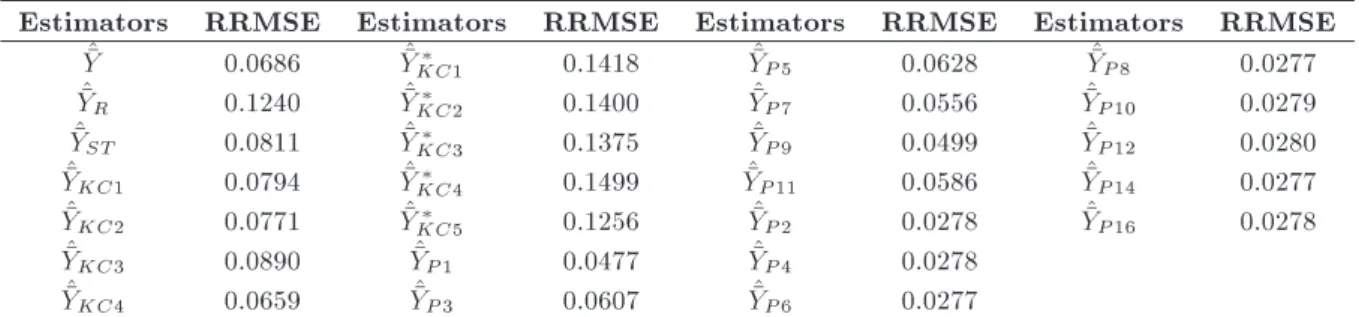
where ^ is the estimate of on the ith sample. It is quite obvious from the values of RRMSE shown in Tables 5 and 6 that the proposed families of ratio-type estimators perform better than the existing ones discussed in this article.
Table 4. PREs of the competing estimators for Population 2.
Proposed Existing estimators
estimators Y^ Y^R Y^ST Y^KC1 Y^KC2 Y^KC3 Y^KC4 Y^KC1 Y^KC2 Y^KC3 Y^KC4 Y^KC5
^
YP 1 206.2411 674.2994 288.6341 276.6480 260.4005 346.9341 19 0.3445 881.0269 859.0606 828.8848 984.8281 692.0778
^
YP 3 127.4776 416.7844 178.4047 170.9961 160.9535 214.4399 117.6519 544.5626 530.9852 512.3335 608.7221 427.7732
^
YP 5 119.0605 389.2647 166.6249 159.7055 150.3260 200.2808 109.8835 508.6059 495.9250 478.5049 568.5291 399.5280
^
YP 7 151.7910 496.2763 212.4312 203.6096 191.6517 255.3393 140.0913 648.4252 632.2583 610.0492 724.8216 509.3610
^
YP 9 188.5412 616.4302 263.8632 252.9057 238.0526 317.1598 174.0089 805.4161 785.3349 757.7488 900.3088 632.6828
^
YP 11 136.9613 447.7911 191.6771 183.7174 172.9277 230.3932 126.4047 585.0754 570.4879 550.4487 654.0081 459.5975
^
YP 2 608.0258 1987.9228 850.9310 815.5945 767.6948 1022.8071 561.1606 2597.3825 2532.6228 2443.6607 2903.4018 2040.3359
^
YP 4 606.6830 1983.5326 849.0518 813.7933 765.9993 1020.5483 559.9213 2591.6463 2527.0296 2438.2640 2896.9898 2035.8299
^
YP 6 612.0901 2001.2109 856.6190 821.0463 772.8264 1029.6440 564.9116 2614.7445 2549.5519 2459.9952 2922.8094 2053.9743
^
YP 8 611.5273 1999.3709 855.8314 820.2913 772.1158 1028.6973 564.3922 2612.3403 2547.2077 2457.7333 2920.1220 2052.0858
^
YP 10 602.4601 1969.7259 843.1418 808.1287 760.6675 1013.4446 556.0238 2573.6067 2509.4398 2421.2920 2876.8248 2021.6591
^
YP 12 600.1140 1962.0554 839.8585 804.9817 757.7053 1009.4980 553.8586 2563.5846 2499.6676 2411.8630 2865.6219 2013.7864
^
YP 14 609.7568 1993.5823 853.3536 817.9164 769.8803 1025.7190 562.7582 2604.7771 2539.8330 2450.6176 2911.6676 2046.1446
^
YP 16 608.7287 1990.2211 851.9148 816.5374 768.5823 1023.9896 561.8093 2600.3854 2535.5508 2446.4859 2906.7585 2042.6947
Table 5. RRMSEs of the competing estimators for Population 1.
Estimators RRMSE Estimators RRMSE Estimators RRMSE Estimators RRMSE
^Y 0.3750 ^Y
KC1 0.3650 ^YP 5 0.1846 ^YP 8 0.1849
^YR 0.1883 ^YKC2 0.3714 ^YP 7 0.1847 ^YP 10 0.1872
^YST 0.1885 ^YKC3 0.3475 ^YP 9 0.1881 ^YP 12 0.1857
^YKC1 0.1882 ^YKC4 0.3808 ^YP 11 0.1846 ^YP 14 0.1849
^YKC2 0.1909 ^YKC5 0.2318 ^YP 2 0.1861 ^YP 16 0.1849
^YKC3 0.1883 ^YP 1 0.1860 ^YP 4 0.1853
^YKC4 0.2667 ^YP 3 0.1846 ^YP 6 0.1849
Table 6. RRMSEs of the competing estimators for Population 2.
Estimators RRMSE Estimators RRMSE Estimators RRMSE Estimators RRMSE
^Y 0.0686 ^Y
KC1 0.1418 ^YP 5 0.0628 ^YP 8 0.0277
^YR 0.1240 ^YKC2 0.1400 ^YP 7 0.0556 ^YP 10 0.0279
^YST 0.0811 ^YKC3 0.1375 ^YP 9 0.0499 ^YP 12 0.0280
^YKC1 0.0794 ^YKC4 0.1499 ^YP 11 0.0586 ^YP 14 0.0277
^YKC2 0.0771 ^YKC5 0.1256 ^YP 2 0.0278 ^YP 16 0.0278
^YKC3 0.0890 ^YP 1 0.0477 ^YP 4 0.0278
^YKC4 0.0659 ^YP 3 0.0607 ^YP 6 0.0277
5. Conclusion
In this article, we proposed improved families of ratio-type estimators of population mean under simple random sampling without replacement (SRSWOR) scheme using correlation coecient between study and auxiliary variables. We obtained bias, Mean Square Error (MSE), and minimum MSE formulae of the pro-posed families of ratio-type estimators and compared them theoretically with those of the traditional and exiting modied ratio estimators in the literature. It was found that the newly proposed estimators were more ecient than the traditional estimators, such as usual unbiased and ratio, i.e., ^Y and ^YR, and
existing modied ratio estimators, i.e., ^YST (Singh and
Tailor [4]), ^YKCi (Kadilar and Cingi [24]), and ^YKCi
(Kadilar and Cingi [25]), in terms of Mean Squared Error (MSE), Percentage Relative Eciency (PRE), and Relative Root Mean Square Error (RRMSE). It was also empirically observed that the proposed families of ratio-type estimators performed better than the traditional and existing modied ratio estimators by using two natural population data sets. Hence, we strongly suggest the use of our newly proposed ratio-type estimators over the existing ratio-ratio-type estimators used in this study for future work.
Acknowledgments
The authors are heartily thankful to the unknown learned referees for their valuable remarks and encour-agements.
References
1. Cochran, W.G. \The estimation of the yields of cereal experiments by sampling for the ratio gain to total produce", Journal of Agriculture Science, 30, pp. 262-275 (1940).
2. Sisodia, B.V.S. and Dwivedi, V.K. \A modied ratio estimator using coecient of variation of auxiliary variable", Journal of the Indian Society of Agriculture Statistics, 33(1), pp. 13-18 (1981).
3. Upadhyaya, L.N. and Singh, H.P. \Use of transformed auxiliary variable in estimating the nite popula-tion mean", Biometrical Journal, 41(5), pp. 627-636 (1999).
4. Singh, H.P. and Tailor, R. \Use of known correlation coecient in estimating the nite population means", Statistics in Transition, 6(4), pp. 555-560 (2003).
5. Kadilar, C. and Cingi, H. \Ratio estimators in simple random sampling", Applied Mathematics and Compu-tation, 151, pp. 893-902 (2004).
6. Kadilar, C. and Cingi, H. \Improvement in estimating the population mean in simple random sampling", Applied Mathematics Letters, 19, pp. 75-79 (2006c).
7. Singh, H.P., Tailor, R., Tailor, R., and Kakran, M.S. \An improved estimator of population mean using power transformation", Journal of the Indian Society of Agriculture Statistics, 58(2), pp. 223-230 (2004).
8. Singh, R., Chauhan, P., and Sawan, N. \A family of estimators for estimating population means using known correlation coecient in two-phase sampling", Statistics in Transition, New Series, 8(1), pp. 89-96 (2007).
9. Gupta, S. and Shabbir, J. \On improvement in esti-mating the population mean in simple random sam-pling", Journal of Applied Statistics, 35(5), pp. 559-566 (2008).
10. Koyuncu, N. and Kadilar, C. \Ecient estimators for the population mean", Hacettepe Journal of Mathe-matics and Statistics, 38(2), pp. 217-225 (2009).
11. Koyuncu, N. and Kadilar, C. \On improvement in estimating population mean in stratied random sam-pling", Journal of Applied Statistics, 37(6), pp. 999-1013 (2010).
12. Yan, Z. and Tian, B. \Ratio method to the mean estimation using coecient of skewness of auxiliary variable", ICICA. Part II, CCIS, 106, pp. 103-110 (2010).
13. Haq, A. and Shabbir, J. \Improved family of ratio estimators in simple and stratied random sampling", Communications in Statistics - Theory and Methods, 42, pp. 782-799 (2013).
14. Singh, H.P. and Solanki, R.S. \An ecient class of estimators for the population mean using auxiliary in-formation", Communications in Statistics-Theory and Methods, 42, pp. 145-163 (2013).
15. Yadav, S.K. and Kadilar, C. \Improved class of ratio and product estimators", Applied Mathematics and Computation, 219, pp. 10726-10731 (2013).
16. Subramani, J. and Kumarapandiyan, G. \Modied ratio estimators using known median and coecient of kurtosis", American Journal of Mathematics and Statistics, 2(4), pp. 95-100 (2012).
17. Subramani, J. and Kumarapandiyan, G. \Estimation of population mean using known correlation coecient and median", Journal of Statistical Theory and Appli-cations, 13(4), pp. 333-343 (2014).
18. Subramani, J. and Prabavathy, G. \Median based modied ratio estimators with known quartiles of an auxiliary variable", Journal of Modern Applied Statistical Methods, 13(1), pp. 234-254 (2014).
19. Yadav, S.K., Misra, S., Shukla, A.K., and Tiwari, V. \Improved estimation of population mean using median and coecient of variation of auxiliary vari-able", International Journal of Engineering Research and Applications, 4(1), pp. 206-211 (2014).
20. Khan, S.A., Ali, H., Manzoor, S., and Alamgir. \A class of transformed ecient ratio estimators of -nite population mean", Pakistan Journal of Statistics, 31(4), pp. 353-362 (2015).
21. Kumar, S. \An estimator of the mean estimation of study variable using median of auxiliary variable", Sri Lankan Journal of Applied Statistics, 16(2), pp. 107-115 (2015).
22. Irfan, M., Javed, M., Abid, M., and Lin, Z. \Improved ratio type estimators of population mean based on median of a study variable and an auxiliary vari-able", Hacettepe Journal of Mathematics and Statis-tics, 47(3), pp. 659-673 (2018).
23. Walia, G.S., Kaur, H., and Sharma, M.K. \Ratio type estimator of population mean through ecient linear transformation", American Journal of Mathematics and Statistics, 5(3), pp. 144-149 (2015).
24. Kadilar, C. and Cingi, H. \An improvement in esti-mating the population mean by using the correlation coecient", Hacettepe Journal of Mathematics and Statistics, 35(1), pp. 103-109 (2006a).
25. Kadilar, C. and Cingi, H. \New ratio estimators using correlation coecient", Interstat., pp. 1-11 (2006b).
26. Murthy, M.N., Sampling Theory and Methods, Statis-tical Publishing Society, Calcutta, India (1967).
27. Munoz, J.F., Alvarez, E., and Rueda, M.M. \Optimum design-based ratio estimators of the distribution func-tion", Journal of Applied Statistics, 41(7), pp. 1395-1407 (2014).
28. Alvarez, E., Moya-Fernandez, P.J., Blanco-Encomienda, F.J., and Munoz, J. F. \Methodological insights for industrial quality control management: The impact of various estimators of the standard deviation on the process capability index", Journal of King Saud University Science, 27, pp. 271-277 (2015).
Biographies
Muhammad Irfan is a doctoral student of Statistics at Zhejiang University, China. He has been working as lecturer in the Department of Statistics, Govern-ment College University, Faisalabad, Pakistan, since 2004. He has 11 research papers published in reputed journals. His areas of interest are survey sampling, probability distributions, and time series analysis. Maria Javed is a doctoral student of Statistics at Zhejiang University, China. She has been working
as lecturer in the Department of Statistics, Govern-ment College University, Faisalabad, Pakistan, since 2004. She has more than 8 research publications in international research journals. Her elds of work are probability distributions and survey sampling.
Zhengyan Lin is a Professor of Statistics at Zhejiang University, China. He has over 230 refereed publi-cations and 8 edited book volumes, and has guided research students at all levels of the curriculum, includ-ing undergraduate and PhD students. He has received external funding from National Natural Science.