Sharif University of Technology
Scientia IranicaSpecial Issue on: Socio-Cognitive Engineering http://scientiairanica.sharif.edu
Pilot workload assessment under dierent levels of
autopilot failure
M.R. Mortazavi
a, K. Raissi
b;, and S.H. Hashemi Mehne
ca. Department of Aerospace Engineering, Amirkabir University of Technology and Aerospace Research Institute, Tehran, Iran. b. Department of Aerospace Engineering, Amirkabir University of Technology, Tehran, Iran.
c. Aerospace Research Institute, Tehran, P.O. Box: 14665 834, Iran.
Received 9 March 2018; received in revised form 30 September 18; accepted 29 October 2018
KEYWORDS Baud rate; Human-machine interaction; Information theory; Simulator;
Subjective rating; Workload.
Abstract. One of the most interesting topics in the eld of human-machine interaction is workload. In this paper, by using information theory concepts, the baud rates generated in all subsystems of a generic simulator of piloting tasks were calculated; then, a unique numerical index, which determines an estimate of the overall workload, was extracted. To examine the eectiveness of the presented criteria, three tests with dierent levels of autopilot failure were designed in which existing workload was labeled based on the assumed baud rates. A group of subjects carried out these tests as pilots while recording their own ideas about perceived workload. Results conrmed that there were statistically signicant dierences between the averages of scores assigned by subjects to the overall workload at three levels of diculty. Consequently, the proposed quantitative index was found eective enough to determine workload levels in the simulator environment, thus facilitating the creation of the needed scenario noticeably.
© 2019 Sharif University of Technology. All rights reserved.
1. Introduction
Workload factor is an interesting issue in the eld of human-machine interaction (e.g., a real airplane or a ight simulator). Although there is no universally ac-cepted denition of workload, it can be characterized as a mental construct [1]. Mental workload represents the portion of a human's information processing capacity or resources, which is actually required to meet the system demands [2]. In a general view, there are several factors that aect the workload experienced by humans including individual skill, training, experience, fatigue,
*. Corresponding author. Tel.: +98 21 64543238 E-mail addresses: m r [email protected] (M.R. Mortazavi); k [email protected] (K. Raissi); [email protected] (S.H. Hashemi Mehne) doi: 10.24200/sci.2018.50592.1777
and stress as well as the number of tasks, diculty level of tasks, and switching rate [3].
Workload monitoring is essential for tasks with considerable cognitive demands such as those existing in the ying vehicles [4,5]. Regardless of a real or simulated ight, controlling an airplane undoubtedly requires pilots' sustained mental eort and distribution of attention resources among dierent available tasks at any moment. Today, highly exible autopilot systems help pilots provide a smooth and comfortable ight, thereby reducing the workload perceived by humans. In this form of collaboration, once an autopilot mal-function occurs, pilots need to change the level of automation from a full supervisory mode to a certain level of manual control, which can cause a sudden increase in the workload level. It is accepted that a change in the amount of workload can have a direct impact on human performance [6,7].
a standard applied simulation of the pilot's general tasks designed in NASA [8]. This simulator has been exploited as a useful tool in the relevant studies of human-machine interaction in the authorized research centers around the world, especially the US [9-12]. MATB-II incorporates the main skills necessary for a pilot including tracking, monitoring, communications, and resource management tasks. In a ight simulator such as MATB-II, humans continuously receive infor-mation from dierent sources as the input and provide adequate reactions based on his situational awareness. The input information creates, in fact, the workload; therefore, if the produced information in the system is estimated in some way, it may be possible to cate-gorize workload levels involved in dierent operational conditions quantitatively [13].
The application of experts' knowledge is a com-mon method for creating a scenario concerning the simulation of piloting tasks, that is, to provide a desired amount of workload, a designer determines the events that occur in the scenario based on his/her own experience by a trial-and-error process. Obviously, in some cases, this procedure can be too time consuming and may not necessarily lead to an accurate design considering workload requirements. This paper aims to create a procedure through which designers can obtain the specications of the desired scenario systematically so that the eect of varying degrees of diculty dened in the scenario can be reected on the output of the subjective questionnaire lled out by participants during the experiment. By providing a clear systematic routine for a scenario generation, the presented method allows the designer to establish a type of relationship between the adjustable parameters of the scenario and the requirements considered in terms of diculty levels. The rest of this paper is organized in the following sequence. Section 2 reports a literature review of workload assessment techniques. Section 3 includes three main subsections. First, the mathematical foun-dation of the information theory is presented. Then, the MATB-II simulator is introduced in brief, and the generated input information for each of its subsystems is separately calculated. Finally, some details of the NASA-TLX questionnaire are given. Section 4 de-scribes the conducted experiments completely, followed by statistical analysis of collected data as well as discussion about the results. The conclusions of this study are also provided in the last section.
2. Literature review
Generally, workload assessment in a system is possible through subjective and objective approaches. Due to their ease of use and relatively inexpensive application with no need for any special equipment, subjective rating scales are the most common tools to evaluate
the cognitive load associated with an activity. These techniques have much popularity among operators due to the opportunity they provide to comment on the system's features. In addition, these types of methods are suitably sensitive to the workload changes [14]. As one of the known and most compatible techniques with a subjective approach, the NASA-TLX is a standard procedure for assessing the overall workload perceived by the operator, which has been developed by the Human Performance Research Group in the NASA Ames Research Centre [15]. In comparison to other subjective workload scales, the NASA-TLX has the best sensitivity to changes at the workload levels and the strongest operator acceptance [16]. This simple and substantially ecient questionnaire has been used in many examples of various application areas [17].
In a recent study, Jaquess et al. investigated the relationship between cognitive workload and at-tentional reserve empirically [4]. In their conducted tests, participants performed a ight simulator task at three levels of challenge including easy, medium, and high; in addition, the NASA-TLX was applied as a whole measurement of task demands for verication purposes. In this way, it was found that cogni-tive workload and attentional reserve were inversely related. Orlandi and Brooks examined the eects of ship handling maneuvers on the mental workload and physiological reactions of marine pilots [7]. In a shipping simulator, while recording the self-report measures of task demand by means of the NASA-TLX, pilots completed four berthing maneuvers that are dierentiated by two factors: level of diculty and familiarity with the port. Results demonstrated that as the diculty level of berthing maneuvers increased, the workload level increased, too. Using a cognitive structure, Park et al. developed a mathematical model of workload considering the eects of task-related, behavior related, and subject-related sources as well as time pressure [18]. To investigate the ability of the proposed method, they compared the model's outputs with the subjective ratings of the NASA-TLX in an Air Trac Control (ATC) task, which led to satisfactory results. In another applicable study, Winter et al. carried out some experiments in which participants from an aviation university completed a ight between two cities in a xed-based ight-training device [19]. During each ight, participants applied two types of instrument approach charts including electronic and paper; it was indicated that the use of electronic charts reduced their workload as measured by the NASA-TLX.
Despite the advantages mentioned above, sub-jective rating scales do not always lead to a correct detection necessarily. For example, when the pilot performance degrades, they tend to unconsciously display a high degree of mental demand, even if not
much eort is required [14]. Therefore, these forms of rating are dependent on the people's willingness; if they are not recorded immediately after the execution of tasks, they may be disturbed by the eect of human memory, too. In such circumstances, the necessity of using objective criteria to assess workload is shown. Accordingly, possible solutions in this respect involve the use of the information theory. The advent of the information theory is indebted to the work carried out by Shannon in the 5th decade of the 20th century. By employing the concepts related to the probability theory, the information theory is used to build a quan-titative index for measuring the information content obtained through the observation of a signal [20]; in this way, the capacities of this theory in various domains are illustrated [21-25]. With the advent of the information theory, quantitative modeling of human capacity in information processing was facilitated, and the corresponding results can be explained in the form of the Hick-Hyman law and Fitts' law. According to the Hick-Hyman law, the reaction time of humans is linearly correlated with the amount of information existing in a stimulus signal [26,27]. In addition, Fitts proved that the time needed for a person to make a movement with a given average amplitude is a linear function of a specic diculty index [28].
Using information theory concepts, Phillips et al. constructed a theoretical model of human-machine interaction in the MATB simulator and used it to inves-tigate the implicit strategy of humans empirically [29]. The implicit strategy is realized when the subject has no prior knowledge of the contribution of each duty in the scenario of a test. On the contrary, if the subject becomes aware of this sort of information prior to his engagement, the strategy will be explicit. The outcomes of this study showed that, in the case of the implicit strategy, humans do not weight dierent available tasks equally and, instead, tend to pay greater attention to some specic tasks. In addition, the operator's response ratio does not necessarily vary in proportion to the amount of information generated in the system. In another study, Walters focused on determining the eect of the explicit strategy on a person's performance in simultaneously running tasks in the MATB environment [30]. In conducted tests, subjects were given approximate information weighting of each MATB-II component to inuence the strategy they utilized. Following the analysis of collected data, Walters concluded that human operators adjust their strategy in response to diculty changes, that is, they are highly dependent on the awareness of the component weighting for the strategy formulation while dealing with more challenging scenarios. In a follow-up to these researches, Phillips et al. compared the performance of MATB operators using the implicit-strategy with that of those using the explicit
strat-egy [31]. They found that the explicit-stratstrat-egy group achieved signicantly better performance scores than the implicit-strategy group for every task diculty level tested. Consequently, these authors proved that an eective strategy has a crucial role in human success in multitasking performance conditions.
Camden validated an information-theory-based model that provides an objective and meaningful mea-sure to describe system complexity and overall multi-tasking performance. Besides, he examined the eect of multi sensorial feedback on an operator strategy and performance in the MATB simulator [32]. Similar to previous studies, his work rearmed that although an operator's output increases when the volume of input information increases, these changes will not occur at the same rate. Moreover, it was observed that multi-sensorial feedback related to some of the MATB subsystems improved human performance in these tasks, of course with undesirable costs in the performance of tasks having no feedback. Hence, the overall performance is not signicantly aected by the presence of multi-sensorial feedback. In fact, Camden's work reminds us again that human operators have a maximum and nite capacity to process information. Lately, Liu et al. proposed and validated a mathemati-cal model for user performance enhancement in a multi-tasking platform, MATB-II [11]. This model included quantication of stimuli from each MATB-II subtask as bits per second, selection of task diculty and task weight, as well as the rearrangement of task weights. In a two-phase experimental approach, a signicant improvement of user performance was proved after readjusting tasks in relation to the oered method.
In this paper, by adopting an approach on the basis of the information theory, the rate of input information that must be processed by the pilot in the simulator is calculated; in addition, in this fashion, an objective methodology will be constructed to estimate the real workload. Although the results attainable by subjective approaches are available only after testing due to their reliance on the operator's judgment, an important advantage of the proposed idea is its pre-dictability. In other words, the experiment designer can satisfactorily approximate the diculty level associated with the scenario prior to its execution by subjects. 3. Methods and tools
3.1. Information theory
For a discrete stochastic variable X, h(X) is assumed to be the function that presents the spatial information content of X implicitly. In this stage, the formulation of h(X) is unknown, and we should make an appropri-ate selection of it. According to the information theory, being aware of the value of X in each realization of this stochastic variable will supply us with a certain
amount of information that is proportional to the possibility of observing that specic value for X. In other words, if the obtained value has a high probability of occurrence, the amount of information obtained from the observation will be low, and vice versa; in addition, if a value with a low probability of occurrence is received, a greater volume of information will be obtained.
This fact implies that h(X) should be determined so that the nal expression can be a monotonic function of the probability distribution, p(X). On the other hand, as an additional constraint, as expected, the information resulting from the observations of two independent discrete random variables X and Y should be equal to the sum of the information acquired from observing them separately.
Based on these two requirements, the numerical metric derived from the information theory would be a function as follows [33]:
h (X) = log2p (X) : (1) Of note, using base 2 in Eq. (1) leads to the expression of h(X) in terms of binary elements or bits. In addition, as expected, the negative sign ensures that h(X) is always non-negative. In a special case, when X has K states with a uniform probability of occurrence (i.e., when X entropy is at the maximum), h(X) is rewritable as in Eq. (2):
h (X) = log2K (2)
On the other hand, the diculty index, h(X), related to the Fitts' law stated in Section 2 has a mathematical representation as follows [28]:
h (X) = log2 A
Ws=2; (3)
where A is the average amplitude of movement, and Ws
is the tolerance range, i.e., the acceptable area where the result of the movement is desirable to place.
On the basis of the concepts introduced above, the baud rate of a stimulus signal can be dened. The baud rate quantity (denoted by B) is calculated by dividing the spatial information content of a signal by its temporal information content, where the temporal information content denoted by t is dened as the average time between the changes in the signal states (the occurrence of events) [29]:
B = h
t: (4)
If a system is composed of I subsystems, i = fi1; :::; iIg, the information is created in each of them
with the independent baud rate of Bi; then, the total
baud rate generated in the system will be the sum of the baud rates produced in all independent subsystems. In other words [29]:
BTotal= iBi= ithi
i: (5)
3.2. MATB-II simulator
Figure 1 depicts the user interface of the MATB-II simulator. Accordingly, for this simulator, the set of i in Eq. (5) is i = fT, S, L, R, Cg, where T, S as well as L, R, and C represent Tracking subsystem, Scales and Lights sections of monitoring subsystem, Resource management subsystem, and Communication subsys-tem, respectively. Additional details of the MATB-II subsystems will be discussed in the subsequent sections [8].
3.2.1. Tracking subsystem
The tracking subsystem is the only part of the MATB-II that simulates a continuous task. In this subsystem, it is demanded to always keep a moving circle with the diameter of D = l = 9 pixels at the minimum distance from the center of the box so that it never goes outside a xed circle with the diameter of D0= 3l = 27
pixels. Based on Fitts' law, such a constraint leads to a tolerance range of Ws= D0 D = 2D.
Throughout each simulation, the tracking subsys-tem can operate in either automatic or manual mode. Pilot inputs are ineective, and the tracking operation is performed automatically by the autopilot in the automatic mode; however, as soon as it is switched to the manual mode, the task is delegated to the pilot. In this condition, the operator will be able to control the moving circle using a joystick; in doing so, it is maintained at the center of the window as much as possible. It is worth noting that, in our intended application, switching to the manual mode, in fact, in-dicates the occurrence of a failure in the autopilot. The disturbance involved in the autopilot failure mode owns a stochastic behavior, i.e., the cursor direction and the amount of movement are random and not predictable for the subject. In addition, the disturbance intensity is adjustable by the experiment designer in one of the three approximate average velocities of:
VT = 4:50; 8:52; 12:35pixelss :
If the scenario in which the moving circle drifts with an average amplitude of AT = 3D over the mean
time step of tT is considered, the continuous rejection
of this disturbance and keeping the moving circle inside the xed circle lead to the spatial information content equivalent to the estimation attained based on Fitts' law [28]:
hT = log22D=23D = 1:59 bits: (6)
tT is calculated through Eq. (7) at three dierent
Figure 1. General scheme of the MATB-II simulator.
tT = AVT T =
27
VT: (7)
3.2.2. Monitoring subsystem
The monitoring subsystem comprises two subtasks including scales and lights. Regarding this subsystem, the subject is responsible for monitoring dierent components of the two subtasks and appropriately responding to the occurred discrete stimulus. The scales section, which appears at the bottom of the window, consists of four graded columns. Under normal conditions, the indicator of each column has slight uctuations around the center. If one of the indicators leaves the normal state, it will be transferred to the top or bottom of the column and will continue to uctuate there. Whenever this kind of deviation is detected, the pilot's duty is to immediately react to this event by pressing the relevant key (F1, F2, F3, or F4).
Thus, in the scales segment, for each stimulus, the subject encounters four possible keys to choose, that is, Ks= 4. Substituting this value in Eq. (2) leads to:
hs= log24 = 2 bits: (8)
The lights section includes two symbolic lamps with dierent functionalities. During the regular operation of the system, the lamp on the left with a
green light is continuously on as a sign of a normal state. When it turns o, indicating the departure from the standard condition, the pilot should recover this anomaly by pressing F5 key as soon as possible. On the other hand, the lamp on the right is typically o unless it appears symbolically with a red light as evidence of the occurrence of an emergency situation. Once the red light turns on, the pilot has to show his awareness of this situation in a short time by pressing F6 key and turning the light to the o mode.
Hence, for each event in the lights segment, there is a possibility to press F5 or F6 key that will result in KL= 2. Subsequently:
hL= log22 = 1 bit: (9)
Considering Eq. (5), ts and tL are the parameters
in the scenario that can be adjusted with regard to the desired baud rate.
3.2.3. Resource management subsystem
Concerning the resource management subsystem, the pilot's task is to maintain the levels of the remaining fuel in tanks A and B within the acceptable range by managing pumps 2 and 4. It is possible to turn on and o these two pumps by pressing keys 2 and 4 from the keyboard so that they will change into green (active mode) or background (passive mode) colors. Therefore,
KR= 2 and the value of hR will be:
hR= log22 = 1 bit: (10)
At the beginning of the test, both tanks contained 2500 units of fuel with xed consumption rates of _V = 500units
min. As a requirement for the normal operation of
the system, the fuel level in each tank should not exceed the range of 2500 V units with V = 100 units. Moreover, the ow rates of pumps 2 and 4 are always xed at 2 _V ; therefore, regardless of pumps' on or o modes, the net ow rates will be permanently the same constant of _V over time. With this conguration, tR
in Eq. (5) is the time needed for the fuel level to reach from the middle reference line to one of the two allowable upper or lower limits. Thus, it is possible to obtain tR through [30]:
tR=V_V : (11)
In addition, as can be seen in Figure 1, at any moment, one can nd the remaining amount of fuel in tanks A and B by checking the existing boxes under these two tanks.
3.2.4. Communications subsystem
In the activities related to the communication subsys-tem, the pilot is asked to change the current radio and frequency to the requested radio and frequency based on the voice message received. Each message can structurally be divided into three main parts. Ini-tially, the message begins by announcing the aircraft's identication code \NASA 504", which is constant in all messages. Then, in the second part, one of the four available radios including NAV1, NAV2, COM1, or COM2 is instructed to tune, and the pilot will be able to select this intended radio through one of F9, F10, F11, or F12 keys. Consequently, according to KCR = 4, the value of spatial information hCR will
be equal to:
hCR= log24 = 2 bits: (12)
At the end of the message, the required frequency, which is composed of two integer and decimal parts, is declared. To set the integer part of frequency, the subject must use one of the upward or downward arrows while holding the Ctrl key. The same procedure is to be carried out for the decimal part except that Alt key must be pressed instead of Ctrl. After completing this process, it is necessary for the pilot to register the values by pressing the Enter key. It should be noted that, in the simulator, the frequency of NAV1 and NAV2 ranges from 108.000 to 117.950 Hz with an incre-ment of 0.050, and the frequency of COM1 and COM2 ranges from 118.000 to 135.975 Hz with an increment of 0.025. In such a conguration, after some algebraic
systematic operations, it can be demonstrated that the average number of clicks required for the adjustment of frequency is 14.63. Thus, KCF = 14:63 and we have:
hCF = log214:63 = 3:84 bits: (13)
Through a summation of the numbers calculated for hCR and hCF, the value of hC can be obtained as
follows:
hC= hCR+ hCF = 2 + 3:84 = 5:84 bits: (14)
Similar to the monitoring subsystem, tC in the
communications subsystem, i.e., the mean time inter-val, between the announcements of the voice messages is determined according to the designer's preferred baud rate.
3.3. NASA-TLX questionnaire
By calculating the mean of scores assigned by the operator to each of its six subscales, the NASA-TLX presents a single number as an indicator of the overall workload. These subscales include mental demand, physical demand, temporal demand, performance, ef-fort, and frustration, each of which is briey explained as follows [15].
Within the mental demand subscale, the lev-els of required perceptual activities, such as think-ing, decision-makthink-ing, calculation, memory utilization, searching, etc., are of high priority in this section. The physical demand subscale monitors the intensity of required physical activities such as pulling, pushing, turning, controlling, activating, and so on. The temporal demand subscale assesses the amount of time available for applying an appropriate response with regard to the speed of events that occur in the system. In the performance subscale, the question to answer is how much a person believes to have earned success in satisfying the predetermined objectives of the underlying tasks. The eort subscale evaluates the number of needed attempts to achieve an acceptable level of performance. Finally, in the frustration sub-scale, the operator must reveal his personal opinion about the uncertainty, unwillingness, anger, and stress experienced during interaction with the system.
From a quantitative standpoint, based on the tunings made by the operator in the NASA-TLX panel, a number, which ranges between 0 and 100, is assigned to each subscale. By averaging six numbers obtained by a subject's personal judgment, a numerical value is ultimately extracted as a measure of the overall perceived workload.
4. Experiment
4.1. Description of validation test
As described in the previous sections, by using the baud rate quantity as the framework, the information theory
provides a numerical index to achieve an estimate of the actual workload experienced by the pilot in the simulator environment. In this stage, by designing some practical tests, we aim to compare the workload perceived by humans with the prediction made by the aforementioned approach. In consequence, the objec-tive is to answer a question concerning whether the dierent workload levels determined based on the infor-mation theory will lead to signicant dierences in the overall workload scores assigned by the subjects or not. 4.1.1. Equipment
All the relevant experiments were performed by a desk-top computer equipped with a quad-core processor of Intel Core i5 clocked at 3 GHz, 4 GB main memory, and 64-bit Windows 7 operating system. An X. Vision 18.5-inch monitor, an A4Tech keyboard, and a MaxFighter F-23U joystick manufactured by the Genius Company were the rest of equipment used in this regard. On the other hand, the codes required for building tests' scenarios as well as running the simulator based on the planned goals were written in MATLAB and visual basic programming environments, respectively [34,35]. In addition, for the statistical analysis of data obtained by experiments, version 23 of the SPSS software was employed [36].
4.1.2. Participants
Thirteen male students studying at the Department of Aerospace Engineering at Amirkabir University of Technology with a mean age of 26:093:25 voluntarily declared their readiness for the tests. As a prerequisite, it was expected that the subjects have normal visions and hearings and enough skills in working with the ight simulators. The initial investigation conrmed the establishment of this requirement for all the par-ticipants. In addition, all volunteers ocially expressed their agreement with collaboration in this research by signing a consent form.
4.1.3. Procedure
After obtaining the nal approval of subjects to par-ticipate in the experiments, lling and signing of the related forms, and making necessary arrangements, the training phase was initialized. At the beginning of this phase, by studying the le of familiarity with the MATB-II and attending the introductory meetings, individuals were familiarized with dierent parts of the simulator and how to interact with it. In the next step, by implementing training scenarios throughout eight separate days, the volunteers had experience in working with the simulator practically. This procedure lasted for an average of two hours for each subject who was required to achieve a stable performance.
When the eect of learning was removed and the training phase completed, the nal evaluation phase began in which the main intended scenarios to assess
subjects' performances were applied. In planning and designing the experiments, an attempt was made to minimize the probable adverse eects reasonably. This means that degrees of fatigue, irritation of the eyes, pain in the wrist or neck, etc. were not dierent from the normal conditions of daily working with a computer during the execution of a test. Moreover, the participants were asked to make their highest eorts and employ mental capabilities for a perfect management of the delegated tasks in the scenarios. Nevertheless, they were informed about a possibility that some parts of the scenarios may not be fully realizable, and this problem must not lead to a feeling of dissatisfaction.
In this phase, all participants carried out three distinct tests on three separate days; hence, the total number of runs was 39. Each test, with a total duration of 15 minutes, comprised three 5 minute sections. In each 5 min section, one of the desired levels for workload, including low, medium, or high, was implemented. Previous studies have demonstrated that the approximate baud rate of 1 bit/s is fairly the central limit of a human's ability for processing information, while the baud rates much lower than this value are not so challenging; conversely, achieving a baud rate more than 2 bits/s brings the person close to the threshold of processing capacity [30,32].
With regard to this fact, low, medium, and high levels of workload were created by setting the corre-sponding total baud rates of about 0.5 bits/s, 1 bit/s, and 1.5 bits/s, respectively. The details can be found in Tables 1 and 2. According to these two tables, in the rst, second, and third 5 min sections, the autopilot was set to an automatic mode by selecting VT = 0pixelss ,
a light failure mode by selecting VT = 4:50pixelss , and
a severe failure mode by selecting VT = 12:35pixelss ,
respectively. At the end of each 5 min section, the subject's opinion about the perceived workload was recorded immediately by means of the NASA-TLX questionnaire.
After all of the validation tests were carried out by all participants, attained data were processed while keeping specic results of each subject condential. In this procedure, the tools available in SPSS 23 software were employed in order to apply appropriate techniques of descriptive and analytical statistics.
4.2. Results
MATB-II stores the history of all events and responses occurring during an experimental run in the form of several arranged output les. By processing these les accurately, it is possible to obtain some interesting information about the performance of each subject considering all subsystems of MATB-II. In this regard, root-mean-square deviation of moving cursor from its ideal position (RMSDT), subject's reaction times for
Table 1. Time intervals between two successive stimuli for each subsystem of the simulator in the nal validation tests. Test no. Workload level tT(s) ts(s) tL(s) tR(s) tC(s)
1
Low 1 16 12 12 41
Medium 6 13 11 12 22
High 2.2 7 10 12 18
2
Low 1 16 12 12 41
Medium 6 13 11 12 22
High 2.2 6 10 12 17
3
Low 1 20 15 12 40
Medium 6 8 10 12 18
High 2.2 5 10 12 15
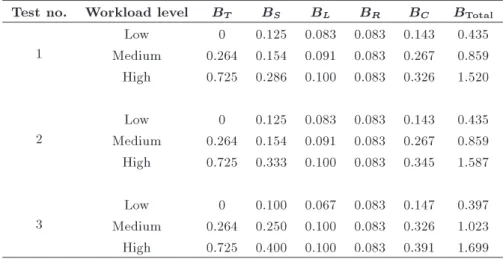
Table 2. Baud rates (bits/sec) pertaining to each subsystem of the simulator in the nal validation tests. Test no. Workload level BT BS BL BR BC BTotal
1
Low 0 0.125 0.083 0.083 0.143 0.435 Medium 0.264 0.154 0.091 0.083 0.267 0.859 High 0.725 0.286 0.100 0.083 0.326 1.520
2
Low 0 0.125 0.083 0.083 0.143 0.435 Medium 0.264 0.154 0.091 0.083 0.267 0.859 High 0.725 0.333 0.100 0.083 0.345 1.587
3
Low 0 0.100 0.067 0.083 0.147 0.397 Medium 0.264 0.250 0.100 0.083 0.326 1.023 High 0.725 0.400 0.100 0.083 0.391 1.699
Table 3. Means and standard deviations of dierent quantities related to the subjects' performance in the nal validation tests.
Workload level RMSDT (pixel) RTS (s) RTL (s) MAERA (unit) MAERB (unit) RTC(s)
Low 0 2:98 0:82 2:09 0:45 96:90 57:66 96:65 57:75 2:85 1:21
Medium 22:66 7:53 3:34 0:96 2:09 0:44 96:92 67:42 97:19 68:02 3:08 1:12 High 49:04 9:43 3:97 1:21 2:45 0:68 110:75 70:64 110:52 71:66 4:11 1:81
Scales and Lights tasks (RTS and RTL), mean absolute
error of the fuel level in tanks A and B (MAERA and
MAERB), and subject's reaction time in response to
a received voice message (RTC) are some quantities
that can be extracted from generated output les. For each subject and for each level of workload, the averages of the quantities related to his performance are calculated; then, the mean(s) and standard deviations of the results are reported (Table 3).
By investigating each column of Table 3 sepa-rately, one nds a general pattern in the performance data, that is, the more amount of workload will weaken individuals' performance in almost all subsystems of a simulator. When workload level increases, the mean
values of RMSDT for tracking subsystem, RTS and
RTL for monitoring subsystem, MAERA and MAERB
for resource management subsystem, RTCand for
com-munications subsystem seem to increase; in addition, this behavior can be interpreted as a performance degradation. Of course, it should be noted that this proposition is only a hypothesis, and its proof requires statistical analysis of the data, which is beyond the scope of this paper and requires a more comprehensive research.
On the other hand, Figure 2 shows the means of dierent NASA-TLX subscales at three levels of workload based on the evaluations conducted by the subjects.
Figure 2. Means of dierent NASA-TLX subscales at the three levels of workload per subject.
According to Figure 2, in spite of some existing exceptions, for most subjects in most subscales, there is an increasing trend in response to a rising workload. As noted in Section 3.3, in the NASA-TLX, the main index for workload determination is the mean of scores as-signed by humans to all existing subscales, and the sub-scales are not usually analyzed separately. According to Figure 3, the overall workload scores appear to have a more regular behavior across subjects since all partic-ipants (except subject 7) have detected a growth in the total workload during the execution of tests. In fact, the overall workload score converts the humans' multi-dimensional judgment of the workload to a single num-ber; in addition, with respect to the clear pattern avail-able in this quantity, it is sucient to use it as a single index to assess the workload perceived by humans. 4.2.1. Statistical analysis
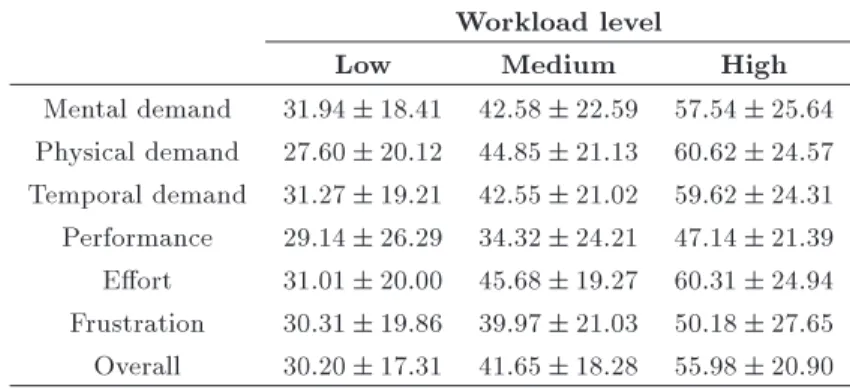
Table 4 displays the descriptive information of dier-ent NASA-TLX subscales at three levels of workload containing various degrees of autopilot failure.
Figure 3. Overall workload scores at three levels of workload per subject.
Figure 4 exhibits the means and condence in-tervals of the scores assigned to the overall workload. Considering the signicance level of = 0:05, the hypothesis of the presence of signicant dierences between the mean scores of the overall workload across the three levels is investigated.
Table 4. Means and standard deviations of the NASA-TLX subscales resulting from the evaluations conducted by the subjects.
Workload level
Low Medium High
Mental demand 31:94 18:41 42:58 22:59 57:54 25:64 Physical demand 27:60 20:12 44:85 21:13 60:62 24:57 Temporal demand 31:27 19:21 42:55 21:02 59:62 24:31 Performance 29:14 26:29 34:32 24:21 47:14 21:39 Eort 31:01 20:00 45:68 19:27 60:31 24:94 Frustration 30:31 19:86 39:97 21:03 50:18 27:65 Overall 30:20 17:31 41:65 18:28 55:98 20:90
Figure 4. Means and condence intervals of the overall workload scores at the three levels of workload.
Kolmogorov-Smirnov test, it is inferred that the de-pendent variable of the overall workload score has a normal distribution over dierent levels of workload as independent variables (P value > 0.05). This enables us to apply the parametric method compatible with the analysis we are dealing with, i.e., One-Way ANOVA. The outcome of the One-Way ANOVA indicates that there are signicant dierences between the means of the overall workload scores at low, medium, and high levels (P value < 0.001). In the next step, the output of the Levene test shows that the variance of the stochastic variable under study could be assumed homogenous over the three existing groups (P value = 0.571). Thus, the Tukey HSD test is a suitable choice for making a pairwise comparison among the groups in the post hoc analysis. The results are summarized in Table 5.
4.2.2. Clustering
In this section, the overall workload scores of subjects are analyzed with clustering as a new approach. In this regard, K-means algorithm is utilized for data clustering. Generally, in K-means algorithm, available data are divided into K categories based on their similarity to each other so that the members of each group have the smallest distance from each other than the points outside it. It should be noted that clustering is an unsupervised classication method, i.e., the data are categorized irrespective of which class they belong to; then, the accuracy of the classication is calculated based on the actual label of samples. Since the data collected in the conducted tests have three classes (low, medium, and high), they are divided into three distinct clusters by K-means, the results of which are given in Table 6. In this table, the actual class is equivalent to the real label of samples, and the predicted class is determined with respect to the output of K-means algorithm.
According to Table 6, at the low workload level, the majority of errors (43.59%) have been assigned to the medium level, with only 7.69% misclassied as high. The errors related to the medium level are
Table 6. Classication performance of K-means algorithm at the three levels of workload.
Predicted
Low Medium High
Actual
Low 48.72% 43.59% 7.69% Medium 35.90% 33.33% 30.77%
High 15.38% 25.64% 58.97%
Table 5. Pairwise comparison between the means of overall workload scores at the three levels of workload. Workload level Mean di Std. error P -value 95% condence interval
Low-medium -11.45 4.28 0.023 [-21.61 -1.29]
Medium-high -14.33 4.28 0.003 [-24.48 -4.17]
approximately of the same order, where 35.90% and 30.77% of samples have been recognized as low and high conditions, respectively. Most of the errors at the high level (25.64%) are misses categorized as those which belong to the medium level, with 15.38% misclassied as the low level. To illustrate, this table shows that the accuracy degree of the classication at the three levels of workload is not suciently satisfactory, and only 48.72%, 33.33%, and 58.97% of the samples have been correctly distinguished.
The clustering approach's poor performance in the categorization of the overall workload scores is due to the dierences in the personal points of view of the subjects concerning the absolute scores of existing workload levels. According to Figure 3, although the trend of the given scores is similar at the three levels of workload for most participants and the expected variations are seen, the absolute value of scores among the subjects has a complicated pattern since it is considerably susceptible to personal judgments. For example, while subject 5 has assigned the lowest score to the low level in his assessment of workload, this score is greater than the highest score that subject 6 has selected at the high level of workload. Such a condition degrades the eectiveness of the clustering algorithm in the process of separating dierent levels of workload based on existing scores. In the statistical analysis presented in the previous section, the means of the groups are compared, and the eect of these types of dierences in the absolute values is eliminated. There-fore, compared to the clustering approach, statistical analysis is a more ecient way to deal with the output of subjective evaluations of workload.
4.3. Discussion
In this paper, an eective and helpful quantitative index, called overall input baud rate (BTotal), was
utilized to signicantly facilitate the creation of the needed scenario in the MATB-II simulator. BTotal is
actually a measure of information totally generated in all subsystems of the simulator which can be explicitly linked to the perceived workload. By selecting an appropriate value for BTotal and dividing it between
dierent subsystems of the simulator, one can directly manage the tunable parameters of the scenario and generate his intended levels of workload more easily and quickly. To check the applicability of the proposed method, some experimental tests were conducted in which several individuals performed three predened scenarios with varying degrees of workload in the MATB-II simulator. On the one hand, dierent levels of workload were created based on the baud rates estimated by the theoretical model; on the other hand, subjects' opinions about the existing workload were recorded empirically by the NASA-TLX as a reliable and standard tool. This procedure, in turn,
provides an opportunity to compare the prediction by the mathematical model with the real data obtained through the subjective judgment. In doing so, the proposed mathematical model is validated by means of the real data gathered in conducted experimental tests, which appears to be an acceptable idea.
According to Table 5, it is concluded that the dierences between the means of the overall workload scores at the three levels of workload are signicant such that this quantity shows a substantial increase from low to medium and medium to high levels. Such a trend is in perfect agreement with the prediction achieved based on the information theory, which was accomplished based on the foundation of the overall baud rate calculated for each level. Therefore, if the workload self-assessment is considered as the basis of our judgment, it can be stated that the information theory has successfully classied various diculty levels synthesized in the scenario of the simulator, interest-ingly before the execution of tests by the subjects. In other words, results demonstrate that the oered model is capable enough to estimate the generated input information in the simulator of piloting tasks and give us the ability to adjust the diculty levels available in the scenario of an arbitrary test in a structured manner. It is worth noting that the subjective rating scales represent each person's opinion on available workload, which can be referred to as the perceived workload compared to the real one. In this respect, there is no guarantee that a personal approach leads to a completely accurate identication of the workload, since this type of evaluation is clearly susceptible to distortion. For instance, the real workload may occur at a low level; however, an operator considers it as high for some reasons such as a lack of the required ability essential for working with the system. In contrast, it is possible that the real workload is high; however, the operator regards it as low due to some factors such as condence or misplaced pride. In the research carried out in this paper, because of enough time allocated to the selection and training of the subjects, all participants reached an acceptable level of expertise in handling the given tasks. Therefore, the eects of these factors should be minimized as much as possible. 5. Conclusion
In this paper, an objective method was developed to facilitate the assessment of the workload level in the standard simulator of piloting tasks. By employing the information theory, the proposed technique estimates and combines the baud rates produced in dierent subsystems of the simulator and, in this way, presents a single quantitative criterion as an index of the overall workload. In addition, in the validation stage, three tests containing dierent levels of autopilot
failure were conducted. A group of subjects performed these tests in the role of the pilot while recording their own experience about the perceived workload. The results showed that there were signicant dierences between the means of the scores assigned by the subjects to three workload levels. This conrms that the suggested numerical index has acceptable accuracy in determining the workload level experienced by humans during work with the simulator. Besides its simplicity, this approach is considerably practical and accelerates the procedure of the scenario generation for use in the simulator.
Acknowledgments
The authors would like to thank the research team that designed the Multi-Attribute Task Battery (MATB-II) in NASA, particularly Ms. Yamira Santiago-Espada for sending this simulator to the authors. Moreover, the worthy cooperation of volunteered students of Aerospace Engineering at Amirkabir University for their timely and perfect performance of the empirical tests is appreciated.
References
1. Cain, B., A review of the Mental Workload Literature, Defence Research and Development Canada Toronto, Human System Integration Section, Toronto, Canada (2007).
2. Eggemeier, F.T., Wilson, G.F., and Kramer, A.F. \Workload assessment in multi-task environments", In Multiple-Task Performance, pp. 207-216, Taylor & Francis, Ltd., London, UK (1991).
3. Rusnock, C.F. and Borghetti, B.J. \Workload proles: A continuous measure of mental workload", Interna-tional Journal of Industrial Ergonomics, 63, pp. 49-64 (2018).
4. Jaquess, K.J., Gentili, R.J., Lo, L.-C., et al. \Empirical evidence for the relationship between cognitive work-load and attentional reserve", International Journal of Psychophysiology, 121, pp. 46-55 (2017).
5. Johannsdottir, K.R., Magnusdottir, E.H., Sig-urjonsdottir, S., et al. \The role of working mem-ory capacity in cardiovascular monitoring of cognitive workload", Biological Psychology, 132, pp. 154-163 (2018).
6. Puma, S., Matton, N., Paubel, P.-V., et al. \Us-ing theta and alpha band power to assess cognitive workload in multitasking environments", International Journal of Psychophysiology, 123, pp. 111-120 (2018).
7. Orlandi, L. and Brooks, B. \Measuring mental work-load and physiological reactions in marine pilots: Building bridges towards redlines of performance", Applied Ergonomics, 69, pp. 74-92 (2018).
8. Santiago-Espada, Y., Myer, R.R., Latorella, K.A., et al., The Multi-Attribute Task Battery II (MATB-II) Software for Human Performance and Workload Research: A User's Guide, National Aeronautics and Space Administration (NASA), Langley Research Cen-ter, Virginia, USA (2011).
9. Kurapati, S., Lukosch, H., Eckerd, S., et al. \Relating planner task performance for container terminal op-erations to multi-tasking skills and personality type", Transportation Research Part F: Trac Psychology and Behaviour, 51, pp. 47-64 (2017).
10. Bommer, S.C. and Fendley, M. \A theoretical frame-work for evaluating mental frame-workload resources in human systems design for manufacturing operations", International Journal of Industrial Ergonomics, 63, pp. 7-17 (2018).
11. Liu, S., Nam, C.S., and Fitts, E.P. \Quantitative modeling of user performance in multitasking environ-ments", Computers in Human Behavior, 84, pp. 130-140 (2018).
12. Karpinsky, N.D., Chancey, E.T., Palmer, D.B., et al. \Automation trust and attention allocation in multitasking workspace", Applied Ergonomics, 70, pp. 194-201 (2018).
13. Mortazavi, M.R., Raissi, K., and Hashemi, S.H. \Cre-ating a numerical index for measurement of workload levels in the simulator of piloting tasks", iehfsj, 4(4), pp. 24-32 (2017).
14. Wilson, G., Schlegel, R., and Veltman, J., Operator Functional State Assessment, RTO, NATO Research and Technology Organization, Paris, France (2004).
15. Hart, S.G. and Staveland, L.E. \Development of NASA-TLX (task load index): Results of empirical and theoretical research", Advances in Psychology, 52, pp. 139-183 (1988).
16. Hill, S.G., Iavecchia, H.P., Byers, J.C., et al. \Compar-ison of four subjective workload rating scales", Human Factors, 34(4), pp. 429-439 (1992).
17. Hart, S.G. \Nasa-task load index (NASA-TLX); 20 years later", Proceedings of the Human Factors and Ergonomics Society Annual Meeting, 50(9), pp. 904-908 (2006).
18. Park, S., Jeong, S., and Myung, R. \Modeling of multiple sources of workload and time pressure eect with ACT-R", International Journal of Industrial Er-gonomics, 63, pp. 37-48 (2018).
19. Winter, S.R., Milner, M.N., Rice, S., et al. \Pilot performance comparison between electronic and paper instrument approach charts", Safety Science, 103, pp. 280-286 (2018).
20. Shannon, C.E. \A mathematical theory of communica-tion", Bell System Technical Journal, 27(3), pp. 379-423 (2001).
21. Serej, N.D., Ahmadian, A., Kasaei, S., et al. \A robust keypoint extraction and matching algorithm based on wavelet transform and information theory for point-based registration in endoscopic sinus cavity data",
Signal, Image and Video Processing, 10(5), pp. 983-991 (2016).
22. Wang, Z., Alahmadi, A., Zhu, D.C., et al. \Causality analysis of fMRI data based on the directed infor-mation theory framework", IEEE Transactions on Biomedical Engineering, 63(5), pp. 1002-1015 (2016).
23. Saxena, S., Sanyal, G., Srivastava, S., et al. \Pre-venting from cross-VM side-channel attack using new replacement method", Wireless Personal Communica-tions, 97(3), pp. 4827-4854 (2017).
24. Depizzol, D.B., Montalv~ao, J., Lima, F.d.O., et al. \Feature selection for optical network design via a new mutual information estimator", Expert Systems with Applications, 107, pp. 72-88 (2018).
25. Jha, D.K., Virani, N., Reimann, J., et al. \Symbolic analysis-based reduced order Markov modeling of time series data", Signal Processing, 149, pp. 68-81 (2018).
26. Hick, W.E. \On the rate of gain of information", Quarterly Journal of Experimental Psychology, 4(1), pp. 11-26 (1952).
27. Hyman, R. \Stimulus information as a determinant of reaction time", Journal of Experimental Psychology, 45(3), pp. 188-196 (1953).
28. Fitts, P.M. \The information capacity of the human motor system in controlling the amplitude of move-ment", Journal of Experimental Psychology: General, 121(3), pp. 262-269 (1992).
29. Phillips, C.A., Repperger, D.W., Kinsler, R. et al. \A quantitative model of the human-machine interaction and multi-task performance: A strategy function and the unity model paradigm", Computers in Biology and Medicine, 37(9), pp. 1259-1271 (2007).
30. Walters, C.M. \Application of the human-machine interaction model to multiple attribute task battery (MATB): Task component interaction and the strat-egy paradigm", MSc Thesis, Wright State University, Ohio, USA (2012).
31. Phillips, C.A., Kinsler, R.E., Repperger, D.W., et al. \A human-machine interaction strategy function: in-formation throughput and weighting with application to multiple-attribute-task-battery", Theoretical Issues in Ergonomics Science, 14(4), pp. 379-401 (2013).
32. Camden, A.N. \Theoretical throughput capacity: Ca-pabilities of human information processing during
mul-titasking", PhD Dissertation, Wright State University, Ohio, USA (2015).
33. Bishop, C.M., Pattern Recognition and Machine Learning, 1st Edn., Springer, New York, USA (2006).
34. \MATLAB Primer", The MathWorks, Inc., Natick, USA (2015).
35. Schneider, D.I., An Introduction to Programming Us-ing Visual Basic 2012, 9th Edn., Prentice Hall Press, New Jersey, USA (2013).
36. Field, A. \Discovering statistics using IBM SPSS statistics", Ed., 4th Edn., Sage, London, UK (2013).
Biographies
Mohammad Reza Mortazavi was born in Tehran, Iran 1986. He received BSc and MSc degrees in Aerospace Engineering from Amirkabir University of Technology, Tehran, Iran in 2008 and 2011, respec-tively. Currently, he is a PhD candidate at Amirkabir University of Technology, Tehran, Iran. His research interests include human-machine interaction, system identication, and pattern recognition.
Kamran Raissi was born in Shiraz, Iran 1958. He received the BSc degree in Aeronautical Engineering from California Polytechnic University in 1983, the MSc degree in Mechanical Engineering from Santa Clara University in 1987, and the PhD degree from Amirkabir University of Technology in 2009, respec-tively. Currently, he is an Assistant Professor at Amirkabir University of Technology, Tehran, Iran. His research interests include ight mechanics, ight testing, and man-machine interface.
Seyed Hamed Hashemi Mehne was born in Mash-had, Iran, 1978. He received the BSc, MSc, and PhD degrees from Ferdowsi University of Mashhad, Mashhad, Iran all in Applied Mathematics in 1999, 2001, and 2005, respectively. Currently, he is an Assistant Professor at Aerospace Research Institute, Tehran, Iran. His research interests include optimal control, numerical mathematics, shape optimization, and parallel computing.