FOODWAYS IN TRANSITION: PLANT USE AND COMMUNITY AT THE WALL (31OR11) AND JENRETTE (31OR231A) SITES, HILLSBOROUGH, NORTH CAROLINA
By
Mallory A. Melton
Honors Thesis Curriculum in Archaeology
University of North Carolina at Chapel Hill
2014
Approved:
ABSTRACT
Mallory A. Melton: Foodways in Transition: Plant Use and Community at the Wall (31Or11) and Jenrette (31Or231a) Sites, Hillsborough, North Carolina
(Under the direction of C. Margaret Scarry)
This thesis will describe the archaeobotanical analysis of large pit features excavated during the 1990s and 2000s at the Wall (A.D. 1400-1600) and Jenrette (A.D. 1650-1680) sites in Hillsborough, North Carolina. Certain features demonstrate relatively equivalent quantities of a variety of plant taxa, whereas others are abundant in one or few taxa and appear to represent refuse of communal processing events. These processing events provide a case study for
ACKNOWLEDGMENTS
Without the tireless support of mentors, friends, and family, the completion of this thesis would not have been possible. I would like to thank Steve Davis, Brett Riggs, and Trawick Ward for continuing to pursue research questions at the Wall and Jenrette sites; if it were not for their efforts, the pits analyzed in the pages that follow would have never been discovered. The University of North Carolina at Chapel Hill Research Laboratories of Archaeology provided extensive access to flotation samples processed from the study sites. The efforts of Joffre Coe, Robert Wauchope, Roy Dickens, Kristen Gremillion, Julia Hammett, Jane Eastman, Jack
Wilson, Amber VanDerwarker, Margaret Scarry, and others established a baseline of research in the North Carolina Piedmont that enhanced the quality of my interpretations. Meg Kassabaum imparted critical perspectives on feasting that will continue to influence my thoughts on the topic. I owe Megan Hynek and Morgan Welch my gratitude for providing much needed
TABLE OF CONTENTS
List of Tables ... vii
List of Figures ... viii
Chapter 1: Introduction ... 1
Chapter 2: Background ... 4
Anthropogenic Landscapes of the North Carolina Piedmont (A.D. 1400-1709) ... 4
Excavation History... 8
The Wall Site (A.D. 1400-1600) ... 9
1938, 1940-1941. ... 10
1983-1984. ... 11
1997, 2001-2002 ... 16
The Jenrette Site (A.D. 1650-1680) ... 17
1989... 19
1992, 1996... 20
Chapter 3: Methods ... 22
Recovery Procedures ... 22
Feature Selection ... 22
Sorting and Identification Procedures ... 23
Gremillion ... 23
Melton ... 24
Chapter 4: Overall Results ... 26
Wood ... 41
Cultigens ... 41
Maize... 41
Common Bean ... 43
Indigenous Cultigens ... 43
Fruits ... 43
Nuts ... 44
Miscellaneous ... 45
Chapter 6: Jenrette Site (31Or231a) Results ... 46
Wood ... 52
Cultigens ... 52
Maize... 52
Common Bean ... 53
Indigenous Cultigens ... 53
Fruits ... 53
Indigenous Fruits ... 54
Peach ... 54
Nuts ... 55
Miscellaneous ... 56
Chapter 7: Inter-Site Analysis ... 58
Correspondence Analysis... 58
Box Plots ... 62
Chapter 8: Discussion ... 73
References ... 81
LIST OF TABLES
Table 1. Common Names of Plants Recorded by Lawson (1709) and Archaeological Evidence
from the Wall and Jenrette Sites ... 6
Table 2. Wall and Jenrette Features Processed for Botanical Analysis ... 15
Table 3. Ratios Used to Extrapolate Wall and Jenrette Counts ... 24
Table 4. Wall Site Volume and Feature Count Comparison with Gremillion (1989) ... 26
Table 5. Jenrette Site Volume and Feature Count Comparison with Gremillion (1993) ... 26
Table 6. Complete List of Taxonomic Names for Plants Identified at Wall and Jenrette ... 27
Table 7. Taxa Present at the Wall and Jenrette Sites ... 33
Table 8. Ten Most Ubiquitous Taxa in Wall and Jenrette Contexts ... 34
Table 9. Wall Site Seed Counts Recorded by Melton ... 37
Table 10. Wall Site Seed Counts Recorded by Gremillion ... 38
Table 11. Standardized Wall Site Seed Counts Recorded by Melton ... 39
Table 12. Standardized Wall Site Seed Counts Recorded by Gremillion ... 40
Table 13. Jenrette Site Seed Counts Recorded by Melton ... 46
Table 14. Jenrette Site Seed Counts Recorded by Gremillion ... 47
Table 15. Standardized Jenrette Site Seeds Counts Recorded by Melton ... 49
Table 16. Standardized Jenrette Site Seed Counts Recorded by Gremillion ... 50
Table 17. Metadata for Correspondence Analysis ... 59
Table A-1. Wall Site Plant Weights Recorded by Melton ... 86
Table A-2. Wall Site Plant Weights Recorded by Gremillion ... 87
Table A-3. Jenrette Site Plant Weights Recorded by Melton ... 88
LIST OF FIGURES
Figure 1. Diagram of the Hillsborough Archaeological District ... 2
Figure 2. Photograph of the Eno River.. ... 9
Figure 3. Excavations at the Wall site, 1938-1941 ... 11
Figure 4. Excavations at the Wall site, 1983-2002 ... 12
Figure 5. Extent of midden at the Wall site excavated during 1983 and 1984 field seasons ... 13
Figure 6. Pit features at the Wall site selected by Kristen J. Gremillion and Mallory A. Melton for botanical analysis ... 14
Figure 7. Histograms depicting volumes of Wall site features analyzed for botanical remains ... 17
Figure 8. Excavations at the Jenrette and Fredricks sites (1983-1998) ... 18
Figure 9. Pit features at the Jenrette site selected by Kristen J. Gremillion and Mallory A. Melton for botanical analysis ... 19
Figure 10. Jenrette and Fredricks site plan (31Or231a and 31Or231). ... 20
Figure 11. Histograms depicting volumes of Jenrette features analyzed for botanical remains.. . 21
Figure 12. Seasonality of most ubiquitous taxa at the Wall and Jenrette sites ... 34
Figure 13. Box plot of wood weights for Wall site features. ... 41
Figure 14. Box plot of wood weights for Jenrette site features. ... 52
Figure 15. Map identifying Feature 90 at the Jenrette site. ... 54
Figure 16. Map identifying Feature 157 at the Jenrette site. ... 56
Figure 17. Correspondence analysis for Wall and Jenrette, features only. ... 60
Figure 18. Correspondence analysis for Wall and Jenrette, taxonomic groups only. ... 60
Figure 19. Box plots of maize kernel counts standardized by total plant weight. ... 63
Figure 21. Map of the Jenrette site identifying Feature 158. ... 64
Figure 22. Box plots of maize kernel to cupule count ratios. ... 65
Figure 23. Box plots of acorn shell counts standardized by total plant weight. ... 66
Figure 24. Box plots of hickory shell counts standardized by total plant weight. ... 67
Figure 25. Box plots of acorn to hickory count ratios ... 68
Figure 26. Box plots of maize (cupule and kernel combined) to acorn shell count ratios. ... 69
Figure 27. Box plots of maize (cupule and kernel combined) to hickory shell count ratios ... 70
CHAPTER 1
INTRODUCTION
Communities cannot be fully defined by the arrangement of domestic and public structures; they must also be understood in terms of mundane activities including food procurement, processing, and consumption events that enact communal bonds. The written accounts of European travelers offer one line of evidence regarding community infrastructure in southeastern North America during the sixteenth and seventeenth centuries. European settlers describe being driven out by the Apalachee, witnessing ritual sacrifice at the death of The Great Sun, and feasts in which men ingested the Black Drink (Ewen and Hann 1998; Le Page du Pratz 1975; Bartram 1791). These accounts, however, often capture strikingly exotic images rather than the mundane activities of daily subsistence through which social relationships were performed and survival was ensured.
Archaeology and archaeobotanical analysis offer valuable lenses for interpreting social structure as they provide evidence of long-term trends and combat biases characteristic of European accounts. Given the extensive excavation, good preservation, and close proximity of sequentially occupied sites in the North Carolina Piedmont, this area is an excellent location for examining the development of communal foodways (food procurement, processing,
consumption, and disposal practices) in the protohistoric and contact periods. Archaeobotanical assessments of protohistoric and historic subsistence practices in this region complement European evaluations of Native land use practices.
1). Both sites were circular palisaded villages with house structures organized around open central plazas. Excavations completed in 1938, 1940-41, and 1983-84 at the Wall site and 1989-1990 at the Jenrette site revealed small to medium size pit features, some of which were analyzed for archaeobotanical remains by Kristen J. Gremillion. Later excavations at both sites revealed larger pits, some of which were analyzed for archaeobotanical remains for this thesis. Intra-site variations in pit size and location may indicate that larger pits located away from domestic structures represent communal eating or processing events, while smaller pits located near or within these structures represent evidence of household foodways.
Figure 1. Diagram of the Hillsborough Archaeological District. Excavations completed in the northeast sector of the Wall site in 2001 and 2002 were diagrammed after this map was produced and appear in Figure 4. Excerpted from Ward and Davis 1999:238. Copyright 1999 by the University of North Carolina Press.
CHAPTER 2
BACKGROUND
Current ecological, ethnohistoric, and archaeological evidence pertaining to landscape use provides context regarding the rich cultural and ecological complexity of the North Carolina Piedmont during the Late Woodland and Contact periods. This review serves to embed
interpretations of archaeobotanical material recovered from the Wall and Jenrette sites within evidence of a wide range of daily activities related to protohistoric and contact period subsistence strategies. I will use excavation procedures to describe the arrangement and contents of features and locate features analyzed by Gremillion and myself within each site plan.
Anthropogenic Landscapes of the North Carolina Piedmont (A.D. 1400-1709)
Local foodways inform understandings of historic land use patterns. Ethnohistoric evidence suggests that, on a regional scale, the anthropogenic landscape of the Eastern Woodlands was composed of three basic units: patches, corridors, and surrounding matrix (Hammett 1997:197). Hammett defines patches as settlements, such as nations, towns, villages, or small hamlets. Corridors are passageways by which an individual can move from one location to another. Corridors include trails, paths, and waterways. Land lying outside of settlements represents the surrounding matrix. Parcels of matrix surrounding patches are often referred to as “buffer areas” due to their ability to insulate settlements from encroachment and attack.
Patches, corridors, and buffer areas were not uniform in character, operation, or
(Cucurbita sp.), and other crops, though direct archaeological evidence of these fields is rare (Waselkov 1997:179). Corridors offered varying levels of protection and vulnerability (Hammett 1997:197). Riverbanks provided suitable environments for wild fruit trees and their rich, moist soil allowed for agricultural exploitation without irrigation (Scarry 2003:68).
Buffer areas provided protection and served as foraging grounds from which wild resources could be collected for food and fuel. Wild plant resources were actively maintained using management techniques, including pruning and fire, in order to promote optimal yields (Scarry 2003; Hammett 1997). Plants available on these lands varied according to local ecology. Hickory and acorn trees tend to be located in forests, while trees that produce fleshy fruits typically grow in disturbed environments, including forest clearings, field edges, and along the borders of small garden plots (Scarry 2003:60, 68). A variety of nuts, fleshy fruits, grains and oil seeds, legumes, roots and tubers, and greens were maintained and harvested in buffer zones throughout the Eastern Woodlands (for a comprehensive list see Scarry 2003:55-56).
Lawson also recognizes the Occaneechi as having an abundance of provisions at the time of his visit (Lefler 1967:55-56). Lawson’s records and archaeological evidence suggest that a wide variety of plants were exploited in the North Carolina Piedmont during the protohistoric and historic periods (Table 1). Evidence from historic period sites in North Carolina suggests that by the time that Lawson traveled into Occaneechi territory, Native peoples had begun to cultivate several foreign crops, namely cowpea, peach, and watermelon (Gremillion 1993b). Native peoples selectively incorporated both European crops and trade goods in manners that complemented existing cultural, social, and horticultural practices (Ward and Davis 2001:139).
Table 1. Common Names of Plants Recorded by Lawson (1709) and Archaeological Evidence from the Wall and Jenrette Sites
Recorded by Lawsona Archaeological Reference
Cultigens
Common Bean - Gremillion 1989, 1993a
Maize - Gremillion 1989, 1993a
Chenopod X Gremillion 1993a
Squash - Gremillion 1993a
Sumpweed - Gremillion 1993a
Sunflower X -
Tobacco X -
Fruits
Bramble X Gremillion 1993a
Cherry X -
Crabapple X -
Grape X Gremillion 1989, 1993a
Hawthorn X Gremillion 1989, 1993a
Huckleberry/Blueberry X -
Maypop - Gremillion 1989, 1993a
Mulberry X -
Peach X Gremillion 1993a
Persimmon X Gremillion 1989, 1993a
Plum X -
Strawberry X -
Nuts
Acorn X Gremillion 1989, 1993a
Chestnut X -
Hazelnut X -
Hickory X Gremillion 1989, 1993a
Table 1. Common Names of Plants Recorded by Lawson (1709) and Archaeological Evidence from the Wall and Jenrette Sites (continued)
Recorded by Lawsona Archaeological Reference
Miscellaneous
Beauty Berry Xb -
Cedar X -
Cypress X -
Honey locust X -
Pine X -
Pokeweed Xb Gremillion 1989, 1993a
Purslane X -
Sassafras X -
Spicebush X -
Sweet maple X -
Wax myrtle X -
Yaupon X -
a
Data adapted from Hammett 1992:25-27 with historical references provided by Lefler 1967.
b
References appear to apply to the indicated taxa, but the relationship cannot be proven.
Ethnohistoric evidence suggests that indigenous inhabitants of the North Carolina
carbohydrates, and protein as well as the potential for long-term storage made nuts a valuable subsistence resource (Scarry 2003:60-63).
This brief discussion of ecological and ethnohistoric evidence suggests that Native peoples managed a mosaic-like landscape whose borders extended far beyond the architectural limits of settlement (Fritz 2000:224). During the protohistoric and historic periods, people living in the North Carolina Piedmont met their subsistence needs through exploiting land at distance and adjacent to the domestic structures that they called home.
Excavation History
The North Carolina Piedmont has been an area of active archaeological interest since the 1930s (Ward and Davis 1999). Over the last 40 years, significant research has been undertaken within the context of the Siouan Project, an initiative begun in 1972 by the Research
Laboratories of Archaeology at the University of North Carolina at Chapel Hill (RLA). The Siouan Project aims to use archaeological evidence as an analytical lens for examining the impacts of European colonization upon Native peoples in the North Carolina Piedmont (Ward and Davis 2001). The Wall and Jenrette sites are geographically situated within the Hillsborough Archaeological District, a 25 acre zone where the Siouan Project has investigated four
Figure 2. Photograph of the Eno River. Taken from the southern edge of the Wall site, facing east. Photograph by author.
The Wall Site (A.D. 1400-1600)
The Wall site (31Or11) represents a palisaded village settlement with at least 13 circular domestic structures situated around an open plaza. While 13 have been identified, all of these structures did not likely stand at the same time. Approximately one-quarter of the 1.25-acre site has been excavated (Ward and Davis 1999:112). Although the field in which the site is located was plowed historically, postholes and features extend beneath the base of the plow zone and provide meaningful evidence about site architecture (R. P. Stephen Davis, Jr., personal
Feature 1 is recorded as Feature I). Features excavated during the 1940 and 1941 seasons are designated with Arabic numerals ranging from Feature 1 to Feature 54. Three burials were excavated during the 1983 season and called 1-83, 2-83, and 3-83. Five pit features were
excavated during the 1984 season and recorded as 1-84, 2-84, 3-84, 4-84, and 5-84. Excavations completed in 1997 did not identify any new features. Features excavated during the 2001 and 2002 seasons resumed the use of Arabic numerals, beginning with Feature 61. When
identification is necessary, feature numbers will correspond to these established sequences.
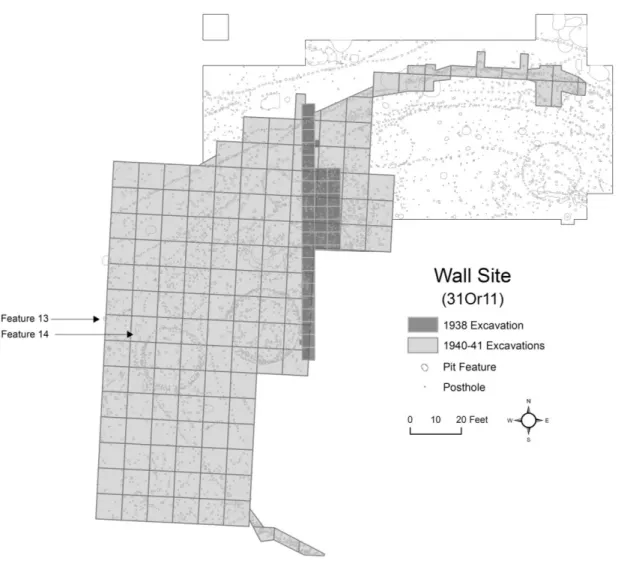
1938, 1940-1941. The earliest excavations, directed by Joffre Coe in 1938 and Robert
Wauchope in 1940-1941, sought to determine whether the Wall site represented the remains of the historic site of Occaneechi Town. These excavations revealed a number of houses, stockade alignments, burials, and other pit features (Figure 3). No soil or flotation samples were collected, as excavations were conducted prior to the advent of routine archaeobotanical analysis.
Figure 3. Excavations at the Wall site, 1938-1941. Two cob pits (Features 13 and 14) are identified.
1983-1984. In 1983, the RLA carried out excavations directed by Roy S. Dickens, Jr., R.
samples collected from undisturbed contexts produced an average corrected date of A.D. 1545 ± 80 years, proving that Wall predated the village of Occaneechi Town referenced in John
Lawson’s journal (Dickens et al. 1987:6). Additionally, waterscreening of fill from undisturbed contexts failed to yield glass beads or other European trade goods typically found on early historic sites (Ward and Davis 1999:112).
Figure 5. Extent of midden at the Wall site excavated during 1983 and 1984 field seasons. Adapted from Dickens et al. 1987:34, Figure 3.4.
overlays Feature 4-84 and is hypothesized to have been created by depositional processes post-dating the occupation of the Wall site (Dickens et al. 1987:38). Features 2-84 and 3-84 are oval-shaped pits containing charcoal, projectile points, and one potsherd. These pits likely represent secondary deposits of household subsistence debris (Dickens et al. 1987:39). Feature 4-84 consists of two oblong features southeast of Structure G and south of Palisade I that were initially thought to be wall trenches (Dickens et al. 1987:39). Upon further examination, these features appear to be associated with Feature 1-84 and may represent disturbed midden (R. P. Stephen Davis Jr., personal communication 2014). Feature 5-84 contained fired clay, ash, and charcoal and is thought to represent a secondary deposit of hearth contents within the midden (Dickens et al. 1987:40; R. P. Stephen Davis Jr., personal communication 2014).
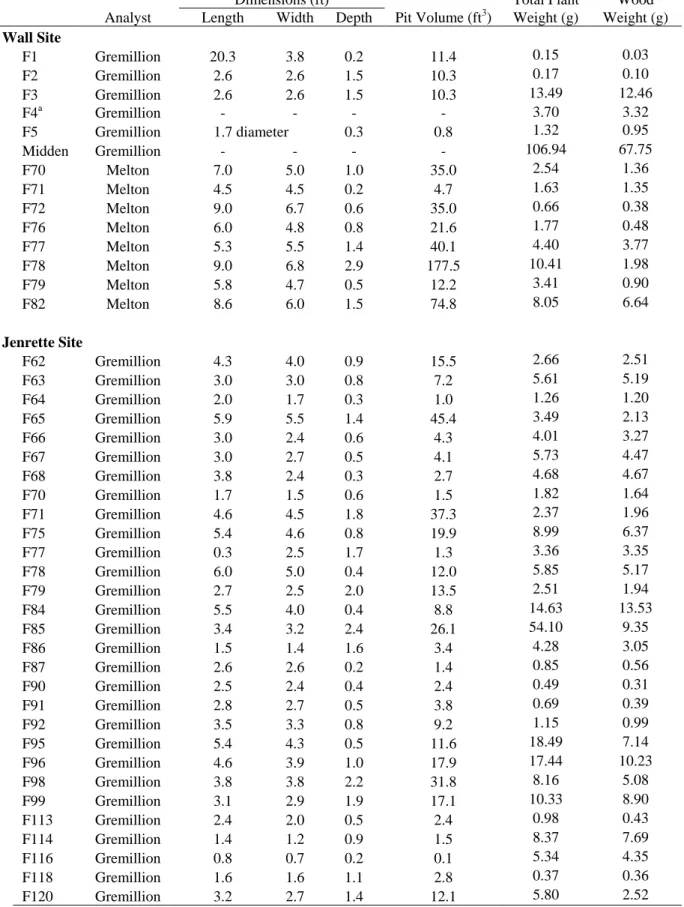
Table 2. Wall and Jenrette Features Processed for Botanical Analysis
Dimensions (ft) Total Plant Wood
Analyst Length Width Depth Pit Volume (ft3) Weight (g) Weight (g) Wall Site
F1 Gremillion 20.3 3.8 0.2 11.4 0.15 0.03
F2 Gremillion 2.6 2.6 1.5 10.3 0.17 0.10
F3 Gremillion 2.6 2.6 1.5 10.3 13.49 12.46
F4a Gremillion - - - - 3.70 3.32
F5 Gremillion 1.7 diameter 0.3 0.8 1.32 0.95
Midden Gremillion - - - - 106.94 67.75
F70 Melton 7.0 5.0 1.0 35.0 2.54 1.36
F71 Melton 4.5 4.5 0.2 4.7 1.63 1.35
F72 Melton 9.0 6.7 0.6 35.0 0.66 0.38
F76 Melton 6.0 4.8 0.8 21.6 1.77 0.48
F77 Melton 5.3 5.5 1.4 40.1 4.40 3.77
F78 Melton 9.0 6.8 2.9 177.5 10.41 1.98
F79 Melton 5.8 4.7 0.5 12.2 3.41 0.90
F82 Melton 8.6 6.0 1.5 74.8 8.05 6.64
Jenrette Site
F62 Gremillion 4.3 4.0 0.9 15.5 2.66 2.51
F63 Gremillion 3.0 3.0 0.8 7.2 5.61 5.19
F64 Gremillion 2.0 1.7 0.3 1.0 1.26 1.20
F65 Gremillion 5.9 5.5 1.4 45.4 3.49 2.13
F66 Gremillion 3.0 2.4 0.6 4.3 4.01 3.27
F67 Gremillion 3.0 2.7 0.5 4.1 5.73 4.47
F68 Gremillion 3.8 2.4 0.3 2.7 4.68 4.67
F70 Gremillion 1.7 1.5 0.6 1.5 1.82 1.64
F71 Gremillion 4.6 4.5 1.8 37.3 2.37 1.96
F75 Gremillion 5.4 4.6 0.8 19.9 8.99 6.37
F77 Gremillion 0.3 2.5 1.7 1.3 3.36 3.35
F78 Gremillion 6.0 5.0 0.4 12.0 5.85 5.17
F79 Gremillion 2.7 2.5 2.0 13.5 2.51 1.94
F84 Gremillion 5.5 4.0 0.4 8.8 14.63 13.53
F85 Gremillion 3.4 3.2 2.4 26.1 54.10 9.35
F86 Gremillion 1.5 1.4 1.6 3.4 4.28 3.05
F87 Gremillion 2.6 2.6 0.2 1.4 0.85 0.56
F90 Gremillion 2.5 2.4 0.4 2.4 0.49 0.31
F91 Gremillion 2.8 2.7 0.5 3.8 0.69 0.39
F92 Gremillion 3.5 3.3 0.8 9.2 1.15 0.99
F95 Gremillion 5.4 4.3 0.5 11.6 18.49 7.14
F96 Gremillion 4.6 3.9 1.0 17.9 17.44 10.23
F98 Gremillion 3.8 3.8 2.2 31.8 8.16 5.08
F99 Gremillion 3.1 2.9 1.9 17.1 10.33 8.90
F113 Gremillion 2.4 2.0 0.5 2.4 0.98 0.43
F114 Gremillion 1.4 1.2 0.9 1.5 8.37 7.69
F116 Gremillion 0.8 0.7 0.2 0.1 5.34 4.35
F118 Gremillion 1.6 1.6 1.1 2.8 0.37 0.36
1997, 2001-2002. The RLA resumed excavations at the Wall site in 1997 under the direction of R. P. Stephen Davis, Jr. Three units measuring 10 square feet were excavated, but no features were uncovered (Figure 4). Excavations continued in 2001 and 2002 under the direction of R. P. Stephen Davis, Jr. and Brett H. Riggs (in 2002 only) (Figure 4). The northeast region of the site was excavated in order to explore spatial gaps in previous excavations and obtain a broader sense of the settlement pattern (R. P. Stephen Davis Jr., personal communication 2014). Numerous postholes and 26 pit features were discovered during these excavations. I selected and analyzed eight pit features for botanical remains (Figure 6). Several of these pit features
appeared to be larger in volume and surface area than previously excavated features (Figure 7). Features chosen by Gremillion from the 1984 excavation range in volume from 0-20 ft3. Two features that I selected fall within the range exhibited by other features, while five features lie outside of Gremillion’s distribution. One feature (Feature 78) far exceeds the range of volumes
Table 2. Wall and Jenrette Features Processed for Botanical Analysis (continued)
Dimensions (ft) Total Plant Wood
Analyst Length Width Depth Pit Volume (ft3) Weight (g) Weight (g) Jenrette Site
F121 Gremillion 3.8 2.8 0.6 6.4 5.84 4.54
F122 Gremillion 3.7 3.6 1.4 18.6 34.13 25.40
F123 Gremillion 3.1 2.9 1.5 13.5 2.04 1.29
F124 Gremillion 1.5 1.5 0.4 0.9 1.16 1.15
F152 Melton 5.2 4.1 1.0 20.3 3.37 2.46
F153 Melton 5.1 3.0 1.0 15.3 0.45 0.43
F157 Melton 4.0 8.0 1.1 35.2 164.72 2.57
F158b Melton 4.0 2.3 0.9 8.3 12.09 2.71
F170 Melton 6.5 7.5 1.5 73.1 4.36 0.51
F210 Melton 3.8 3.7 1.8 24.0 1.49 0.46
a
Dimensions are not recorded for Feature 4-84, as it consists of two trenches for which the boundaries are not well designated.
b
demonstrated by pit features analyzed by Gremillion. The majority of features that I analyzed greatly exceed the volume of those analyzed by Gremillion.
(a)
(b)
Figure 7. Histograms depicting volumes of Wall site features analyzed for botanical remains. Figure 7a (top) represents volumes calculated for features selected by Gremillion. Figure 7b (bottom) represents volumes calculated for features selected by Melton. Volumes were calculated with the assumption that all pits are rectangular in shape. Feature 4-84 is excluded from this histogram due to its anomalous shape and doubts regarding its function.
The Jenrette Site (A.D. 1650-1680)
with houses that are no longer visible due to plow disturbance. The site was located in 1989 during auger testing conducted to ascertain the extent of the nearby Fredricks site (R. P. Stephen Davis, Jr., personal communication 2014). In comparison to the Wall site, the Jenrette site suffered more serious damage from plowing. Postholes at Jenrette were shallow in depth, suggesting that remains of site architecture may have been compromised as a result of plowing (R. P. Stephen Davis, Jr., personal communication 2014). Eleven excavations were completed at the Jenrette site by the RLA under the direction of R. P. Stephen Davis, Jr. and H. Trawick Ward (Figure 8). Jenrette excavations informed understandings of the Frederick site by revealing the spatial extent of Occaneechi-period occupations. Three excavation seasons (1989, 1992, and 1996) will be described in detail as flotation samples analyzed by Gremillion and myself were collected from pit features excavated during these investigations.
1989. Excavations conducted in 1989 under the direction of R. P. Stephen Davis, Jr. and H. Trawick Ward revealed structures inside of the palisade wall, including: 43 pits, four burials, and portions of two palisade lines (Ward and Davis 1993:319). Gremillion analyzed flotation samples collected from thirty-three of these pit features (Figure 9) and one burial (Gremillion 1993a). All pit features analyzed by Gremillion represent intact secondary refuse contexts. Data collected from flotation samples associated with the burial have been excluded from this analysis as any plant remains present in this context likely represent midden refuse or a ritually purposed deposit. Either explanation is not suitable to merit combining burial data with data collected from pit contexts. Although 1990 excavations will not be discussed in detail, one cob-filled pit
(Feature 149) was uncovered during this season near the center of the circular area within the palisade (Figure 10). This feature likely represents a smudge pit or hide-smoking facility.
Figure 10. Jenrette and Fredricks site plan (31Or231a and 31Or231). The Jenrette site is located on the upper left, enclosed by a circular palisade. Feature 149, a cob pit discovered during the 1990 excavation season, is identified.
1992, 1996. After 1990, excavations at the Jenrette site were conducted as field schools
fall within the range indicated by the majority of Gremillion’s features. One feature lies within the higher range of Gremillion’s distribution. A final feature (Feature 170) exceeds the range of volumes demonstrated by pit features analyzed by Gremillion. Features at the Jenrette site that I analyzed fall within the higher range of volumes for pit features at the Jenrette site, but it should be noted that the maximum observed volume for pits sampled for botanical analysis at the Jenrette site is half of the maximum observed volume for pits sampled for botanical analysis at the Wall site (Figure 7).
(a)
(b)
Figure 11. Histograms depicting volumes of Jenrette features analyzed for botanical remains. Figure 11a (top) represents volumes calculated for features selected by Gremillion. Figure 11b (bottom) represents volumes
CHAPTER 3
METHODS
Recovery Procedures
Starting with the 1984 excavations, soil samples were routinely collected from feature and midden deposits and processed by flotation to extract plant remains. All flotation samples collected from the Wall and Jenrette sites were measured in liters using a calibrated bucket and 10 liters of fill was taken whenever possible. When less than 10 liters of a feature or zone were present, the entire fill was collected. Flotation samples were processed using a modified SMAP system. A 0.71 mm mesh size was used to collect the light fractions and 1.56 mm mesh window screen was used to collect the heavy fractions. After samples were processed, light fractions and heavy fractions were dried and bagged separately.
Feature Selection
Sorting and Identification Procedures
Gremillion
Botanical samples analyzed by Gremillion were processed using procedures defined by Yarnell (1974) (Gremillion 1989:43-45). Each sample was weighed and sieved using a series of geological screens varying in size from 6.25 mm to 0.21 mm. For light fractions, material greater than 2.00 mm in size was fully sorted and each component was then weighed. Heavy fractions were only sorted for seeds and seed fragments, which were removed and identified by taxon. Quantities of taxa in screens less than 2.00 mm and greater than 0.71 mm in size were
Table 3. Ratios Used to Extrapolate Wall and Jenrette Counts
Ratio
grams/fragment Source
Maize cupule 0.011 Scarry 2003; VanDerwarker et al. 2007 Gourd rind 0.01 Scarry personal communication 2014
Acorn nutmeat 0.04 Wall and Jenrette features analyzed by Melton Acorn shell 0.0029 Wall and Jenrette features analyzed by Melton Hickory shell 0.0159 Wall and Jenrette features analyzed by Melton
Peach 0.0159 Walnut ratio, Wall and Jenrette features analyzed by Melton Walnut shell 0.029 Scarry 2003, combined walnut and butternut ratio
Melton
The methods that I used to sort and identify botanical remains recovered from pits at the Wall and Jenrette sites followed standard procedures used by the Research Laboratories of Archaeology at the University of North Carolina at Chapel Hill (Scarry 1998:3-5). Both light and heavy fractions of each sample were sorted. Counts reported for each taxon represent the sum of identified specimens in the light and heavy fractions of each sample. Light fractions of all samples were weighed and separated by size using geological sieves (2.0 mm, 1.4 mm, and 0.7 mm). Heavy fractions were also weighed and separated into two fractions measuring greater than 2.0 mm and less than 2.0 mm in size. Each size fraction, including material that passed through the 0.7 mm screen, was analyzed with the aid of a stereoscopic microscope (10-40X
magnification). For light fractions, the 2.0 mm sieve was fully sorted. Wood charcoal and contaminants were removed and weighed separately. Fragments of nutshell, maize cupule, and seeds were also removed, counted, and weighed. Fractions smaller than 2.0 mm were scanned for identifiable seeds or seed fragments, which were then counted and, where possible, weighed. Both portions of the heavy fraction were scanned for nutshell, maize cupule, and other seeds, which were then counted and weighted.
CHAPTER 4
OVERALL RESULTS
A total of 14 features at the Wall site, including the site midden and eight large features, will be considered for the purposes of this analysis (Table 4). Thirty-nine features representing pit contexts, six of which represent medium to large pits, will be included in the analysis of the Jenrette site (Table 5). The range of taxa recovered from these features is broad, indicating that varied natural and anthropogenic environments were utilized for subsistence and possibly medicinal and utilitarian purposes (Table 6).
Table 4. Wall Site Volume and Feature Count Comparison with Gremillion (1989)
Gremillion Melton
Features 5 8
Samples 5 16
Volume (L) 71 160
Plant weight (g) 18.83 32.87
Wood weight (g) 16.86 16.86
Midden 1 -
Samples 1 -
Volume (L) 200 -
Plant weight (g) 106.94 -
Wood weight (g) 67.75 -
Total Contexts 6 8
Total Volume (L) 271 160
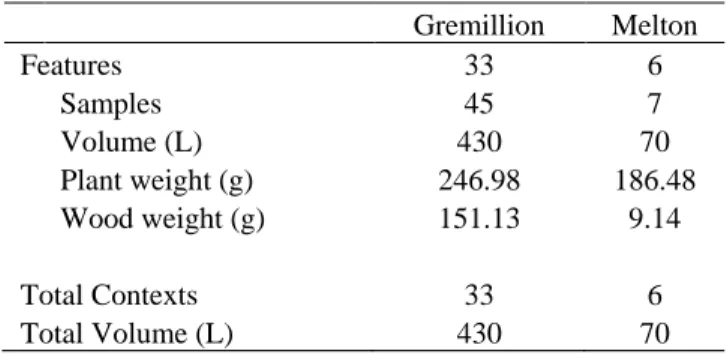
Table 5. Jenrette Site Volume and Feature Count Comparison with Gremillion (1993)
Gremillion Melton
Features 33 6
Samples 45 7
Volume (L) 430 70
Plant weight (g) 246.98 186.48
Wood weight (g) 151.13 9.14
Total Contexts 33 6
Table 6. Complete List of Taxonomic Names for Plants Identified at Wall and Jenrette
Common Name Taxonomic Name
Cultigens
Common bean Phaseolus vulgaris
Maize Zea Mays
Chenopod Chenopodium berlandieri
Knotweed Polygonum sp.
Squash Cucurbita sp.
Sumpweed Iva annua
Sunflower Helianthus annuus
Fruits
Bramble Rubus sp.
Grape Vitis sp.
Hawthorn Crataegus sp.
Maypop Passiflora incarnata
Peach Prunus persica
Persimmon Diospyros virginiana
Plum/cherry Prunus sp.
Nuts
Acorn Quercus sp.
Beech Fagus grandifolia
Hickory Carya sp.
Walnut Juglans nigra
Miscellaneous
Bearsfoot Smallanthus uvedalius
Bedstraw Galium sp.
Black gum Nyssa sylvatica
Carpetweed Mollugo sp.
Dogwood Cornus florida
Nightshade Solanum sp.
Pokeweed Phytolacca americana
Purslane Portulaca sp.
Sedge Scirpus sp.
Bulrush family Cyperaceae
Grass family Poaceae
Legume family Fabaceae
Nightshade family Solanaceae
Pink family Caryophyllaceae
categories are typically used when discussing Eastern Woodland plant assemblages and, thus, will prove useful in comparing information for Wall and Jenrette to archaeobotanical data collected from other sites (Scarry 2003:55-56).
Cultigens could have been grown in fields, small garden plots, or in areas of disturbed soil. Common bean and maize were introduced into the Eastern Woodlands from Mesoamerica and served as high-carbohydrate foods, complementing the carbohydrates and fats provided by indigenous cultigens (chenopod, knotweed, squash, sumpweed, and sunflower). Common bean was brought into the region around A.D. 1250 to 1300 and maize was introduced as early as A.D. 100, though it was not intensively cultivated in the Eastern Woodlands until around A.D. 800 or 900 (Hart 2008:90; Scarry 1993:78). The first evidence of squash in a cultural context in the Eastern Woodlands dates to approximately 5500 B.P. (Fritz 2000:226). In addition to serving subsistence functions, squash was used as raw material for manufacturing ceremonial rattles, containers, cooking tools, and fishing floats (Moerman 1998:188).
Maize, beans, and squash are well suited to polycropping, although this practice did not emerge until the late in the pre-contact period. As each member of the “three sisters” was introduced, planting these three resources in the same plot became preferable due to agricultural and dietary advantages (Hart 2008). Maize uses its height to compete against weeds and stalks serve as trellises for beans, while beans fix nitrogen in the soil (Hart 2008:87-88). Squash leaves produce shade that helps retain soil moisture and prevent the growth of weeds (Hart 2008:87).
groups who had acquired fruit or seeds from Spanish Florida (Gremillion 1993b; Reitz and Scarry 1985:47).
Acorn, hickory, and walnut were popular staples in Native North America as they could be harvested during the fall, when the majority of other plant resources stop producing edible fruit. During the winter, animal competitors would reduce the availability of nut resources (Scarry 2003:66). However, nuts could be stored for long periods, which contributed to their popularity as staple resources throughout the Eastern Woodlands. Thin-shelled nuts, like acorns, keep for shorter periods of time than thicker-shelled species including hickory, walnut, and hazelnut (Scarry 2003:66). Beech is less common in the archaeological record, perhaps due to the extra effort involved in collecting and processing nuts of such small size (Scarry 2003:68).
Miscellaneous taxa include those that do not fit well in any of the designated taxonomic categories. Most of the plants in this group can be divided into two subgroups: (1) small
indigenous seeds that are not confirmed cultigens; and (2) seeds that could only be identified to the family level. In the tables, taxa identified to family are listed below miscellaneous plants identified to lower taxonomic levels. Miscellaneous taxa represent a wide range of plants utilized for subsistence or medicinal purposes. Other taxa may represent plants that were of ecological importance, but were not actively cultivated or harvested by Native peoples. Along with
consumed. However, pokeweed greens needed to be picked early and were only rendered
consumable after toxins, naturally present in the plant, were removed through boiling (Moerman 1998). Carpetweed, sedge, and members of the bulrush and grass families signify native species that were ecologically important. In addition to potential medicinal and subsistence uses, these plants served utilitarian functions as raw material for creating baskets, pit linings, and cordage (Anderson and Moratto 1996:192).
Although a wide variety of taxa have been identified in the Wall and Jenrette assemblage, the list provided in Table 6 does not provide a complete representation of plants utilized by Wall and Jenrette inhabitants. Differential preservation and taphonomic processes have undoubtedly impacted plant recovery. Identified remains only represent taxa that have been deliberately or accidentally burned, not the full range of plants used for subsistence, medicinal, craft,
architectural, and other additional purposes (Pearsall 2000:244).
Consumption and production debris are also differentially manifested in an assemblage. Only certain biological components of each plant are disposed of in fires. In the Eastern
Woodlands, plant parts typically used as fuel (maize cobs and hickory shell, for example) and the remains of cooking and storage accidents are most likely to preserve (Pearsall 2000:244). Even when plants are exposed to fire, biological factors impact preservation. Plant component, species, moisture content, atmosphere, length of exposure, and temperature have been identified as
as neither preserve well in archaeological deposits (Scarry 2003:72-73). Tubers were utilized as sources of carbohydrates that could be harvested year-round. Starch grain analysis can be used to detect evidence of tuber processing on ceramic vessels or stone tools (Messner 2011). However, applications of this method are rare in the Eastern Woodlands due to its novelty, and starch grain studies have not been performed on Wall or Jenrette materials. The use of greens is even more elusive since leaves were eaten whole and discarded portions would not have survived burning (Scarry 2003:73).
The specimens that survived differed in their presence at each site (Table 7). Similar ranges of indigenous and introduced cultigens and nuts were identified at both sites. Fruit assemblages are comparable with two exceptions: bramble and peach. Peach appears as a consequence of temporality (the crop had not yet spread into the North Carolina Piedmont when the Wall site was occupied), whereas the absence of bramble at Wall may be due to consumption of seeds or discrepancies in harvesting or disposal practices. A greater number of miscellaneous taxa were identified at the Wall site, a trend that could be associated with temporal changes in plant use practices. Alternatively, since seeds associated with these taxa tend to be small in size, they may have been lost at the Jenrette site as a result of bioturbation.
Seasonality profiles are useful in reconstructing subsistence strategies. Presence of
Table 7. Taxa Present at the Wall and Jenrette Sites
Wall Jenrette
Gremillion Melton Gremillion Melton Cultigens
Common bean X X X
Maize cupule X X X X
Maize kernel X X X X
Chenopod X X
Knotweed X X
Squash rind X
Sumpweed X X X
Sunflower X
Fruit
Bramble X X
Grape X X X X
Hawthorn X X
Maypop X X X X
Peach X X
Persimmon X X X
Plum/cherrya X
Nuts
Acorn cap X
Acorn nutmeat X X X X
Acorn shell X X X X
Hickory shell X X X X
Walnut shell X X X
Beech nut X
Miscellaneous
Bean/persimmonb X X
Bearsfoot X X
Bedstraw X X X X
Black gum X X
Bulrush X
Carpetweed X
Dogwood X
Nightshade X
Pokeweed X X
Purslane X
Sedge X
Grass family X
Legume family X X X
Nightshade family X X X
Pink Family X
a
The slash mark between the names of these two classifications signifies that they are closely related taxonomically and are hard to distinguish in fragmentary remains.
b These two taxa are not related but the establishment of a separate category was
Table 8. Ten Most Ubiquitous Taxa in Wall and Jenrette Contexts
Plant Component Contexts Present Total Contexts Ubiquity Value
Hickory shell 47 53 89%
Acorn shell 35 53 66%
Maize kernel 30 53 57%
Maize cupule 17 53 32%
Walnut shell 16 53 30%
Peach 13 53 24%
Acorn nutmeat 11 53 21%
Persimmon 10 53 19%
Grape 8 53 15%
Maypop 6 53 11%
May June July August September October November
Cultigens
Maize
Fruit
Grape
Maypop
Peach
Persimmon
Nuts
Acorn
Hickory
Walnut
Figure 12. Seasonality of most ubiquitous taxa at the Wall and Jenrette sites. Seasonality data adapted from VanDerwarker et al. 2007.
CHAPTER 5
WALL SITE (31OR11)RESULTS
This chapter presents data on the plants recovered from the Wall site and examines abundance by taxonomic group. Raw counts for analyses performed by Gremillion and myself are presented in Tables 9 and 10. These counts were also standardized by total plant weight (TPW) (Tables 11 and 12). Total plant weight is the combined weight of identified wood, nut fragments, seeds, and other plant parts. Standardizing by total plant weight corrects for
differential density of plant remains in depositional contexts and allows for better assessment of the relative presence of each taxon in the overall assemblage than other norming variables, such as volume (Fritz 2005:793-794). Additionally, total plant weight takes into account context-dependent variations in preservation conditions, which would be masked if one were to
Table 9. Wall Site Seed Counts Recorded by Melton
F 70 F 71 F 72 F 76 F 77 F 78 F 79 F 82 Total plant weight (g) 2.54 1.63 0.66 1.77 4.40 10.41 3.41 8.05 Wood weight (g) 1.36 1.35 0.38 0.48 3.77 1.98 0.90 6.64 Volume (L) 10.00 10.00 10.00 10.00 10.00 30.00 20.00 60.00
Cultigens
Common bean 2 1
Maize cupule 88 31 19 31 41 77 504 38
Maize kernel 4 2 2 1 6 13 16 15
Chenopod 4
Knotweed 1
Sumpweed 1 2
Sunflower 1
Fruits
Grape 1 3
Maypop 3
Persimmon 6
Plum/cherry 1
Nuts
Acorn cap 6
Acorn nutmeat 1 2 1 4
Acorn shell 55 30 3 5 95 16 10 144
Beech nut 1
Hickory shell 34 5 29 86 15 478 9 3
Miscellaneous
Bean/persimmon 1 1 14
Bedstraw 1
Black gum 2
Carpetweed 3 6
Purslane 1 1 1
Sedge 1
Grass family 2 1 4
Legume family 1
Nightshade family 1
Table 10. Wall Site Seed Counts Recorded by Gremilliona
F 1-84 F 2-84 F 3-84 F 4-84 F 5-84 Midden Total plant weight (g) 0.15 0.17 13.49 3.70 1.32 106.94
Wood weight (g) 0.03 0.10 12.46 3.32 0.95 67.75
Volume (L) 10.00 10.00 13.00 28.00 10.00 200.00
Cultigens
Common bean 4
Maize cupuleb 5 244
Maize kernel 1 26
Fruits
Grape 21
Hawthorn 1 1
Maypop 8
Persimmon 1
Nuts
Acorn nutmeatb 2 6
Acorn shellb 31 17 14 952
Hickory shellb 2 26 2 15 1451
Walnut shellb 38
Miscellaneous
Bearsfoot 1 1
Bedstraw 1
Dogwood 1
Pokeweed 1
Legume family 1 1
Nightshade family 1
Pink family 1
Unidentified 2 1 1 26
a
Data adapted from Gremillion 1989:276, 278.
b
Table 11. Standardized Wall Site Seed Counts Recorded by Melton
F 70 F 71 F 72 F 76 F 77 F 78 F 79 F 82
Cultigens
Common bean 1.13 0.10
Maize cupule 34.65 19.02 28.79 17.51 9.32 7.40 147.80 4.72
Maize kernel 1.57 1.23 3.03 0.56 1.36 1.25 4.69 1.86
Chenopod 0.50
Knotweed 0.23
Sumpweed 0.10 0.25
Sunflower 0.12
Fruits
Grape 0.61 0.29
Maypop 1.69
Persimmon 0.75
Plum/cherry 0.10
Nuts
Acorn cap 1.36
Acorn nutmeat 0.39 0.45 0.10 0.50
Acorn shell 21.65 18.40 4.55 2.82 21.59 1.54 2.93 17.89
Beech nut 0.39
Hickory shell 13.39 3.07 43.94 48.59 3.41 45.92 2.64 0.37
Miscellaneous
Bean/persimmon 1.52 0.29 1.74
Bedstraw 0.23
Black gum 0.45
Carpetweed 0.68 0.75
Purslane 0.23 0.10 0.29
Sedge 1.52
Grass family 1.13 0.23 0.50
Legume family 0.12
Nightshade family 0.12
Table 12. Standardized Wall Site Seed Counts Recorded by Gremillion
F 1-84 F 2-84 F 3-84 F 4-84 F 5-84 Midden
Cultigens
Common bean 0.04
Maize cupule 33.33 2.28
Maize kernel 0.76 0.24
Fruits
Grape 0.20
Hawthorn 0.27 0.01
Maypop 0.07
Persimmon 0.01
Nuts
Acorn nutmeat 0.15 0.06
Acorn shell 2.30 4.59 10.61 8.90
Hickory shell 11.76 1.93 0.54 11.36 13.57
Walnut shell 0.36
Miscellaneous
Bearsfoot 0.07 0.27
Bedstraw 0.01
Dogwood 0.01
Pokeweed 0.01
Legume family 0.27 0.01
Nightshade family 0.27
Pink family 6.67
Wood
Wood is the most common taxon in the majority of botanical samples. In addition to serving as an indicator for burning activity and a tool for environmental reconstruction, wood can provide evidence of structural remains (Smart and Hoffman 1988). A box plot was used to examine distribution of wood density among analyzed features. When wood weight for each feature was standardized by soil volume, log transformed, and compared, all observations fall within 1.5 hinge-spreads (where hinge-spread is defined as the absolute value of the difference between the values of the upper and lower hinges, or first and third quartiles, of the distribution) (Figure 13). The majority of features appear to have low wood density. The high wood density within Feature 3 may be indicative of the presence of more structural remains or charred fuel wood.
Figure 13. Box plot of wood weights for Wall site features.
Cultigens Maize
Although maize was introduced from Mesoamerica as early as A.D. 100, it was not intensively cultivated in the Eastern Woodlands until around A.D. 800 or 900, and did not begin to serve as a dietary staple until after A.D. 1000 (Scarry 1993:78). Though this model is
agricultural production, or development of dietary importance (Scarry 1993). As few earlier Uwharrie (A.D. 800-1200) and Haw River (A.D. 1000-1400) phase sites have been analyzed for botanical remains, the timing of maize intensification in the North Carolina Piedmont is not well known (Ward and Davis 1999:100-105).
Both maize cupule and maize kernel are ubiquitous in features that I analyzed. Two features (Features 1-84 and 5-84) analyzed by Gremillion contain scant evidence of maize remains. Midden contexts contain greater amounts. When counts of maize are standardized, the highest counts are reported for features that I analyzed. Maize cupules were recovered at higher quantities than maize kernels. Maize kernels represent the edible portion of the plant, whereas maize cupules are the inedible sockets that hold the kernel and form the cob. The ratio of maize kernels to maize cupules in a given context is a good indicator of whether recovered remains are the result of consumption or processing activities. Patterning in kernel to cupule ratios will be discussed in greater detail in Chapter 7.
kernel count. Standardized counts emphasize that maize agriculture played a major role in the subsistence practices of Wall site inhabitants.
Common Bean
Bean is far less common than maize at the Wall site. Small quantities of bean were recovered from the sheet midden and two features that I analyzed (Feature 76 and Feature 78). Bean cotyledons represent the edible portions of each plant, which likely contributed to their underrepresentation at the Wall site.
Indigenous Cultigens
Native crops (squash, chenopod, knotweed, sumpweed, and sunflower) appear to have played a minor role in subsistence at the Wall site. Squash (rind or seed) was not identified in any feature at the Wall site. Remains of the other indigenous crops were not recovered from features analyzed by Gremillion and were only recovered in small quantities in three features that I analyzed (Features 77, 78, and 82). In interior parts of the Eastern Woodlands, indigenous cultigens seem to have been more heavily utilized for subsistence purposes. The small number of indigenous cultigens recovered at the Wall site, however, is not unusual for archaeological assemblages in North Carolina dating to the Late Woodland and contact periods (VanDerwarker et al. 2007).
Fruits
Grape, maypop, persimmon and plum/cherry represent the suite of fruits identified in the Wall site assemblage. These wild resources may have been pruned and tended to ensure
persimmon in midden samples. I found small quantities of grape, maypop, persimmon, and plum/cherry in Features 71, 76, 78, and 82. When these counts are standardized, the data suggest that fruits represented a minor source of subsistence for the inhabitants of the Wall site. The largest standardized count belongs to maypop (Feature 76) and is still comparatively low. Although a reasonable variety of taxa were exploited, fruits appear to have been eaten in small quantities. As has previously been discussed, archaeological evidence of fruit exploitation is strongly affected by seed consumption and burning practices.
Nuts
Miscellaneous
Additional taxa identified in Wall site samples appear to belong to three main categories: medicinal plants, wild subsistence resources, and grasses. Several specimens were also identified to the bean/persimmon category. Miscellaneous taxa largely represent fragmentary specimens and, therefore, interpretation of this taxonomic category is limited. A wider variety of
miscellaneous taxa were identified in features that I analyzed than in those analyzed by Gremillion. Generally speaking, Gremillion’s samples tend to include plants that could have been used as medicinal resources, whereas my samples contain purslane (known for its
CHAPTER 6
JENRETTE SITE (31OR231A)RESULTS
This chapter presents data on the plants recovered from the Jenrette site and examines abundance by taxonomic group. Raw counts for analyses of Jenrette site features are reported below (Tables 13 and 14). These counts were also standardized by total plant weight (TPW) (Tables 15 and 16). Total plant weight, wood weight, and sample volume are reported in raw count tables (Tables 13 and 14). Weight data for both investigations are reported in Appendix A (Tables A-3 and A-4). Cultural importance will be described as needed for taxa not present in the Wall site assemblage.
Table 13. Jenrette Site Seed Counts Recorded by Melton
F 152 F 153 F 157 F 158 F 170 F 210
Total plant weight (g) 3.31 0.45 164.67 8.16 4.32 1.49
Wood weight (g) 2.46 0.43 2.57 2.71 0.51 0.46
Volume (L) 20.00 10.00 10.00 10.00 10.00 10.00
Cultigens
Maize cupule 14 2 16 459 8 3
Maize kernel 7 4 2 3 3 3
Sumpweed 2
Fruits
Bramble 2
Grape 1 1
Maypop 1
Peach 4
Nuts
Acorn nutmeat 4 16 1 1
Acorn shell 99 2209 19 20 2
Hickory shell 20 2300 31 106 31
Walnut shell 2
Miscellaneous
Bean/persimmon 1
Bedstraw 1
Table 14 . Je nret te S ite Seed Co unts Re corded by Grem illi on a F 62 F 63 F 64 F 65 F 66 F 67 F 68 F 70 F 71 F 75 F 77 F 78 F 79 F 84 F 85 F 86 F 87 Tot al pl ant wei ght (g) 2. 66 5. 61 1. 26 3. 49 4. 01 5. 73 4. 68 1. 82 2. 37 8. 99 3. 36 5. 85 2. 51 14. 63 54. 10 4. 28 0. 85 W ood weight (g) 2. 51 5. 19 1. 20 2. 13 3. 27 4. 47 4. 67 1. 64 1. 96 6. 37 3. 35 5. 17 1. 94 13. 53 9. 35 3. 05 0. 56 Volu m e ( L) 10. 00 10. 00 10. 00 20. 00 10. 00 20. 00 10. 00 10. 0 0 10. 00 10. 00 10. 00 10. 00 10. 00 12. 50 20. 00 10. 00 10 .00 Cult
igens Comm
on be an 1 2 Ma iz e cupule b 1 Ma iz e ker nel 2 6 2 3 3 2 Che no pod Knotwe ed Squash ri nd b 1 Su m pwee d 5 Frui ts Bra m ble 2 Grape 1 Hawthorn Ma y pop 1 4 Peach b 11 2 2 1 1 2 7 4 Persi mm on 7 1 2 4 Nuts Acorn nut m eat b 1 Acorn she ll b 7 17 10 65 3 21 3 52 7 41 7 Hickory she ll b 4 8 1 59 43 45 7 21 83 13 16 38 2613 65 W alnut she ll b 1 1 8 1 1 65 Mis cellaneou s Be arsfo ot Be d straw Blac k g um Bulrush 1 Nightsh ade 1 Pokewe ed Nightsh ade f amily 1 Unidenti fi ed 2 1 1 1 1
a Data adapt
ed f ro m Gre m illion 1993a : 374 -37 6, 379 -381.
b Count
Table 14 . Je nret te S ite Seed Co unts Re co rded by Grem illi on
a (continued)
F 90 F 91 F 92 F 95 F 96 F 98 F 99 F 113 F 114 F 116 F 118 F 120 F 121 F 122 F 123 F 124 Tot al pl ant weight (g) 0. 49 0. 69 1. 15 18. 49 17. 44 8. 16 10. 33 0. 98 8. 37 5. 34 0. 37 5. 80 5. 84 34. 13 2. 04 1. 16 Wo od weight (g) 0. 31 0. 39 0. 99 7. 14 10. 23 5. 08 8. 90 0. 43 7. 69 4. 35 0. 36 2. 52 4. 54 25. 40 1. 29 1. 15 Volu m e ( L) 10 .00 10 .00 30 .00 20 .00 10 .00 20 .00 30 .00 20 .00 10 .00 2. 5 0 10 .00 10 .00 15 .00 10 .00 10 .00 10 .00 Cult
igens Comm
o n be an Ma iz e cupule Ma iz e ker nel 1 5 2 1 21 4 2 1 Che no pod 1 Knotwe ed 4 Squash ri nd 1 Su m pwee d 1 Frui
ts Bram
ble 23 Grape 2 1 Hawthorn 18 Ma y pop 1 Peach 5 178 11 50 41 Persi mm on 1 5 1 1 Nuts Acorn nut m eat Acorn she ll 7 3 1217 21 3 14 207 Hickory she ll 6 3 3 523 146 3 66 3 15 1 113 15 348 45 1 W alnut she ll 6 56 6 1 4 50 1 1 Mis cellaneou s Be arsfo ot 1 Be d straw 1 Blac k g um 1 Bulrush Nightsh ade 6 Pokewe ed 1 3 Nightsh ade f amily Unidenti fi ed 2 2 1 1 1
a Data adapt
Table 15. Standardized Jenrette Site Seeds Counts Recorded by Melton
F 152 F 153 F 157 F 158 F 170 F 210
Cultigens
Maize cupule 4.23 4.44 0.10 56.25 1.85 2.01
Maize kernel 2.11 8.89 0.01 0.37 0.69 2.01
Sumpweed 0.60
Fruits
Bramble 1.34
Grape 0.12 0.23
Maypop 0.23
Peach 0.02
Nuts
Acorn nutmeat 1.21 0.10 0.12 0.23
Acorn shell 29.91 13.41 2.33 4.63 1.34
Hickory shell 6.04 13.97 3.80 24.54 20.81
Walnut shell 0.74
Miscellaneous
Bean/persimmon 0.30
Bedstraw 0.12
Table 16 . Standardized Je nrett e Site Seed Coun ts Rec ord ed by Gre m illi on F 62 F 63 F 64 F 65 F 66 F 67 F 68 F 70 F 71 F 75 F 77 F 78 F 79 F 84 F 85 F 86 F 87 Cult
igens Comm
Table 16 . Standardized Je nrett e Site Seed Coun ts Rec ord ed by Gre m illi on (con tinued) F 90 F 91 F 92 F 95 F 96 F 98 F 99 F 113 F 114 F 116 F 118 F 120 F 121 F 122 F 123 F 124 Cult
igens Comm
Wood
Pit features from the Jenrette site that I analyzed do not demonstrate an unusual
abundance of structural remains. When wood weights are standardized by soil volume and log transformed, box plot analysis illustrates that all features exhibit similar values of wood density. The absence of outliers suggests that evidence of large structural remains is not apparent in flotation samples analyzed from the Jenrette site.
Figure 14. Box plot of wood weights for Jenrette site features.
Cultigens
Maize
Maize appears to have been present in greater relative abundance in features analyzed by me than in those analyzed by Gremillion. Raw counts reveal that maize cupule was rarely identified among features analyzed by Gremillion. Maize cupule is ubiquitous in features that I analyzed. Though the higher ubiquity of maize cupule in features analyzed by me could
of maize consumption debris. Features that I analyzed demonstrate a high prevalence of maize processing debris with maize kernel debris being ubiquitous and relatively moderate in amount.
Common Bean
Common bean is poorly represented at the Jenrette site. Two features analyzed by Gremillion, Features 79 and 84, contain few specimens identified as common bean.
Indigenous Cultigens
Indigenous cultigens present at the Jenrette site include: chenopod, knotweed, squash, and sumpweed. Similar to the Wall site, these cultigens are present in very small quantities. Although knotweed has the highest standardized count, only four seeds were identified from one context, suggesting a low prevalence overall. Sumpweed recovered from the Jenrette site
represents the most recent archaeological evidence of domesticated sumpweed in the Eastern Woodlands (Gremillion 1993a:382). Low quantities may represent minor investment in sumpweed cultivation at this site, or underestimated presence due to seed consumption.
Squash was not identified at the Wall site, but does appear in Jenrette contexts. Squash is present in two features, Features 75 and122. One fragment of squash rind was identified in each.\
Fruits
Indigenous Fruits
Bramble, grape, hawthorn, maypop, and persimmon all thrive in disturbed edge areas. Based on standardized counts, indigenous fruits appear to have contributed highly to the contents of Feature 90, located in the southeast plaza (Figure 15). However, the total plant weight of this feature is low and relative quantities of indigenous fruits may be over represented for this feature. An alternative explanation is that Feature 90 may represent a specialized deposit related to fruit processing or consumption activities.
Figure 15. Map identifying Feature 90 at the Jenrette site.
Peach
Introduced to Florida by Spaniards in the sixteenth century, peach spread quickly
an ideal habitat for peaches to such an extent that Lawson notes that: “A Peach falling to the Ground, brings a Peach-Tree that shall bear in three years, or sometimes sooner. Eating Peaches in our Orchards makes them come up so thick from the Kernel, that we are forced to take a great deal of Care to weed them out” (Lefler 1967:115; Gremillion 1993b:17). In contrast to fruits such as bramble and hawthorn which were usually more dispersed, peach trees often grew in dense arrangements that resembled orchards in the eyes of early European ethnographers (Gremillion 1993b:17).
The Jenrette site represents evidence of the role that peach played in Native subsistence during the historic period. Once peach was introduced after the occupation of the Wall site, it became more common than any other fruit. Standardized counts reveal high quantities of peach that are not typically associated with contexts having low values of total plant weight. The presence and density of peach at the Jenrette site is perhaps a reflection of intensive cultivation practices among site inhabitants.
Nuts
Three nut taxa, acorn, hickory, and walnut, were identified in the Jenrette site
Jenrette assemblage indicates that site inhabitants were utilizing acorn and hickory as staple resources. The importance of nuts at Jenrette could be linked to their long storage life, which allowed them to serve as crucial resources during periods of food scarcity.
Figure 16. Map identifying Feature 157 at the Jenrette site.
Miscellaneous
CHAPTER 7
INTER-SITE ANALYSIS
Statistical analysis builds upon site-specific assessments of plants from the Wall and Jenrette sites thereby facilitating the identification of temporal trends in pit function. In addressing possible functions of pits at the Wall and Jenrette site, spatial arrangement of pit features and evidence of foodways were considered. Correspondence analysis and box plots were used to examine the importance of specific plants in the overall subsistence base and demarcate outliers. Outliers in both of these analyses signify deposits for which one or few taxa constitute the majority of identified plants, and have the potential to represent large processing or cooking events perhaps on the communal level (VanDerwarker and Idol 2008; VanDerwarker et al. 2007). Features with no outliers and relatively even abundances of a wide range of taxonomic groups likely indicate evidence of generalized, domestic refuse.
Correspondence Analysis
Correspondence analysis is a statistical approach that has been used with
archaeobotanical data to provide indications of the most prevalently utilized resources by taking into account the abundance of a variety of taxa (Bush 2004; Hollenbach 2005; VanDerwarker 2010). Through spatially arranging observations according to two program-generated variables that reduce statistical noise by accounting for variance in the assemblage, correspondence analysis proves useful for defining patterns and identifying strong trends in the overall
differences in sample size. Certain taxonomic categories low in both ubiquity and counts (Common Bean, Indigenous Cultigens, Fruits, Miscellaneous) were excluded from this analysis to aid in interpretation.
Collectively, the two dimensions in the resulting correspondence analysis explain 85.2% of the inertia (variation) in the assemblage (Figures 17 and 18). Dimension 1, representing 55.8% of the overall inertia, has a high contribution value for maize cupule, which suggests that this dimension is largely representative of variation in maize (Table 17). Dimension 2 represents 29.4% of the overall inertia and contribution values appear to indicate a relationship between Dimension 2 and nutshell (acorn and hickory) (Table 17). Maize cupule, acorn shell, and hickory shell are responsible for explaining the majority of patterning present in the Wall and Jenrette assemblages.
Table 17. Metadata for Correspondence Analysis
Overall
Taxon Mass Quality % Inertia
Maize cupule 0.098 0.996 0.497
Maize kernel 0.010 0.031 0.150
Acorn shell 0.337 0.998 0.202
Hickory shell 0.555 0.998 0.151
Dimension 1 (55.8% total inertia)
Taxon Coordinate Squared Correlation Contribution
Maize cupule 2.655 0.995 0.886
Maize kernel 0.796 0.031 0.008
Acorn shell -0.248 0.073 0.026
Hickory shell -0.333 0.292 0.079
Dimension 2 (29.4% total inertia)
Taxon Coordinate Squared Correlation Contribution
Maize cupule 0.106 0.001 0.002
Maize kernel -0.096 0.000 0.000
Acorn shell -1.033 0.925 0.634
Figure 17. Correspondence analysis for Wall and Jenrette, features only.
Similar scores highlight site-level distinctions that are designated by clusters on each graph. Several Jenrette features, as well as a few disturbed Wall features (including the midden), cluster near the origin. This arrangement indicates that these three Wall features and seven Jenrette features exhibit relatively low scores on each dimension and may represent evidence of subsistence debris from a mix of taxonomic categories rather than more heavily emphasizing maize and nut processing debris. This trend is largely reinforced by raw counts. However, Feature 157 has high standardized acorn and hickory values that cause it to have a value near the origin (-0.343) on Dimension 2 in the correspondence analysis. Although Feature 157 plots near the Wall site midden, this feature appears to rich in nut processing refuse. Three Wall features and five Jenrette features correlate with acorn shell. Two Wall features (Features 1-84 and 79) as well as one Jenrette feature (Feature 158) correlate with maize cupule and have low values on Dimension 2. Lastly, a large cluster of features from both sites plots near hickory shell.
The correspondence analysis demonstrates that certain features are largely composed of acorn, hickory, maize kernel, or maize cupule. However, those that have high scores in
taxon. The relative amount of a strongly correlated taxon represented in each feature will be revealed in greater detail through the use of box plots. Features that are statistical outliers will be discussed in relation to their spatial position.
Box Plots
Box plots are useful in differentiating trends in feature composition as one can easily isolate outliers in a single variable and provide evidence of statistical significance. Statistically significant differences reveal distinctions in pit composition and function. Examining whether the site-specific trends demonstrated in the correspondence analysis are statistically significant when compared to values for the other site will inform understandings of the dependability of these trends. Box plots with notches to indicate medians will be used to achieve this goal. If the notches on two box plots do not overlap, these groups are significantly different at a 95% confidence interval (0.05 significance level) (Velleman and Hoaglin 1981:73-74). All box plots presented in this chapter reflect counts of taxa standardized by total plant weight (TPW) or comparison ratios relating counts of two different variables. These box plots have been log transformed to improve readability.
Maize kernel is centrally located in the correspondence analysis, indicating that this taxon was often present in features that demonstrated a mix of other taxa. In order to better assess differences between sites, standardized values of maize kernel for each site were evaluated (Figure 19). The box plot suggests that maize consumption debris was deposited in greater quantities at the Wall site, though this discrepancy is not statistically significant at a 95%
weight for this feature is low. Contrary to its position on the boxplot, Feature 113 does not appear to signify a maize cooking or storage accident.
Figure 19. Box plots of maize kernel counts standardized by total plant weight.