Designing an integrated relief pre-positioning network with
perishable commodities
Mina Akbarpour
1, S. Ali Torabi
1*, Ali Ghavamifar
11
School of Industrial Engineering, College of Engineering, University of Tehran, Tehran, Iran [email protected], [email protected], [email protected]
Abstract
In this paper, a bi-objective model is proposed for designing a pre-positioning network of pharmaceutical supplies considering their limited shelf-life. The presented model aims to consider both cost efficiency and responsiveness by minimization of total cost and the maximum amount of unmet demand under uncertainties in demand and supply sides’ data. Moreover, for effective distribution of relief supplies in the post-disaster phase, multiple coverage levels are incorporated. The bi-objective model is solved by the well-known ε-constraint method and some numerical experiments are developed to explore the applicability of the presented model. The results indicate the impact of considering perishability of the pharmaceutical supplies as well as considering multiple coverage levels for satisfying demand on the total cost and responsiveness of the relief network.
Keywords:
Pharmaceutical supplies, relief pre-positioning network, multiple coverage levels, perishability1-Introduction and related literature
Devastation and fatality rate of natural disasters (such as earthquakes, hurricanes or tornados) enforce governments to prepare themselves for dealing with such unexpected events (Rawls and Turnquist,, 2010). The irreparableeffects of disasters highlights the significance of applying a proper preparedness plan to decrease mortality rate and financial losses. As a disastrous situation is highly uncertain, designing a pre-positioning network especially for emergency supplies could shorten the response time, minimize the casualties, and maximize the accessibility of emergency medical services (Tofighi et al., 2016).
The main decisions taken in designing a pre-positioning network are determining the location and capacity of warehouses as well as the inventory level of pre-positioned supplies needed for timely response. Also, in a business view, the advantages of pre-positioning relief supplies are achieving the more appropriate price for supplying the emergency medical items using economies of scale (Rawls and Turnquist,, 2012).
Relief items mostly needed after a disaster occurs including shelters, water, food, medical commodities, clothes, etc. (Rezaei-Malek et al., 2016).
*Corresponding author
ISSN: 1735-8272, Copyright c 2018 JISE. All rights reserved
Journal of Industrial and Systems Engineering
Vol. 11, Special issue:
14th International Industrial Engineering Conference
Summer (July) 2018, pp. 109-119
(IIEC 2018)
TEHRAN, IRAN
Pharmaceutical supplies play an important role at post-disaster among different types of medical supplies (e.g. blood, medical kits and pharmaceutical items). The advent of nutritional and health problems after a disaster may cause different diseases to the affected people.
The more pharmaceutical supplies are available, the more population can be rescued in the response phase. Perishability of pharmaceutical items makes the pre-positioning of these items more complex (Hogan, 2007). Accordingly, this study aims to design a pre-positioning network for pharmaceutical supplies in the preparedness phase along with determining the tentative distribution plan of pharmaceutical items in the post-disaster phase to respond to emergency demands in an effective and efficient way. Moreover, two-stage stochastic programming is applied as a common approach to deal with the random uncertainties in the pre and post-disaster phases concurrently.
Recently, pre-positioning of emergency supplies has been studied in the literature by different practitioners and researchers. Investigating the literature indicates that in a majority of the studies, minimizing costs (cost efficiency) is considered as the main objective function ((Tofighi et al., 2016), (Rawls and Turnquist,, 2012), (Rezaei-Malek et al., 2016), (Zahiri et al., 2017) and (Jabbarzadeh et al., 2014); while in some studies maximizing responsiveness is also considered (Noyan , 2012), (Samani et al., 2018) and (Barzinpour et al., 2014). To the best of our knowledge, there are a few studies in the area of pre-positioning network design which have focused on perishable items. The most relevant study is presented by Rezaei-Malek et al. (2016) in which a multi-objective model is proposed for pre-positioning of perishable relief supplies considering fixed time windows. They have integrated location-allocation and ordering decisions at pre-disaster phase with those decisions related to relief distribution at post-disaster[4]. In a more recent study, Samani et al. (2017) presented a blood supply chain planning model for disaster relief, which accounts for perishability of blood and data uncertainty. They proposed a multi-objective mixed integer linear programming model with the aim of cost efficiency, responsiveness and effectiveness (Samani et al., 2018).
In this paper, a mixed integer programming approach is proposed for designing an integrated relief pre-positioning and distribution network for perishable pharmaceutical supplies. The main contributions of our study are designing a prepositioning network for pharmaceutical items considering the perishability of these supplies and multiple coverage levels for allocating the rescue centers to demand zones.
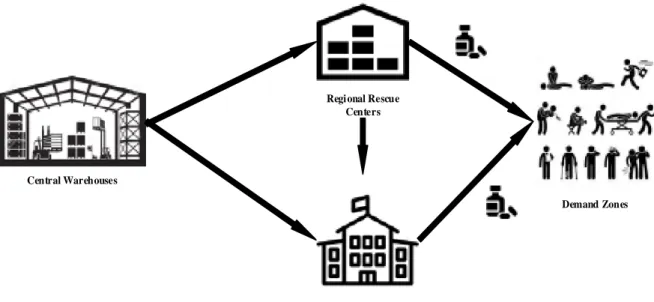
2-Problem description
This study presents a location-allocation model for pre-positioning of pharmaceutical supplies for disaster response. The relief pre-positioning network under study (see figure 1) includes multiple central warehouses (CWs), multiple regional and local rescue centres (RRCs and LRCs, respectively), and some demand zones (DZs) each of which with a specific population. CWs are considered as the high-capacity warehouses which can be located in the suburbs while RRCs are the regional distribution centres inside the town and LRCs are the local distribution centres like schools, mosques, etc. with lower capacity than RRCs to distribute supplies between different DZs in a shorter time. We develop a two-stage stochastic programming model to determine the locations of CWs, RRCs and LRCs, the allocation of RRCs to CWs, and their inventory levels at pre-disaster phase (i.e. the first-stage decisions) while the allocation of DZs to RRCs and LRCs, the unused inventory levels at different facilities, and the distribution flow amounts are the post-disaster decisions (i.e. the second-stage decisions). It should be noted that multiple coverage levels are applied in order to allocate the DZs to RRCs and LRCs to receive pharmaceutical supplies. Accordingly, the fraction of demand for a DZ that can be satisfied is decreased by a step function based on its distance from the allocated distribution centre. There are p coverage levels,𝛿𝛿𝑝𝑝 shows the p-th coverage radius from the demand zone (𝛿𝛿0 <𝛿𝛿1<𝛿𝛿2 <⋯<𝛿𝛿𝑝𝑝). When the demand of DZ i is demonstrated by Di , fpDi shows a fraction of the demand of DZ i which is satisfied by the rescue centre located in interval (𝛿𝛿𝑝𝑝−1,𝛿𝛿𝑝𝑝) (Murali et al., 2012).
The other assumptions of this study are as follows:
• There is a priority for distribution of each pharmaceutical item.
• Pharmaceutical items are divided into two types: critical and non-critical ones. Critical pharmaceutical items are the ones which are vital in the first hours of a disaster to rescue the
lives of the affected people.
• Unmet demand is considered for post disaster phase (when the network cannot satisfy all the demands) with a given penalty cost.
• In the pre-disaster phase the planning horizon is considered six periods and the length of each time period is four months, but for the post-disaster phase just initial hours are considered. • For a pharmaceutical item with a shelf-life more than its remaining shelf-life of purchasing
( 𝜃𝜃𝑘𝑘 ), purchasing is allowed and when the shelf-life of a pharmaceutical item passes its remaining shelf-life of selling ( 𝛾𝛾𝑘𝑘), it should be sold.
Central Warehouses
Regi onal Rescue Centers
Demand Zones
Local Res cue Centers
Fig 1. The network of this study
3-Mathematical formulation
In this section, a two-stage stochastic bi-objective model is proposed.
3-1-Nomenclature
Sets and indices:
i Set of Central Warehouses
i
∈
{
1, 2,..., I}
r
Set of Regional Rescue Centersr
∈
{
1, 2,..., }
R
l Set of Local Rescue Centers
l
∈
{
1, 2,..., }
L
j Set of Demand Zones
j
∈
{
1, 2,..., }
J
k Set of pharmaceutical items ' ''
{
,
1, 2 ,...,
}
K
=
k
∪
k K
∈
AP
=
K
'
k
Set of critical pharmaceutical items k'∈CP ={1, 2,...,K'}''
k
Set of non-critical pharmaceutical items k'' ={A P} / {CP}s
Set of disaster scenarios s∈{1, 2,..., }St Set of time periods at pre-disaster phase t∈{1, 2,..., }T
p Coverage levels p∈{1, 2,..., }P
k
h Set of remaining shelf-life of pharmaceutical item k hk ∈{1, 2,..., H }k
Parameters:
c i
f
Fixed cost of opening a CW with capacity levelc
in candidate locationic r
g
Fixed cost of opening a RRC with capacity levelc
in candidate locationr
l
e
Fixed cost of opening a LRC in candidate location lpr
fr
Fraction of demand at DZ j that can be satisfied by RRC r in the interval of(
δ
p−1,
δ
p)
pl
fl
Fraction of demand at DZ j that can be satisfied by LRC l in the interval of(
δ
p−1,
δ
p)
p
δ
Radius of p−th coverage level kH Shelf-life of pharmaceutical item k k
kh
pc
Cost of purchasing for pharmaceutical item k withk
h remaining shelf-life
k
kh
sp
Selling price of pharmaceutical item k withk
h remaining shelf-life
k
θ
Remaining shelf-life of pharmaceutical item k for purchasing kγ
Remaining shelf-life of pharmaceutical item k to remove from the warehouses for sellingik
hcw
Unit holding cost of inventory for pharmaceutical itemk at CW irk
hcr
Unit holding cost of inventory for pharmaceutical itemk at RRCr
c
sw Storage capacity of a CW with capacity level
c
csr Storage capacity of a RRC with capacity level
c
kv Unit storage capacity required for pharmaceutical item k
l
ω
Capacity of LRC ls k
ic
Unit inventory cost for unused pharmaceutical item k under scenarios
s irk
cr Unit transportation cost for pharmaceutical item k from CW i to RRC r under scenario s
s ilk
cl Unit transportation cost for pharmaceutical item k from CW i to lRC l under scenario s
s rlk
crl Unit transportation cost for pharmaceutical item k from RRC r to LRC l under scenario s
s rjk
crd Unit transportation cost for pharmaceutical item k from RRC r to DZ j under scenario s
s ljk
cld Unit transportation cost for pharmaceutical item k from LRC l to DZ j under scenario s
kj
π
Important weight of pharmaceutical item k at DZ js kj
de
Amount of demand for pharmaceutical itemk at DZ j under scenarios
rj
dr
Distance between RRCr
and DZ jlj
dl
Distance between LRC l and DZ js
pos
Probability of occurrence scenarios
Decision variables:c i
X
1, if a CW with capacity levelc
is located at candidate locationi ; 0, otherwise.c r
Y
1, if an RRC with capacity levelc
is located at candidate locationr;0, otherwise.3-2-Objective functions
The first objective function aims to minimize the total cost including fixed costs and operational costs in the pre and post disaster phases. The pre-disaster costs consist of the fixed cost of opening CWs, RRCs and LRCs (FC), cost of selling and purchasing (SPC), which is related to the remaining shelf life of pharmaceuticals and holding cost of pre-positioned supplies (HC). The post disaster costs include the transportation costs between the echelons for distribution of pharmaceutical supplies (TC) and the cost of unused inventory in the CWs and RRCs (UC).
FC (Fixed cost of establishment) =
, ,
c c c c
i i r r l l
i c r c l
f X + g Y + e Z
∑
∑
∑
(1) (1)SPC (Selling and Purchasing costs) =
, , 1
( - )
k k
k k k k
k k k
H
kh kith kh kith
k i t h h
pc Q sp O
γ
=θ =
∑ ∑
∑
(2)As mentioned in equation (2) for the pharmaceutical items which have a remaining shelf life more than 𝜃𝜃𝑘𝑘, purchasing is allowed and if the shelf life of pharmaceutical item is less than 𝛾𝛾𝑘𝑘 it should be sold.
HC (Holding cost of pre-positioned supplies) =
, ,
( ) ( )
ik ik rk rk
i k r k
hcw a + hcr b
∑
∑
(3)Holding cost includes the costs of holding pre-positioned supplies in CWs and RRCs. TCs (Transportation cost)
=
, , , , , , , , , ,
s s s s s s s s s s
irk irk ilk ilk rlk rlk rjk rjk ljk ljk
i r k i l k r l k r j k l j k
cr W R + cl W L + crl RL + crd RD + cld LD
∑
∑
∑
∑
∑
(4)l
Z
1, if an LRC is located at LRC l;0, otherwise.ik
a
Amount of pharmaceutical itemk held at CWirk
b
Amount of pharmaceutical itemk held at RRCr
s irk
W R
Amount of pharmaceutical item k sent from CWi to the RRCr
under scenarios
s ilk
W L
Amount of pharmaceutical item k sent from C to the LRC l under scenarios
s rlk
RL Amount of pharmaceutical item k sent from RRC r to the LRC l under scenario
s
srjk
RD
Amount of pharmaceutical item k sent from RRCr
to DZ j under scenarios
s ljk
LD
Amount of pharmaceutical item k sent from LRC l to DZ j under scenarios
k
kith
Q
Amount of pharmaceutical item k that is purchased for CWi at time period t with kh remaining shelf-life
k
kith
O
Amount of pharmaceutical item k from CWi that is sold at time period t withk
h
remaining shelf-life s
ki
UW
Quantity of unused inventory of pharmaceutical item k in CW i under scenarios
s kr
UR
Quantity of unused inventory of pharmaceutical item k in RRCr
under scenarios
sjk
LS Unmet demand of pharmaceutical item k for DZ j under scenario s k
kith
IL
Inventory level of pharmaceutical item k in the CW i at time period twithk
h
Transportation costs are calculated for post-disaster distribution of pharmaceutical supplies between the echelons of the network.
UCs (Unused inventory cost) =
(
kis krs)
ksk i r
UW
+
UR
ic
∑ ∑
∑
(5)The cost calculated in Eq. (5) is for the amount of inventory which was not used in the response phase of a disaster in CWs and RRCs.
Therefore, the first objective function can be abbreviated as equation (6).
1
Z
Min
=
FC + SPC + HC + s(
s s)
s
pos TC
+
UC
∑
(6)Furthermore, the second objective function equation (7) minimizes the maximum unmet demand in each demand zone for each pharmaceutical item.
(
)
2
,
max s
s kj jk
k j s
Z pos L
Min =
∑
π
S (7)3-3- Constraints
The objective functions introduced in Section 3.2 are subject to the following constraints.
1
c i c
X
≤
∑
∀i (8)1
c r c
Y
≤
∑
∀r (9)Constraints (8) and (9) state that at each available site for pre-positioning, at most one facility with a specific capacity level can be located.
c
k ik c i
k c
v a
≤
sw X
∑
∑
∀i ((10)c
k rk c r
k c
v b
≤
srY
∑
∑
∀r ((11)Constraints (10) and (11) consider capacity restriction of CWs and RRCs, respectively.
s s
irk ilk ik
r l
W R
+
W L
≤
a
∑
∑
∀i k,(12) Constraint (12) implies that the flow of supplies delivering from each CW to RRCs and LRCs cannot be more than the pre-positioned amount of its pharmaceutical items.
s c
irk c r
i c
W R
≤
srY
∑
∑
∀r k, (13)Constraint (13) ensures that a RRC can receive items if it was established and the amount of items received by each RRC from CWs should be less than the storage capacity of that RRC.
s s s
rjk rlk kr irk
j l i
RD
+
RL
≤
b
+
W R
∑
∑
∑
,
r k
∀ (14)
Constraint (14) states that the amount of supplies delivered from each RRC to LRCs and DZs should be less than the pre-positioned amount of supplies in this RRC plus the receiving amount of supplies from the CWs. In other words, this constraint shows the flow balance at each RRC.
s s
rlk ilk l l
r i
RL
+
W L
≤
Z
∑
∑
ω
∀l k,(15) Constraint (15) ensures that a located LRC can receive items from CWs and RRCs.
s s s
rlk ilk ljk
r i j
RL + W L ≥ LD
∑
∑
∑
(16)Constraint (16) indicates the flow balance of items at each LRC.
-1
, |
(
)
p rj p
s s
rjk pr kj
k r dr k
RD
fr
de
< ≤
≤
∑
∑
δ δ ∀j p, (17)
-1
, |
(
)
p lj p
s s
ljk pl kj
k l dl k
LD
fl
de
< ≤
≤
∑
∑
δ δ
∀
j p
,
(18)s s s s
rjk ljk jk kj
r l
RD
+
LD
+
LS
=
de
∑
∑
∀j k, (19), |
0
rj p
s rjk k r dr
RD
>
=
∑
δ ∀j p, (20)
, |
0
lj p
s ljk k l dl
LD
>
=
∑
δ ∀j p, (21)
Constraints (17)-(21) are for assigning DZs to RRCs and LRCs located in different coverage bound of each DZ. The amount of unmet demand which was used in the second objective function is calculated by constraint (19).
s s s
ilk irk ki ik
l r
W L
+
W R
+
UW
≥
a
∑
∑
∀
i k
,
(22)s s s
rjk rlk kr rk
j l
RD + RL +UR ≥b
∑
∑
,
r k
∀
(23)Constraints (22) and (23) guarantee that the amount of pharmaceutical items delivered from each CW and RRC to LRCs, respectively; cannot be more than their prepositioned amount of pharmaceutical items.
k k
kith kith
O ≤IL
, ,
{2,..., },
k{1,...,
k}
k i t
T
h
∀
∈
∈
γ
(24)Constraint (24) implies that the amount of pharmaceutical items which is sold cannot be more that the inventory level of pharmaceutical items at each time period before happening the disaster.
1k-1 k k
kit h kith kith
IL + =IL −O
, , {2,..., }, k {1,..., k}
k i t T h
∀ ∈ ∈
γ
(25)-1 1
k k k
kith kith kit h
IL =Q +IL + , , {2,..., }, { ,..., }
k k k
k i t T h H
∀ ∈ ∈
θ
(26)Constraints (25) and (26) are for balancing the pre-positioned inventory.
,
l k
1
k k k
H
kith ik h
IL a
=
=
∑
1,
,
t
= ∀
i k
(27)1
k k k
H
kith ik h
IL a
=
≤
∑
, ,
t i k
∀ (28)
Constraint (27) implies that the inventory level at the first time period is equal to the prepositioned amount of items and constraint (28) ensures the inventory level at all time period should not be more than the prepositioned amount.
4-Numerical results
A set of data is generated randomly as shown in table 1 to evaluate the applicability of the presented model. First of all, the confliction of the two objective functions and the tradeoff between them is investigated. Then, some sensitivity analyses are performed from which useful managerial insights are drawn. It should be mentioned that all the numerical experiments are done by GAMS software version 24.8.3 and the code is implemented on a standard core i7 PC with 2.40 GHz and 8.00 GB RAM.
Table 1. The features of a dataset
I R L J K C P hK
3 4 5 6 4 3 3 20
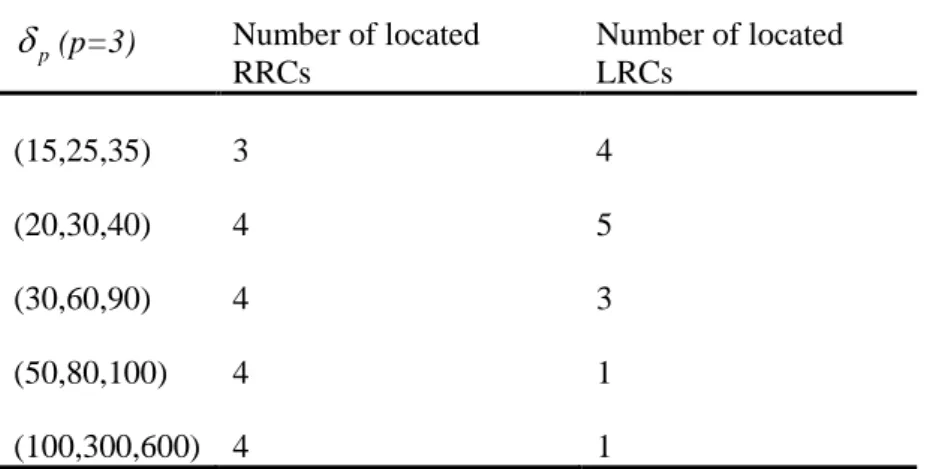
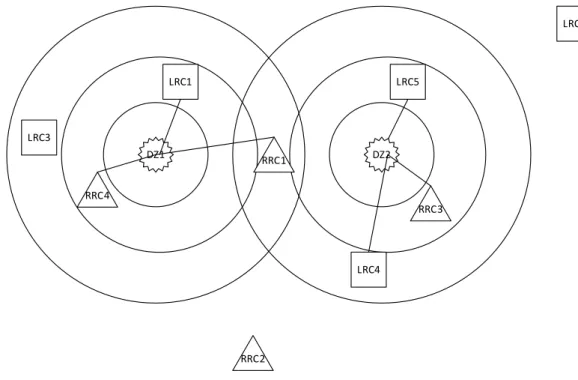
By applying the dataset as mentioned in table 1, an example of the results for allocating two demand zones to RRCs and LRCs, located in multiple coverage bounds around the demand zones, is demonstrated in figure 2. The number of located facilities for RRCs and LRCs depends on the radiuses of coverage levels. Table 2 shows the number of located facilities when radiuses of coverage bounds are changed.
Table 2. Number of located rescue centres based on the coverage bound radius
p
δ
(p=3) Number of located RRCsNumber of located LRCs
(15,25,35) 3 4
(20,30,40) 4 5
(30,60,90) 4 3
(50,80,100) 4 1
(100,300,600) 4 1
For solving the bi-objective model proposed in this paper by ε-constraint method, the minimization of total cost is considered as the primary objective and the second objective function (minimization of the maximum amount of unmet demand) moves to the constraints and then an upper bound is
considered for it. To demonstrate how the two objective functions in this model are in conflict with each other, the trade-off surface between them is illustrated in figure 3.
DZ1 RRC1 DZ2
RRC4
RRC3
LRC1 LRC5
LRC3
LRC4
RRC2
LRC2
Fig 2. An example of allocation in the coverage bounds of DZs
Fig 3. Trade-off surface between the two objective functions
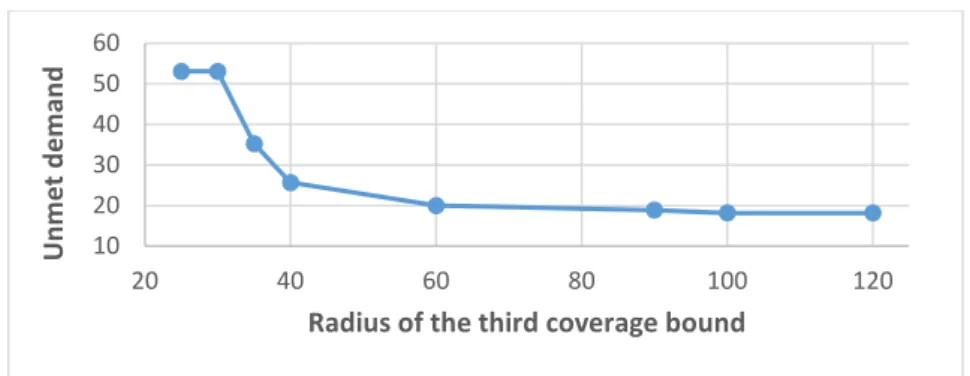
To find the effect of changing radius of coverage bound of each demand zone on the second objective function, the radius of the third coverage bound as the biggest coverage bound gets different amounts and its influence on the unmet demand value is demonstrated in figure 4. As this figure shows, by increasing the radius of the coverage bound, the unmet demand decreases because in this situation the more facilities are located in coverage bounds of the demand zone and the amount of its satisfied demand increases.
0 10 20 30 40 50 60
0 500 1000 1500 2000 2500
U
nme
t d
ema
nd
Fig 4.The impact of radius of the coverage bound on the second objective function
5- Conclusion
The uncertain nature of disasters makes the humanitarian relief planning more complicated. Also, the urgent need for relief items at the time of occurring disaster highlights the need of designing an efficient and also responsive humanitarian relief chain. Pre-positioning of emergency supplies, especially pharmaceutical items which are vital in the response phase, play an important role in the preparedness phase. For pharmaceutical items because of their perishability the nature of the pre-positioning is different from the nature of other supplies. In this study, a bi-objective model was applied for pre-positioning of pharmaceutical supplies in the pre-disaster phase and distribution of these items in the post-disaster phase. The aim of the study is minimization of total cost and minimization of the maximum amount of unmet demand. For allocating the rescue centers to different demand zones, multiple coverage bounds were considered. The bi-objective model was solved by ε-constraint method and the conflicting behavior between the two objective functions was shown. It is concluded that changing the coverage radius highly affects the second objective function (i.e. minimization of maximum unmet demand).
References
Barzinpour, F., Saffarian, M., Makui, A., & Teimoury, E. (2014). Metaheuristic algorithm for solving biobjective possibility planning model of location-allocation in disaster relief logistics. Journal of Applied Mathematics, 2014.
Hogan, D. (2007). E., and Jonathan L. Burstein.“Disaster Medicine.”
Jabbarzadeh, A., Fahimnia, B., & Seuring, S. (2014). Dynamic supply chain network design for the supply of blood in disasters: a robust model with real world application. Transportation Research Part E: Logistics and Transportation Review, 70, 225-244.
Murali, P., Ordóñez, F., & Dessouky, M. M. (2012). Facility location under demand uncertainty: Response to a large-scale bio-terror attack. Socio-Economic Planning Sciences, 46(1), 78-87. Noyan, N. (2012). Risk-averse two-stage stochastic programming with an application to disaster management. Computers & Operations Research, 39(3), 541-559.
Rawls, C. G., & Turnquist, M. A. (2012). Pre-positioning and dynamic delivery planning for short-term response following a natural disaster. Socio-Economic Planning Sciences, 46(1), 46-54. Rawls, C. G., & Turnquist, M. A. (2010). Pre-positioning of emergency supplies for disaster response. Transportation research part B: Methodological, 44(4), 521-534.
Rezaei-Malek, M., Tavakkoli-Moghaddam, R., Zahiri, B., & Bozorgi-Amiri, A. (2016). An interactive approach for designing a robust disaster relief logistics network with perishable
10 20 30 40 50 60
20 40 60 80 100 120
U
nme
t d
ema
nd
Radius of the third coverage bound
commodities. Computers & Industrial Engineering, 94, 201-215.
Samani, M. R. G., Torabi, S. A., & Hosseini-Motlagh, S. M. (2018). Integrated blood supply chain planning for disaster relief. International journal of disaster risk reduction, 27, 168-188.
Tofighi, S., Torabi, S. A., & Mansouri, S. A. (2016). Humanitarian logistics network design under mixed uncertainty. European Journal of Operational Research, 250(1), 239-250.
Zahiri, B., Torabi, S. A., & Tavakkoli-Moghaddam, R. (2017). A novel multi-stage possibilistic stochastic programming approach (with an application in relief distribution planning). Information Sciences, 385, 225-249.