Introduction
In 2011 approximately 49 million Americans were uninsured.1 Among these uninsured Americans, 45% are White, 33% are Hispanic, 16% are African American, and 6% are Asian.1 The majority of the uninsured, 60%, have at least one full-time worker in their family. Their jobs
are more likely to be “low-wage or blue-collar jobs” and therefore, are less likely to provide
insurance coverage through an employer.2
Uninsured patients are three times more likely to not have a regular source of care than
insured patients.3 Uninsured patients have to pay for medical services out of pocket. Medical services are so expensive that uninsured patients have to pay over an extended period of time or
end up not paying at all.4 The service providers which are able to sustain a large amount of uninsured patients are large practices and hospitals.3 When hospitals act as the main source of care for the uninsured population, patients lack access to care because of the limited number of
hospitals available in many communities. Patients who use hospitals for routine care also
experience less coordination of care because the patient may see a different doctor each time he
or she visits the hospital.
This lack of access to care causes many uninsured patients to forgo care and receive
fewer preventative services, leading to poor health outcomes.2 Fewer preventative services mean that there is less of a chance that health conditions can be caught early and treated before it
becomes a larger issue.5 This results in poor health outcomes for patients and increases patients’ likelihood of being hospitalized for conditions that might have been avoided with proper care.6
Those without health insurance have to pay all health care costs out of pocket and these
not including any tests.7 Since many uninsured patients cannot afford such visits, they often go to an emergency room where physicians are required by law to treat them regardless of their ability
to pay.8 As a result, many uninsured Americans with problems that could easily be treated by primary care physicians go to an emergency room for care.9
Adult emergency room visits are also expensive costing approximatley $580 to $700, not
including tests.7 Not only does going to an emergency room for primary care not provide
continuous care to the patient, but the uninsured patient often cannot pay for the expenses. In the
end, the hospital covers the medical bill for the uninsured patient. This affects healthcare as a
whole because in order for a hospital to make a profit it charges more money for other services.10 Occasionally, this extra charge does not make up the difference and can lead to the closure of the
emergency room.11 Thus, the presence of large numbers of uninsured patients in a community ultimately can further reduce access to care in that community through reducing the availability
of emergency services for all residents.
Apart from hospitals, people with no insurance can receive care through safety net
providers such as health departments and free clinics. There are approximately 1,200 free clinics
in the United States today. Free clinics offer uninsured patients an outlet to receive primary care
through paid and volunteer staff, allowing patients to avoid the emergency room. Free clinics are
normally funded through private donations and grants.12
Problem Statement
An example of a free clinic that provides primary care to uninsured patients in a specific
community is Samaritan Health Center (SHC) in Durham, North Carolina. SHC is located in two
provide quality care to all patients at no cost. In order to be a patient at SHC, you must live in
Durham County, have no insurance, and make an income of 200% below the federal poverty
line. The Samaritan Health Center aims to provide quality and effective care to all of their
patients.13
This evaluation stems from the desires of the executive directors to analyze the overall
patient satisfaction with a focus of staff attention to patients, understanding of diagnosis and
medicine provided, and the quality of medical care at SHC. The evaluation will also assess the
degree to which the clinic deters patients from using the ER for routine primary care. The
evaluation will address the following questions:
1. How satisfied are the patients at SHC with the quality of care they are
receiving?
2. To what degree does SHC deter patients from using the emergency room for
routine primary care?
Samaritan Health Center Description
In the early 1990’s Dr. Mark Piehl had a dream that he shared with a small group of
friends; he wanted to establish a Christian health clinic in downtown Durham. In 2007, after
many years of working and planning, a Board of Directors was called together to commit to
building a “faith-based, volunteer-driven clinic” called Samaritan Health Center.14
SHC first opened its doors for patients in January 2009 at the Knox Street Clinic on the
fourth floor of the Durham Rescue Mission. At its start, SHC had one full-time staff member:
administrative assistants, the clinic was only open on Thursday nights to Durham Rescue
Mission residents. By August 2010, the clinic was reaching full capacity and was able to hire a
full-time Operations Manager and part-time doctor. After hiring a part-time doctor, SHC opened
its doors to the public, enabling them to provide continuous, reliable care to the Durham
community. Knox clinic then opened on Wednesday afternoon, Thursday night, and one
Saturday each month. Knox clinic also has two part-time dental staff members. In 2012 SHC
opened its second clinic on Garrett Road in Southwest Durham. The Garrett Road clinic is open
four days per week and has three part-time staff members, including a front-desk supervisor,
physician, and nurse.15
SHC is governed by a 12 member Board of Directors, led by president and founder Dr.
Mark Piehl. Each member position is a three year term with a renewal option, leading to little
board turn-over since SHC began. As of right now, the Board consists of doctors, volunteers, and
others who are invested in the future of SHC. Most of the members have been self-nominated.
Upon nomination, each candidate goes before the Board and the existing members vote to elect
the nominee to sit on the Board. SHC is primarily funded by private donations, church donations,
and some grants. SHC receives medical donations from LabCorp, Durham Radiology (five basic
exams a month and two expensive exams), and Greensboro Pathology ($10,000 worth of service
a year).15
Garrett Road clinic is where this project is focused. Garrett Road clinic is located in
Southwest Durham and provides medical and lab care four days a week for five hours each day.
This location is directly beside Oak Creek Apartments and has a large Hispanic clientele which
Literature Review
The Uninsured, Access to Care, and Health Outcomes
Americans who do not have health insurance are generally required to pay for their
healthcare out-of-pocket.3Since healthcare is very expensive, those who are uninsured cannot afford to have a medical home. Not having a constant medical home leads to poor continuity of
care and poor preventative care which in turn leads to poor health outcomes.2
Since uninsured patients often cannot pay for the services which are provided, those
without insurance have to see a doctor wherever they are able to do so. Overall, uninsured
Americans do not feel as if they have a say in where they are able to seek care.16 Those without insurance are far more likely to identify a facility rather than a person as their regular source of
care.17 Facilities do not offer one specific doctor for each patient, instead they have patients see whichever doctor is available at the time. This does not allow patients to establish long-term
relationships with a single doctor, providing less coordination of care which then leads to less
efficient care. One in five uninsured adults said they have been given a duplicate medical test,
which is twice the rate of duplication for insured adults.16 The IOM estimates that the total costs from reduced productivity and lost years of life as a result of being uninsured is $65 to $130
billion each year.10 Duplication and error drives increases in healthcare costs for the patient and the healthcare system overall.18
The lack of access to care causes uninsured patients to forgo care and receive fewer
preventative services which can in turn lead to poor health outcomes.2 Preventative services have evolved over time and become a standard part of medical practice, but uninsured patients have
that 48% of uninsured women (50-64) had a mammogram in the year before the study compared
with 75% of insured women.16 In the same study there was a 36% spread between uninsured and insured men ages 50-64 for colon cancer screenings.16 Due to high costs, uninsured populations are not as likely to fill their prescription or see a specialist when needed to prevent an illness and
are more likely to skip any medical test, treatment, or follow-up.16 Preventative services are essential because with them there is a greater chance that a poor health condition can be caught
early or helped before it becomes a larger issue.5 Therefore lack of preventative services increases patients likelihood of being hospitalized for conditions that might have been avoided
with proper care.6 Lack of continuous care and lack of preventative care results in poor health outcomes for uninsured patients.
The High Costs of Unnecessary Emergency Room Care
Many uninsured patients who cannot afford a medical home are forced to visit the
emergency room for routine healthcare issues and inappropriate conditions.20 As a result, many uninsured Americans with problems that could easily be treated by primary care physicians go to
an emergency room for care. In 2011, 80% of American adults who visited the emergency room
did so because they believed that no other provider was accessible. Of that 80% of emergency
room patients, 62% of those patients were uninsured.21 Thirty-five percent of uninsured adults went to the emergency room or hospital in the past year for management of a chronic condition,
double the amount of insured patients that came for chronic care management.16 Chronic condition management is something that can be managed at a primary care facility and does not
Emergency rooms are required to treat a patient in order to sustain an emergency.22 Furthermore, depending on hospitals funding and mission, many emergency rooms across the
United States are required to treat all patients regardless of their condition or ability to pay for
the services.23 Emergency rooms treating patients for routine issues and inappropriate conditions are very expensive for the hospital.7
Since many patients cannot pay, large practices and hospitals are some of the only service
providers which are able to incur the costs because uninsured patients are able to pay
approximately 7% of the healthcare costs that they incur.24 Adult emergency room visits are expensive, costing up to $700, not including any tests.7 Not only does going to an emergency room for primary care not provide continuous care to the patient, but the uninsured patient often
cannot pay for the expenses. Although, the hospital receives an amount of money in public
subsidies for this loss, for the most part they do not receive reimbursement.10 There is also a large administrative fee for tracking down patients and continually sending patients billing
notices. If a patient does not pay, then the hospital can eventually write it off as bad debt, but this will stay with the patient’s medical record and credit report for up to seven years.10
An estimated
$35 billion is provided annually for uncompensated healthcare services for uninsured patients.10 This high cost is leading to poor health outcomes for the uninsured population and for the greater
population.
This system of payment affects healthcare as a whole because in order for a hospital to
stay in business it is forced to charge more money for other services.10 It can also threaten the solvency of hospitals and lead them to cease to offer emergency services. For example, more
than 60 hospitals in California closed their emergency rooms because of the significant amount
system as a whole because emergency rooms are closing. Therefore, if an emergency happens
then there are a smaller amount of locations that provide care and the hospitals which remain in
business become overcrowded. This causes longer wait times, high stress levels for staff
members, and rushed patient interaction for all patients, with or without insurance. All of these
short-term consequences lead to a long-term consequence of decreased quality of care for all
patients. This decreased quality of care leads to poor health outcomes for those who seek care in
emergency rooms.25
Free Clinics as a Community Solution
Free clinics are a safety-net resource where people with no insurance can seek care in lieu
of the emergency room. A free clinic is defined by the National Federation of Free and
Charitable clinics as a “safety-net health care organization that utilize a volunteer/staff model to
provide a range of medical, dental, pharmacy, vision, and/or behavioral health services to economically disadvantaged individuals.”26
A free clinic is a 501(c)(3) tax-exempt organization.
In order to be classified as a free clinic the patients must not be charged or be charged a nominal
fee on a sliding scale for the services provided. Seventy-eight percent of free clinics do not
charge at all for their services.27 Most free clinics offer primary, acute, preventative, or urgent care services to indigent populations and minority groups, specifically the uninsured,
working-class poor, immigrants, and homeless populations.12
Free health clinics originated in the late 1960s after the passing of the welfare reform
legislation of 1965. This legislation established Medicaid and Medicare for the public.28 Free-standing free clinics saw a dramatic increase in the 1970s because the legislation of the time was
approximately 1,200 free clinics across the United States provide six million patient visits each
year.12
Free clinics are often run independently, through a partnering church or non-profit
organization, or through a medical school. A 2010 survey of all of the free clinics in the United
States found that on average free clinics run on a budget of $440,000 and $460,000 a year.12 This slim budget is made possible through the average of 156.7 volunteers and 7.5 paid staff members
who help run the clinic.12 These clinics are only open part-time; being open an average of four half-days a week.12
Free clinics are essential for the population they serve. One quarter of patients polled at
free health care centers said that they would not seek any care if the free clinic was not available
and 36% said that they would use hospital facilities as their primary source of care.12
Although the prominence of free clinics is increasing, there is little research about the
patient satisfaction at free health clinics and whether the care provided is high-quality care. In a
2009 study of a student-run clinic in South Carolina, all patients for an entire month of services
were given a survey at the completion of their visit. This survey, which was to be filled out
anonymously in their exam room, showed that 98% of the patients were highly satisfied. The
highest ratings came from the areas of friendliness of staff and time spent with students and
physicians. Also, 77.3% of patients say that the free health clinic provides better care than the
care which the patient was receiving before attending the health clinic. The lowest ratings of the
study came from the areas of wait time and hours of operation.29
This poor accessibility is an emerging theme with free clinics across the United States.
some half days, often are not open on weekends, and have abnormal hours. An average of 7.8
patients are turned away a week from each free medical clinic in the United States.12
Free clinics are clearly serving a population of great health need and achieving the goal
of providing affordable care for all populations. Although, The Affordable Care Act of 2010 will
change the roles of free health clinics across the United States approximately 26 million people
will still be uninsured.26 Therefore, as the role of free clinics change, there will still be a need to provide affordable, accessible health care to the uninsured and underinsured.
Methods
A cross-sectional study was used to evaluate patient satisfaction at SHC and whether its
services deter emergency room visits. This study has been exempted from IRB approval by the
University of North Carolina at Chapel Hill Institutional Review Board.
Interviews
Sampling Method
Interviews were conducted with five patients of the SHC Center who visited the clinic
more than two times. The patients were chosen based on a combination of random and purposive
sampling. Patients who came to the clinic within between January 7th, 2014 and February 28th, 2014 were sorted into a list by age group. The generated age-sorted-list was put in an Excel
document and through an Excel function a random number was given to each patient. The excel
file was then ordered based on the random numbers. The participants were chosen randomly
within their age group. The five participants chosen were one male under the age of 40 who
who spoke English and one female over the age of 40 who spoke English. Since overall health
concerns are different based on age, the interviewer decided to choose the interviewees based on
age. The interviewer called the chosen participants using a script (Appendix A) and asked to
schedule an interview at the health clinic either before or after their visit in the coming weeks. If
the patient did not pick up the phone and had an answering machine, then the interviewer left a
message. If the call was not returned within 72 hours, the interviewer called again. If the patient
did not pick up again, the interviewer moved to the next patient in the list. If a patient did not
wish to be interviewed, the evaluator selected another patient with the same criteria. This process
was repeated until five patients had interviewed.
The interview was held at the Garrett Road clinic in the conference room or the back
office with no one else besides the interviewer and the interviewee in the room. The interview
lasted approximately 30 minutes.
Information to be collected in interviews
The interview was conducted with an interview guide (Appendix B) and started out with
an introduction and overview of the interview. The interviewer then asked about the rationale for
coming to the clinic, first impressions of the clinic, insurance status, and job status. The second
part discussed the patient’s satisfaction with the clinic. This was assessed through questions
which asked about the patient’s feelings about the staff, patient waiting times, how well they
understand their diagnosis and medications prescribed, barriers to receiving care from SHC,
areas of success for the clinic, and areas of improvement. During the third part of the interviews,
emergency room usage and deterrence were discussed. This was done through questions about
the way the patient sought care before becoming a patient at the SHC, and now. These questions
were asked about the patient’s perceptions of the appropriate usage of emergency rooms through
presenting a series of health scenarios and asking where the patient would go for medical care in
that particular situation. The fourth part of the interview asked if the patient had anything else to
say about the successes and improvements needed at SHC. Finally, the interviewer thanked the
patient and asked if they had any remaining questions or comments.
Data Analysis
The interviews were transcribed using a Express Script and Microsoft Word. The analysis
was done using an inductive approach, meaning that codes and themes were discovered while
coding. After the first two interviews were transcribed each was printed and compared to the
other. The researcher took notes about each section and the themes it was describing. Each
interview was compared with other interviews and common themes were noted. Each question
was listed in a different document and the transcribed answers from the interviewees were sorted
below the questions. This coding was done in this way because the themes emerged readily and
the anecdotes relating to each theme could be easily grouped.
Surveys
Sampling Method
The front desk staff member gave out the surveys to all of the patients who visit SHC for
a doctor’s visit starting January 7, 2014 through March 20, 2014. The survey was given after the
patient checked-in and was waiting in the waiting room. The front-desk staff member gave the
patient the survey on a clipboard and a pen while using the script (Appendix C) to ask the patient
if they would like to participate.
The survey (Appendix D) asked a total of 32 questions. The first five questions asked the
patients to rate their satisfaction with certain aspects of the clinic such as the waiting time and
the respect received from the staff (1 = highly dissatisfied, 5 = highly satisfied). The survey then
asked patients to rate their satisfaction with eight aspects of the clinic such as “The clinic is a comfortable place” and “I go to the clinic because they speak my language” (1 = strongly
disagree, 5 = strongly agree). The second page of the survey asked patients 10 multiple-choice
questions about their first interactions with SHC, whether the SHC is their medical home, their
first and second choices for places they would seek care in a non-emergency situation, and how
many times they have been to the emergency room since becoming a patient. Lastly, the survey
contained nine demographic questions and two open-ended questions asking the patient to
describe the clinic’s strengths and areas for improvement.
Data Analysis
The data from each survey was entered into a Qualtrics survey and then downloaded into
an Excel document. Count, percentage, average, and standard deviation were calculated on the
rating scale questions. The multiple-choice responses were counted and ranked. The data from
the open-ended questions was compiled and coded in the same manner as the data from the
interviews; themes were identified and presented.
Results
Table 1 presents the demographic data for those who completed the survey. A total of 62
patients completed all of the demographic questions and patient satisfaction questions and 28
patients completed the emergency room deterrence questions. Fewer patients completed the
emergency room deterrence questions because the evaluator needed to change the wording on
understand the questions. Of the 62 surveys given out, 53% were completed in English and 47%
were completed in Spanish. Overall, there was a good distribution of gender, ages, time as a
patient, and employment. Fifty percent of the patients who completed a survey were Hispanic
(Table 1). Complete graphs and tables of the survey data can be found in Appendix F.
Table 1. Characteristics of the respondents, N=62
Characteristic Percentage (%)
Language of Survey
English 53
Spanish 47
Time as patient
First time 2
1-6 months 35
7-12 months 27
1-2 years 26
2-3 years 3
More than 3 years 2
Sex
Female 61
Male 35
Race
American Indian/Alaskan native 0
Asian 2
Black/African America 19
Pacific Islander/Hawaiian 0
White 23
Hispanic/Latino 50
Other/Mixed 3
Employment
Yes 47
Less than 15 hours 10
15-30 48
31-45 38
More than 45 3
No 48
Age
Less than 18 0
18-24 8
25-30 6
31-40 31
41-50 21
51-60 26
61-70 5
Patient Satisfaction
Patients Appreciate the Clean and Attractive Atmosphere
Figure 1. Patient agreement with statements about the clinic’s cleanliness and comfort with the clinic based on the survey data, N=62
The majority of patients strongly agreed that the clinic is clean (84%) and that the clinic
is a comfortable place (76%) (Figure 1). The lowest rating on the survey for questions based on the cleanliness and the environment was “neutral” (Figure 1). When asked in the survey, “What
is the best thing about Samaritan Health Center?”, three out of 52 respondents said that the best thing was the cleanliness and atmosphere of the clinic. One response was that the clinic “does
not feel like a health center/clinic. It is more like a doctor’s office.” Two of the five interviewees
specifically mentioned the cleanliness and environment as one of the reasons that they began to
come to the clinic. One interviewee appreciated the fact that the clinic was “up-beat, modern” and “had fresh colors that made it look like an inviting environment.” Overall in the survey
rating, open ended questions, and interviews all patients commented positively on the cleanliness
and environment of the clinic.
5 3
18 15
76 84
0 10 20 30 40 50 60 70 80 90 100
The clinic is a comfortable place The clinic is clean
Percentage
Cr
ite
ri
a
The Cost of the Clinic Gives Patients the Ability to Seek Healthcare
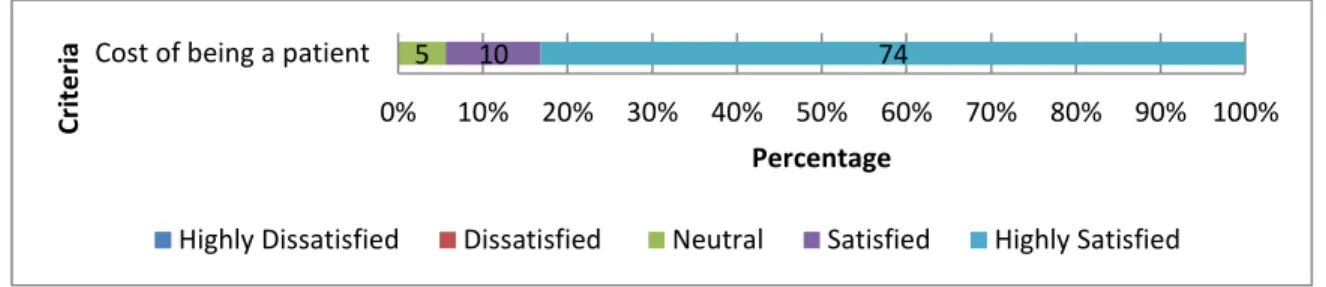
Figure 2. Patient satisfaction with the cost of the clinic based on the survey data, N= 62a
a 7 respondents left this question unanswered
An overwhelming majority of patients were highly satisfied (74%) or satisfied (10%)
with the cost of being a patient at the clinic (Figure 2). When asked to name the best thing about
Samaritan Health Center, eight respondents mentioned that the affordable and low cost was most
important to them. Other clinics they had visited had much higher fees, leading them to limit their doctor’s visits to only when the pain or sickness became unbearable. One patient said:
En el otro lugar tenia que pagar como $100 hasta $125, entonces solamente fui si totalmente necesitaba ir. [in the other location (where they received care before) you have to pay $100 to $125, therefore I only went if I really needed to go].
Another patient commented that he did not follow up with a doctor’s visit before at a previous
clinic due to cost of treatment. When asked about receiving other care before becoming a patient
at the Samaritan Health Center the patient responded:
I went to [the other doctor] one time. That is a lot of money to come up with to go to the doctor. I think it costs like 180 bucks. I had to pay on my own. I was supposed to go back…but I didn’t think I should go back
Now that patients have the Samaritan Health Center they are able to receive the proper amount of
care. Another patient remarked:
5 10 74
0% 10% 20% 30% 40% 50% 60% 70% 80% 90% 100%
Cost of being a patient
Percentage
Cr
ite
ri
a
SHC is brilliant, wonderful and exactly what the community needs. I would be in a horrible dilemma with money and the U.S. healthcare [system] if not for the SHC. Really, thanks a lot.
The Location of the Clinic is Good
Figure 3. Patient agreement with statements about the clinic’s location based on the survey data, N=62a
a 2 respondents left this question unanswered
Overall patients are agreed that the clinic is in a good location (63%) (Figure 3).
Although some patients expressed that they wish that the clinic was in a different location, the
overall consensus was that the clinic was in a good location. An interviewee said that she tells her friends in the apartments about the clinic because it is “tan cerca (so close).”
Patients are not fully satisfied with Appointment Scheduling
Figure 4. Patient satisfaction with the appointment availability based on the survey data, N=62
While 55% of respondents were very satisfied and 24% were satisfied with the number of
days between scheduling and completing an appointment, many other patients were less than
satisfied making it the lowest rated domain of satisfaction that was assessed (Figure 4). This
5 8 23 63
0 10 20 30 40 50 60 70 80 90 100
The clinic is in a good location
Percentage (%)
Cr
ite
ri
a
Strongly Disagree Disagree Neutral Agree Strongly Agree
5 3 13 24 55
0 10 20 30 40 50 60 70 80 90 100
The number of days between when patient calls to schedule an appointment and then sees a doctor
Percentage (%)
Cr
ite
ri
a
category has the lowest average score (4.2) and the highest percentage of patients who are very
dissatisfied or dissatisfied with the appointment availability (8%) (Figure 4). When patients
were asked to name one thing that they would change about SHC 48% of survey respondents
said something about appointment scheduling. In the open-ended portion of the survey, fifteen
patients requested having longer hours or shorter amounts of time to receive an appointment for
an urgent need. One patient said she would change:
Having to wait for months at a time to see a doctor and the limited appointment hours. I would love to be able to get an appointment within a couple of days of calling when I have an urgent need.
Seven survey respondents talked about the phone system being a difficult to use. One patient wished for an “easier way to get a hold of someone during hours not open. Even if leaving a
message I want it to be checked and returned [in a timely manner].” Another patient said “I would not change anything except for the phone messages when you call.”
Other patients felt that the wait for an appointment was worth it for the care that they are receiving. One patient said, “Even if I have to wait a week or two for an appointment that is
understandable and fine. I just like the place and I kept coming back.”
Patients are Impressed with the Waiting Time
Figure 5. Patient satisfaction with the time spent waiting in the clinic based on the survey data, N=62
2 13 26 60
0 10 20 30 40 50 60 70 80 90 100
The amount of time patient spends waiting in the clinic
Percentage (%)
Cr
ite
ri
a
The majority of patients are very satisfied with the amount of time that they spend
waiting in the clinic (60%) (Figure 5). No patients were very dissatisfied and only one patient
was dissatisfied. All the patients who were interviewed said that the time spent waiting in the
clinic is reasonable. One patient said:
It is just as quick here, if not quicker than if I go with someone else to a real doctor’s office.
Another patient commented on waiting time saying:
I don’t really wait that much. I just fill out the paperwork and then I usually get my vitals taken and then I see Dr. Iglesias and there is no wait time. Now UNC and Duke—that is a different story. That would be a whole half of a day waiting.
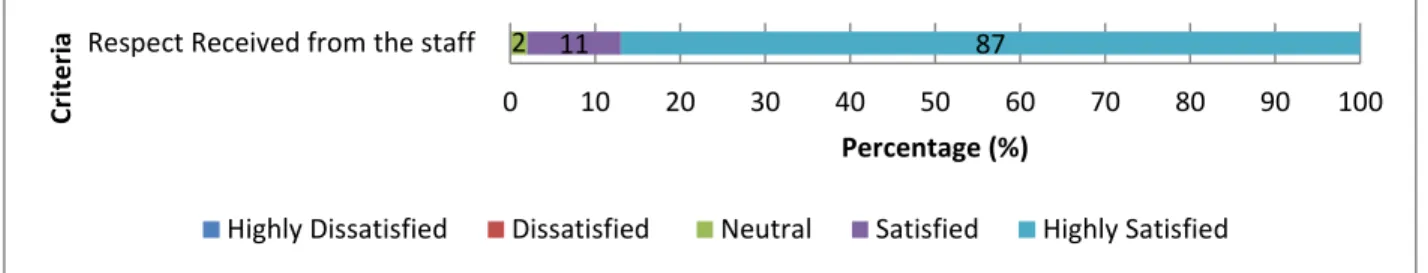
The Staff Respects the Patients
Figure 6. Patient satisfaction with respect received from the staff based on the survey data, N=62
The SHC received its highest patient satisfaction ratings for showing respect for the
patients with 98% being very satisfied or satisfied with this domain (Figure 6). Only one person
was not satisfied with the respect received from the staff. An overwhelming number of patients
said that the staff was the best thing about the SHC (71%). Some words that were used to
described the staff were “non-judgmental”, “respetosas (respectful)”, “friendly”, and “kind”. All
of the interviewees said that they felt as if the staff respected them as people. One patient said:
2 11 87
0 10 20 30 40 50 60 70 80 90 100
Respect Received from the staff
Percentage (%)
Cr
ite
ri
a
I am pleased with services for many reasons, but the first and foremost is the fact that I have been seen on many occasions without insurance and treated each time with dignity and respect.
Each interviewee recounted a time with a specific staff member where they felt they were being
treated with care. One interviewee said:
[The nurse] had to draw blood and she really had to work to find my veins, but she didn’t jab it. I know that sometimes you have to work to find the veins, but it was the
mannerisms that she did it with [that were good]. She took her time, was careful with the needle, and didn’t leave a bruise…This lady here that did it she had the care—I call it the grandma’s touch. When you have to jab it in there and wiggle it, it is not comfortable.
Another interviewee felt that the respect and equality shown by the staff was what set Samaritan
Health Center apart from other places:
I know I am not a highly educated man and I don’t have people’s money. I ain’t felt like that mattered coming here, but if you go to other places you do get the feeling that they know that you don’t have any money and you get the service that they give you and that is it. I don’t seem to get that here. I get the feeling that people are genuinely concerned.
Nothing was said poorly about the staff by a patient throughout all of the interviews and surveys.
Patients are satisfied with medical care
Figure 7. Patient satisfaction with the time the doctor spends with the patient based on the survey data, N=62
Almost all of the patients are very satisfied or satisfied with the time that the doctor
spends with the patient (92%) (Figure 7). Six patients mentioned in the open-ended portion of the
5 19 73
0 10 20 30 40 50 60 70 80 90 100
Time doctor spends with patient
Percentage
Cr
ite
ri
a
survey that the best thing about the SHC was the time that the doctor was able to spend with them. One patient said, “The staff is open to hearing patients and giving extra time if needed.”
Patients mentioned that they do not feel rushed or pushed out the door. One patient believed that
because he does not see other patients in the waiting room he believes the doctor has the time to
give him the attention that he needs. He mentioned attributing a smaller clinic to the amount of
time that the doctor spends with him. Another patient compared the rushed wait times that she
felt in past clinics where she was a patient and the feeling that she feels now as a patient of SHC:
I honestly think I have had better care here then when I was in [a different city]. The doctor that I had before had so many patients backed up that you were lucky that you had five minutes, so you had to make sure that you had your stuff together—I always felt like it was the wind that came in and left. I could always feel the sense of being rushed and not getting focused care.
All five interviewed patients spoke highly of the time that the doctor spent with them.
Figure 8. Patient agreement with statements based on the doctor’s ability to understand the patient and answer questions based on the survey data, N=62
Approximately three-fourths of the patients felt that the doctor understands why the
patient comes to the doctor (73%) and that the doctor answers his/her questions (79%) (Figure
8). All five interviewees discussed the fact that the doctor understands their problem and that
they understand the doctor’s response. The two Spanish-speaking interviewees said that they do
2 2 2
5 19 18
73 79
0 10 20 30 40 50 60 70 80 90 100
The doctor understands why the patient comes to the doctor
The doctor answers his/her questions
Percentage (%)
Cr
ite
ri
a
not feel as if there is a language barrier. When asked if there are ever times when there is a
language or medical jargon barrier one responded:
No pasa conmigo porque si yo no entiendo yo voy a preguntar—si ellos hablan espanol. Porque cuando vengo a mi cite siempre hay alguien que habla en espanol. Si yo no entiendo algo yo habla con Suzannah porque ella habla bien espanol.” [That does not happen to me because if I don’t understand than I am going to ask—if they speak Spanish. But when I come to my appointment there is always someone who speaks Spanish. If I do not understand I talk to Suzannah because she speaks good Spanish.] No interviewee ever felt like they left the clinic not having understood what the doctor
was saying or not having gotten their questions answered. Patients felt like the doctor gave them
overwhelming amounts of information. Patients also stressed that having a conversation with the
doctor during the visit is very important and they found that the doctors at the SHC were always
able to do that. One patient said that “the doctors are willing to listen and figure out what the
problem is without overtalking you.” Another patient summarized it by saying, “They give me
plenty of information and explain it too. I understood and knew what I was supposed to be doing.”
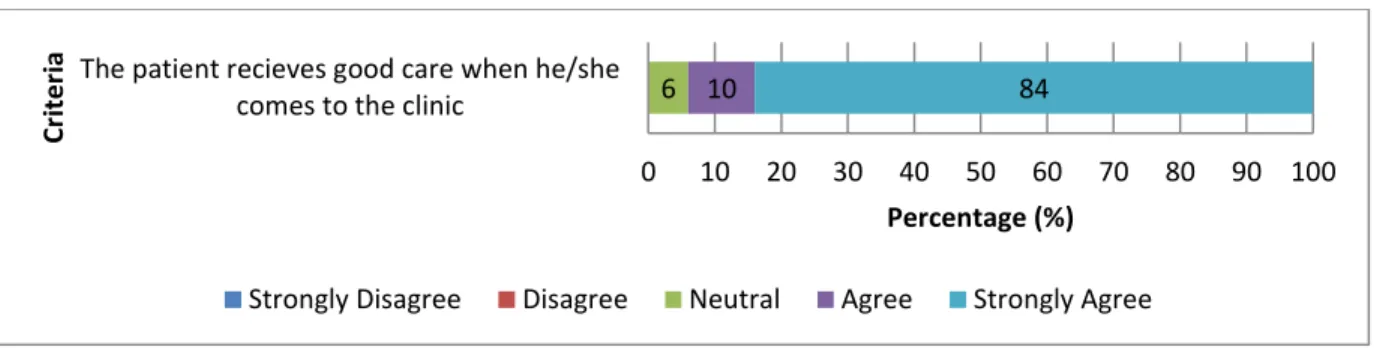
Figure 9. Patient agreement with statement on their care based on the survey data, N=62
Through a combination of the time with the doctor, understanding the doctor, and getting
questions answered by the doctor, the majority of patients felt as if they were getting good care at
the clinic (84%) (Figure 9). When patients were asked why they felt that they were receiving
6 10 84
0 10 20 30 40 50 60 70 80 90 100
The patient recieves good care when he/she comes to the clinic
Percentage (%)
Cr
ite
ri
a
good care the patients discussed their chronic care management. All of the interviewees had a
chronic condition that was being managed by the SHC and had an appointment that day for
chronic care management. All of the interviewees also did not know that they had a chronic
condition until they became a patient at the SHC. They each had a different chronic condition
(diabetes, high cholesterol, irregular menstrual cycles, anemia, and high blood pressure) that
were tested for, discovered, and managed within their time as a patient at the SHC.
Patient’s Clinic Recommendations
When the interviewees were asked to describe tangible things that the clinic could do to
improve, one patient said that nothing could be done, but the other four had some ideas. One
patient had the idea of offering a patient card each time that she visits. She got the idea because
she is getting older and she believes she does not remember everything that the doctor is saying.
She said that the card could have her blood pressure, height, weight (vitals) and then the doctor could write down the “target item of the day” and any medications that go along with that. This
way the patient could have something to take home with them and reference until the next visit.
Another way that the interviewees thought that SHC could improve was offering different
hours and services. One patient mentioned have clinic at different times—such as later in the
day—for those who are working. Another patient wanted both clinics to offer more services. She
said that she understood that other clinics offer dental and vision and she would like to see that
Emergency Room Deterrence
When patients were asked what their first course of action would be if they contracted an
acute non-urgent condition (such as a sore throat or a sinus infection) an overwhelming majority
said that Samaritan Health Center is their first choice (74%) (Figure 10). A small amount of
other respondents said they would go to another free clinic or a private doctor first, but no one
said that they would go to the emergency room first (Figure 10). This was true for the
interviewees as well as most said that they would treat with a home medication first and then call
Samaritan Health Center, but no one said that they would go to the emergency room first.
When asked what their second choice of medical care would be if they contracted an
acute non-urgent condition, 35% said that they do not know where they would go for medical
care. The category of “I do not know where I would go” had the greatest percentage of responses
for their second choice of medical care. (Figure 11). This signifies that the majority of patients at
the clinic rely on the clinic for their primary care needs and that almost a third of the patients
would be lost in the system if Samaritan Health Center was not in business. Approximately one
fourth of the patients said that they would find a different free clinic (12%), private physician
(12%), or urgent care (4%) location to go to if they could not go to Samaritan Health Center
(Figure 11). About 4% of respondents said that they would go to the Emergency room (Figure
Figure 10. Respondents’ preferences for their first choice for non-urgent medical care (such as a sore throat) from survey data, N=27
Figure 11. Respondents’ preferences for their second choice for non-urgent medical care (such as a sore throat) from survey data, N=27
Ninety-two percent of patients indicated that since becoming a patient at Samaritan
Health Center, they have not been to the emergency room for a non-urgent health care need.
Instead, they responded that they have used SHC for their non-urgent health care needs on
average 3.5 times. Therefore having access to SHC’s services has kept each patient from seeking
74%
7% 7% 7%
4%
0% 0%
0% 10% 20% 30% 40% 50% 60% 70% 80%
SHC Other Free
clinics
Private doctor Urgent Care I do not know Emergency Room
Health Department
35%
23%
12% 12%
8%
4% 4% 4%
0% 10% 20% 30% 40% 50% 60% 70% 80%
I do not know
SHC Other Free
clinics
Private doctor
I would not go anywhere
Urgent Care Emergency Room
care elsewhere (potentially the emergency room) for a non-urgent need on average 3.5 times
(Figure 12).
Figure 12. The number of times that survey respondents recalled going to the Samaritan Health Center and the emergency room for a non-emergency need since they have become a patient at the Samaritan Health Center (N=26).
The interviewees’ statements supported the quantitative results. One stated that if they
could not be seen at Samaritan Health Center for care than the emergency room is their only
other option. The remaining four stated that they would have to find other free clinics in the area,
but only two of them knew of any other free clinics (Lincoln and Planned Parenthood). All of the
interviewees mentioned trying to treat the ailment themselves or calling friends who are nurses to
treat them. All of the interviewees mentioned that the emergency room is the last resort if they
could not find another place to go. Each of the interviewees had a different reason of why they
would not go to the emergency room for an acute care need. One patient told a story of having a broken arm for several hours before going to the emergency room because “the ER would rack
up another bill that [he] can’t afford.” When asked what another patient would do if Samaritan
Health Center was not available for a non-urgent health care need she said this:
0 20 40 60 80 100
0 1 to 2 3 to 4 5 to 6 7+
Per
ce
n
tage
Number of times
I would not run to the hospital, I would do my famous honey, lemon, and tea. If it didn’t get better than I have an aunt who is a nurse—so I would ask her…I would not go to the emergency room because now you get sicker when going to the emergency room because it is full of what I call ‘cooties’. So I would have to be on my death bed for me to go in an emergency.
Another patient stated that she would be very reluctant to go to the emergency room because,
In the past I will try to medicate it at home with any kind of homeopathic treatment that I can. My husband says that this has to be treated. When that comes about I probably would just go to the hospital.
Patients who are not able to find another free clinic will sit at home with a sickness. They would
not go to the emergency room unless it got to be completely unbearable. Having an illness that goes untreated is also bad for the patient’s health and the healthcare industry because the small
illness could develop into something worse and be a greater deal than it was if it was treated
properly from the beginning. The consequences of patients not doing anything for their health
also demonstrate the need for free clinics.
Discussion
The survey and interviews found evidence that the greatest strength of SHC is the respect
of the staff, cleanliness of the clinic, and care received from the doctor. The greatest weaknesses
found were appointment availability, time spent waiting in the clinic, and the phone service.
SHC does keep people out of the emergency room, urgent care, and other care providers—when they can see their patients. It is frequently the patients’ first choice to come to SHC, but when
SHC cannot see their acute care patients than the patients do not know where to go. They are
forced to find other clinics, go to the emergency room, or do nothing. The most impactful finding
in the study is that SHC is providing medical care in a very understanding and fair way, but
This data confirms what was found in the previous evaluation of a free clinic in South
Carolina. This evaluation and the South Carolina evaluation found that the highest ratings were
from the categories of friendliness of staff and the time spent with the doctor (or medical
provider). The majority of patients commented on how they are receiving better care at SHC than
they were receiving before—which supports what was found in the South Carolina study.29 Nationwide free clinics are known for having long wait times and not accessible hours.12 SHC was found to be no exception to that as many respondents complained about being told to wait an
extended period of time for an appointment. SHC patients had very high remarks for the clinic’s
cleanliness, which was not shown in any other study. The dissatisfaction with the phone
answering machine is another topic that was not shown in any other study and therefore is very
specific to the SHC.
In addition, all of the interviewees were not aware of their chronic conditions before
coming to Samaritan Health Center, which confirms the statistics found in the literature review
that those without insurance are less likely to seek preventative services. This study adds to the
South Carolina and nationwide studies by demonstrating that patients, even with access to
healthcare through SHC, do not rush to the doctor with any pain or symptom. Most patients try
to treat the illness themselves before going to the doctor. One reason as to why this happens
could be that the patients’ have a different precedent for the behavior of when and why they go
to the doctor. The precedent stems from patient’s previous problems in seeking care such as high
out of pocket costs or lack of access to care. Although the interviewees considered SHC their
medical home, they still mostly go to the clinic for chronic management appointments and it was
not likely that they would come to the doctor for a sore throat or ear ache unless the pain became
Limitations to the Study
Interviews
The interviewer is a volunteer at the Samaritan Health Center once per week. This could
be problematic because the interviewee could have recognized the volunteer and therefore may
not have been as willing to share negative information. Since the interviewer is in the clinic on a
regular basis, the interviewer may have a preconceived bias toward the clinic and the different
problems within the clinic. Due to the fact that only a sample of patients were interviewed and
the women under 40 group did not have a representative interviewed, all of the clinic’s patients’
ideas and opinions were not accounted for. In the interviews no negative comments were given
by any of the interviewees conducted in Spanish. As some of the interviews were with minority
individuals who are potentially undocumented, the environment was not conducive to these
patients being able to complain or talk about what could be improved with the clinic. This subset
of patients was just thankful that they were able to receive medical care and therefore were not
able to give truthful or constructive answers to questions which focused on areas of improvement
for the clinic.
Survey
The front desk assistant who works for SHC distributed the surveys. Therefore, patients
may not have been willing to share all of their opinions for fear that their remarks would affect
the care they received if the staff saw their answers. In addition to this, surveys were only given
out over a three month period, not giving all of the patients the opportunity to complete the
leave the clinic, patients may not have had time to fully complete the survey and share all of their
opinions.
The survey only had 62 respondents, which was lower than anticipated. Throughout the
survey period, SHC changed their electronic health record systems and was extending their
appointment times for each patient in order to accommodate possible delays in the computer
system. Therefore, doctors were not able to see as many patients and there were fewer than
normal patients visiting SHC than normal. Also during this time period SHC was transitioning
doctors and only remained open on Tuesdays and Thursday rather than their normal Monday
through Thursday schedule. This contributed to less patients who were able to be seen at SHC
per week. The inability to see as many patients per day, compounded with the fact that they were
only open 50% of their normal hours, led to a low participation in the survey and not as
representative of a sample of the clinic’s patients.
At the outset of the process patients and staff were confused by the wording of the
emergency room deterrence questions, therefore leading to a change in the survey on January 28,
2014 in order to have straight-forward, clearer questions that the patients would be able to to
understand. Due to this, approximately half of the survey respondents had their answers thrown
out for the emergency room deterrence questions. This is a limitation because the poor wording
could have affected the responses of the patients in other areas of the survey and it limited the
number of responses in the ER section, making less patients able to respond to the questions.
In many of the surveys, respondents checked all of the same satisfaction and agreement
for all of the Likert scale patient satisfaction questions. Therefore they may not have been
thinking about each question individually, but rather knowing that they are overall satisfied with
other to push the respondents to a different satisfaction/agreement. Survey respondents could
have been subject to acquiescence bias, agreeing to all statements or having a positive
connotation with all of the statements.30 This would cause a higher positive value for the patient satisfaction questions therefore the questions have the potential to not show the patient’s true
sentiments.
Future Directions
Overall, high patient satisfaction with the clinic is demonstrated by the majority of
patients strongly agreeing or being highly satisfied with all aspects of the clinic. Because of this
high satisfaction percentage it is important to observe where there was the strongest percentage
of highly dissatisfied or strongly disagreeing areas. There are some small changes that can be
made administratively in response to the survey that will quickly improve the experience of
patients. For example, many comments on the open ended section of the survey had to do with
frustrations of receiving a voicemail rather than hearing from a person. Becoming aware of this
issue and having someone at the clinic, most likely the front desk administrator or a volunteer, be
fully in charge of making sure that each call is picked up within the clinic’s hours would help
alleviate this problem. Another example would be to implement a patient recommendation and have an option of a “patient card” that patients can pick up at the beginning of their appointment.
This card would have space for patients to write down any questions for the doctor that they may
have and then write down any major points that the doctor makes during the visit so that they can
refer to it after their appointment.
There are some issues that necessitate more than a small change that may not need action
now, but would be important to know that they could develop to be a problem in the future.
themselves to have a medical home? If there is not enough appointment availability for patients
and they do not have a medical home than the clinic is not positively affecting the health care
system. These issues perpetuate the problems of coordination of care, fragmented care, and
rushed care that uninsured patients have to face. Although SHC is not to the point where they are
unable to provide the proper care to their patients, they need to be cautioned to monitor their
potential growth if the patients that they have now already believe that they cannot see a doctor
when needed. A conversation could be started with the board members on this potential future
problem of having too many patients and not providing them with constant, complete medical
care so that they can begin to combat this potential issue in its early stage.
The staff at the SHC is something that the vast majority of survey and patient respondents
commented on very positively. There was not a single survey or interviewee that had anything
poor to say about a SHC staff member or the staff as a whole. This environment of friendliness
and respect that the staff creates for the patients is so valuable that patients are willing to wait for
an appointment in order to receive the respect and attention that SHC members give their
patients. SHC is perceived very positively in the community and many patients commented that
they would not know what to do without the support and access to SHC. Overall, Samaritan
Health Center is a place where patients feel as if they are supported, respected, and heard while
continuing to receive quality medical care—this is what makes SHC so important and needed in
References
1
Todd, S. R. (2012, September 12). Overview of the Uninsured in the United States: A Summary of the 2012 Current Population Survey Report. ASPE Issue Brief. Retrieved from
http://aspe.hhs.gov/health/reports/2012/UninsuredInTheUS/ib.shtml
2
Kaiser Family Foundation. The Uninsured and the Difference Health Insurance Makes. ; 2008.
3
National Research Council. (2001). Coverage Matters: Insurance and Health Care. Washington, DC: The National Academies Press. Retrieved from
http://www.nap.edu.libproxy.lib.unc.edu/catalog.php?record_id=10188
4
Zweifel P, Manning WG. Moral Hazard and Consumer Incentives in Health Care. ; 2000.
5
Rhoades, J. C. (1999). Health insurance status of the civilian noninstitutionalized population. Agency for Healthcare Research and Quality. Rockville: MEPS Research Findings. Retrieved from
http://meps.ahrq.gov/mepsweb/data_files/publications/rf14/rf14.pdf
6
Kozak LJ, Hall MJ, Owings MF. Trends in avoidable hospitalizations, 1980-1998. Health Aff (Millwood). 2001;20(2):225-32.
7
Typical Costs for Common Medical Services. (2009). Retrieved from Blue Cross Blue Shield Association: http://www.bluecrossma.com/blue-iq/pdfs/TypicalCosts_89717_042709.pdf
8
Gindi, R. M., Cohen, R. A., & Kirzinger, W. K. (2012). Emergency Room Use Among Adults Aged 18–64: Early Release of Estimates From the National Health Interview Survey, January-June 2011. National Center for Health Statistics. Retrieved from http://www.cdc.gov/nchs/nhis/releases.htm
9
Kangovi S, Barg FK, Carter T, Long JA, Shannon R, Grande D. Understanding why patients of low socioeconomic status prefer hospitals over ambulatory care. Health Aff (Millwood). 2013;32(7):1196-203.
10
Institute of Medicine National Research Council. Hidden Costs, Value Lost: Uninsurance in America. Washington, DC: The National Academies Press, 2003
11
Bodaken, B. (2007). Have Insurance? Covering the Uninsured Will Help You, Too. BCBS of California. Retrieved from
https://www.blueshieldca.com/bsca/about-blue-shield/newsroom/covering-uninsured.sp
12
Gertz AM, Frank S, Blixen CE. A survey of patients and providers at free clinics across the United States. J Community Health. 2011;36(1):83-93.
13
14
Brill, E. (2010). History. Samaritan Health Center Volunteer Manual .
15
Brill, E. (2013, December 2). Samaritan Health Center Operations Manager. (H. Smith, Interviewer)
16
Collins, S. R., Davis, K., Doty, M. M., Kriss, J. L., & Holmgren, A. L. (2006). Gaps in Health Insurance: An All-American Problem. The Commonwealth Fund, Findings from the Commonwealth Fund Biennial Health Insurance Survey. The Commonwealth Fund. Retrieved from
http://www.commonwealthfund.org/usr_doc/Collins_gapshltins_920.pdf
17
Shi, Leiyu (2000). Type of health insurance and the quality of primary care experience. 90(12), 1848-1855. Retrieved from
http://www.ncbi.nlm.nih.gov/pmc/articles/PMC1446448/?tool=pmcentrez&rendertype=abstract
18
Berwick, D. M, Hackbarth, A.D, “Eliminating Waste in US Health Care,” JAMA Online, March 14, 2012, pp. E1-E4.
19 Insitute of Medicine. (2001). Crossing the Quality Chasm: A Health System for the 21st Century.
Washington, DC: National Academy Press.
20
Weinick RM, Burns RM, Mehrotra A. Many emergency department visits could be managed at urgent care centers and retail clinics. Health Aff (Millwood). 2010;29(9):1630-6.
21
Gindi, R. M., Cohen, R. A., & Kirzinger, W. K. (2012). Emergency Room Use Among Adults Aged 18–64: Early Release of Estimates From the National Health Interview Survey, January-June 2011. National Center for Health Statistics. Retrieved from http://www.cdc.gov/nchs/nhis/releases.htm
22
Emergency Medical Treatment & Labor Act (EMTALA). (2012, March 26). Retrieved from Centers for Medicare & Medicaid Services:
https://www.cms.gov/Regulations-and-Guidance/Legislation/EMTALA/index.html?redirect=/emtala/
23
Schiff RL, Ansell DA, Schlosser JE, Idris AH, Morrison A, Whitman S. Transfers to a public hospital. A prospective study of 467 patients. N Engl J Med. 1986;314(9):552-7.
24
Agency for Healthcare Research and Quality (AHRQ). 2001.Health Care Expenses in the
U.S.Civilian Non-institutional Population, 1997. Retrieved from Institute of Medicine Hidden Costs, Value Lost:
http://vb3lk7eb4t.search.serialssolutions.com/?ctx_ver=Z39.88-
2004&ctx_enc=info%3Aofi%2Fenc%3AUTF-8&rfr_id=info:sid/summon.serialssolutions.com&rft_val_fmt=info:ofi/fmt:kev:mtx:book&rft.genre=book&rft.title=
Hidden+Costs%2C+Value+Lost&rft.date=2002-12-01&rft.pub=National+Academies+Press&rft.isbn=9780309511391¶mdict=en-US
25
Chase, M. M. (2006). Emergency department nurses’ lived experiences with compassion fatigue.
(Unpublished Masters of Science in Nursing). The Florida State University, FSU Electronic Thesis and Dissertation Archive.
26
27
Simpson SA, Long JA. Medical student-run health clinics: important contributors to patient care and medical education. J Gen Intern Med. 2007;22(3):352-6.
28
Reynolds HY. Free medical clinics: helping indigent patients and dealing with emerging health care needs. Acad Med. 2009;84(10):1434-9.
29
Ellett, J. D., Campbell, J. A., & Gonsalves, W. C. (2010). Patient satisfaction in a student-run free medical clinic. Family Medicine, 42(1), 16-18.
30
Appendix
Appendix A. English and Spanish script to schedule an interview
English
Hi, My name is Hannah Smith and I am calling with the Samaritan Health Center. I am doing an evaluation of Samaritan Health Center to understand some things that they do really well and some things that they need to work on. I am doing both surveys for all patients, but then I want to conduct five interviews with current patients. I understand that you are a patient that has been to the Samaritan Health Center at least twice—is this true?
If no—Okay! That is fine. Unfortunately I am only looking to conduct interviews with people who have been to the health clinic two times. I would love to send you a survey so that I can receive your input about your experiences with the Samaritan Health Center. Would you like to receive a survey? Thank you so much for your time and have a great day!
If yes—Okay! Well let me tell you about the interview process. I would love to have you come into the Samaritan Health Center during a time when they are not open and we can talk for approximately 45 minutes about the Samaritan Health Center. I want to make very clear that your answers to the interview will in no way affect your care that you receive at the clinic. Additionally, I will be interviewing multiple people so nothing you say will be tied back to you and all information that you share is confidential. Throughout the interview your participation is voluntary and you are able to skip any question and leave at any time. The information you share is going to be very helpful in making the clinic a better place to receive medical care. Since you will be helping the Samaritan Health Center so much we would like to give you a $20 gift card for Walmart in exchange for your time. Would you be willing to be a part of the interview process?
If no—Okay! Thank you so much for your time today. If you are willing I would love to send you a survey so that I can receive your input about your experiences with the Samaritan Health Center in a different form. Would you like to receive a survey? Thank you so much for your time and have a great day!
Spanish
Hola, Me llamo Hannah Smith y estoy llamando con la clínica Samaritan Health Center. Estoy haciendo una evaluación de Samaritan Health Center para entender algunas cosas que están haciendo muy bien y algunas cosas que necesitan hacer mejor. Yo estoy haciendo encuestas para todos los pacientes y también yo quiero hacer algunas entrevistas con pacientes. Entiendo que usted es un paciente que ha visitado a la clínica de Samaritan Health Center al menos dos veces - ¿esto es cierto?
Si no- ¡Okay! Desafortunadamente, solo estoy buscando personas para las entrevistas que han ido a la clínica por lo menos dos veces. Me encantaría darle una encuesta para que pueda recibir sus comentarios sobre sus experiencias con la clínica de Samaritan Health Center. ¿Le gustaría recibir una encuesta? Muchas gracias por su tiempo y que tenga un buen día!
Si sí - ¡Okay! Me encantaría si pudiera venir a la clínica de Samaritan Health Center algún día cuando no está abierta para poder hablar por aproximadamente 30 minutos acerca del
Samaritan Health Center. Quiero saber cuáles cosas le gustan de la clínica y cuáles son las cosas que Ud. cree que la clínica pueda hacer mejor. Sus respuestas a la entrevista en ninguna manera afectará la atención que recibe en la clínica. Además, voy a entrevistar a muchas personas y por eso nada lo que diga va a estar conectado a usted y toda la información que Ud. comparte es confidencial. La entrevista es voluntaria y se puede saltar cualquier pregunta que Ud. no quiere contestar. Usted puede terminar la entrevista en cualquier momento si no quiere continuar. La información que usted comparta va a ser utilizado para que la clínica pueda ser un mejor lugar para recibir atención médica. Porque usted va a estar un gran ayuda a la clínica nosotros vamos a darte un tarjeta de regalo para Walmart por $20. ¿Podría entrevistarle?
Si no- ¡Okay! Muchas gracias por su tiempo. Me encantaría darle una encuesta para que podamos recibir sus comentarios sobre sus experiencias con la clínica Samaritan Health Center. ¿Le gustaría recibir una encuesta? Muchas gracias por su tiempo y tenga una buen día!
Si sí – ¡Gracias! Esto va a ser muy útil para la clínica. Yo planeaba hacer las entrevistas los viernes, pero ¿hay un día/hora que funcione mejor para usted? *Schedule an
Appendix B. English Interview Guide
Hello, my name is Hannah Smith and I am a student at UNC-Chapel Hill. I am helping Samaritan Health Center in figuring out what are some things that they do really well and some things that they need to work on. You may have seen me before in the office as I work here as a volunteer about once a week at the front desk. Before we start the interview I need to go over some information to make sure that you understand what we are going to be doing today. The purpose of this talk is to help Samaritan Health Center give you better care and make sure that you are receiving everything that you need. So please be honest. Know that nothing will be tied back to you and this will not affect any of the care that you are getting from Samaritan Health Center and their doctors and staff. All information is confidential. Some of your answers may be shared with the Samaritan Health Center staff and doctors, but no one will ever know it was you who said these things. I do want to remind you that your participation in this talk is completely up to you and if at any time you do not want to continue then you are free to leave. You can also tell me that you do not wish to answer any question. Please also feel free to ask for me to explain any question that I ask and please feel free to ask me any questions throughout the interview.
The interview should take about 30 minutes and will be recorded unless you do not want me to record the interview. You are about 1 of 5 patients that we will be interviewing and we will combine all the information in the report—so again nothing can be linked back to you. I am planning on giving the interview in __________ (Spanish/English), is this okay?
Do you have any questions for me before we get started? Do you give your consent to be in the study? Great—Thank you so much! Is it okay if I turn on my recorder now?
Part one: Demographics
So let me explain the flow of the survey.
First, I’ll ask you about yourself and how you became a patient at the Samaritan Health Center
Then, I will ask you about your experiences with Samaritan Health Center
Next, I will ask you about where you got medical care before Samaritan Health Center and where you would go for care if you did not have Samaritan Health Center
Finally, we will discuss any further opinions or statements you want to say about Samaritan Health Center
1. How long have you been a patient at Samaritan Health Center? a. About how many times have you come in the past year?
2. What brought you to the clinic for the first time? Why did you decide to make an appointment with the clinic?
a. What were your first impressions during your first time coming to the clinic?
b. How did you make an appointment—by walking into the clinic, by phone, or by e-mail? How did you feel about this process—was it efficient?