Nonfatal Injuries Among the Elderly
Treated in Hospital Emergency Departments
authored by
Keith Kocher
as partial fulfillment for completion of a Master's in Public Health, Health Care and Prevention
Date
Date
Abstract
Objectives: To characterize nonfatal injuries in the elderly treated in U.S. hospital emer-gency departments (EDs) during 2000 and 2001, and to model which characteristics are most highly associated with hospitalization as an outcome.
Methods: This was a retrospective, cross-sectional study. Data were analyzed from the National Electronic Injury Surveillance System-All Injury Program (NEISS-AlP). NEISS-AIP is operated by the U.S. Consumer Product Safety Commission and sponsored by the Centers for Disease Control and Prevention. It provides data on roughly 500,000 injury-related ED cases each year, representing approximately 31 million injuries. These data are drawn from a nationally representative sample of 66 NEISS-AlP hospitals, which were selected as a stratified probability sample of hospitals with a minimum of six beds and a 24-hour ED in the U.S. and its territories. Data from these cases were
weighted by the inverse of the probability of selection to provide national estimates. An-nualized estimates were based on weighted data for 36,752 nonfatal injuries among the elderly treated in EDs during January-December 2001 and 17,605 nonfatal injuries during July-December 2000. 2001 NEISS-AlP data were utilized to arrive at injury rates while 2000 NEISS-AIP data were utilized in bivariate and multivariate logistic regression mod-eling. U.S. Census Bureau population estimates for 2001 were utilized in order to arrive at injury rates. A direct variance estimation procedure was used to calculate 95% confi-dence intervals. Nonfatal injuries were defined as bodily harm resulting from acute ex-posure to an external force or substance, including unintentional and violence-related causes. Cases were excluded from this analysis if 1) the person was less than 65 years old or of unknown age; 2) the principal diagnosis was for a (a) non-injury illness, (b) pain only illness, or (c) unknown; and 3) the ED visit represented a fatality. Deaths were ex-cluded from the analysis because they are not captured completely by NEISS-AIP. Ail injuries were classified according to the mechanism of injury, disposition, diagnosis, pri-mary body part injured, location, and intent.
Results: During 2001, an estimated 935,556 males and 1,731,640 females ages ::>:65 were treated in EDs for nonfatal injuries. This represented 5. 7% of all nonfatal injuries for males and 13.3% of all nonfatal injuries for females across all ages. The overall injury rate per 100,000 persons was higher among females (8,466) than males (6,404). The in-jury rate also increased with each higher age bracket for both females and males until it reached a rate of 15,272 for females ages ::>:85 and 11,547 for males ages ::>:85. Compared to all other mechanisms, falls caused the highest rates of injuries by far across this popu-lation ( 4,684 ); however, this mechanism of injury was disproportionately represented among females (67.1%) more than males (50.5%) (P < 0.0001). Yet, males had higher percentages of other causes of nonfatal injury, including being struck by or against (11.2% vs. 7.7%, P < 0.0001), occupying a motor vehicle (9.2% vs. 6.5%, P < 0.0001), and being cut or pierced (7.2% vs. 2.7%, P < 0.0001). Most injuries among the elderly were diagnosed as fractures (25.2%) or contusions/abrasions (23.2%) while the parts of the body typically affected were the head/neck (25.8%) or arms/hands (21.7%). Many nonfatal injuries among the elderly occurred in the home (47.8%). The majority of pa-tients were treated and then released (82.5% ), although an important number were also hospitalized (15.1 %). Those characteristics for which hospitalization as an outcome were more highly associated include: older age groups (OR= 2.00 for those ages ::>:85, P < 0.001); males (OR= 1.25 compared to females, P < 0.001); being a motor vehicle occu-pant (OR= 9.12, P < 0.001); having a hemorrhage (OR= 54.22, P < 0.001), concussion
(OR= 30.06, P < 0.001), or fracture (OR= 25.66, P < 0.001); and self-harm (OR= 12.22, p < 0.001).
Discussion: Injuries are generally considered a problem of the young. Consequently, not as much attention has been focused on injuries in the elderly population. While it is true that injuries do not account for as many fatalities when compared to other causes of death among senior Americans (8th leading cause in 2000 when grouping intentional and unin-tentional injuries together for ages 2:65), the rate for nonfatal injuries among this popula-tion is actually quite comparable to rates among younger age groups. In fact, starting around age 65, the rates for nonfatal injuries begin to increase again after having steadily declined after the late-20s, peaking as high as 14,141 per I 00,000 persons among the 2:85 population. This was similar to the nonfatal injury rate in the 25-29 (13,925) or 10-14 (13,252) age groups. Other important findings included the disparities between male and female injury rates and patterns, the rate of hospitalization after a nonfatal injury among the elderly (1 ,217) was much higher than any younger age group, and the characteristics for which hospitalization as an outcome are more highly associated. These data establish that injuries are a significant public health problem among elderly Americans.
Introduction
Injuries are generally considered a problem of the young. Consequently, not as much attention has been focused on injuries in the elderly population. What medical literature does exist on this topic typically focuses on the charac-terization and prevention of fulls, which is the leading cause of injuries among senior Americans.14 There are also data that have detailed injuries in segments of the U.S. population5•12, particular types ofinjuries13•1\ or injuries in other
na-tions, 15-17 but not nationally representative sampling data and not always with a
focus on the elderly. Also, data exist that are nationally representative- for ex-ample, the National Hospital Ambulatory Medical Care Survey (NHAMCS)18•19
-but these data have not been used to specifically characterize injuries among sen-ior Americans.
In addition, what is often ignored in the debate focusing on our aging population is any discussion of the disease burden that injuries carry. Typically, it is ailments such as cardiovascular disease, cancer, diabetes, and Alzheimer's that are noted in the press. 20 Of course, when grouping unintentional and intentional injuries together, injuries as a whole added up as only the gth leading cause of death among senior Americans in 2000.21 However, as this research will show, injuries from all causes carry a significant burden of suffering among the elderly-not only in terms of the mortality, but, more importantly and what is the focus of this paper, from the morbidity of nonfatal injuries.22
nonfatal injuries in the elderly treated in U.S. hospital emergency departments
(EDs)were analyzed from the National Electronic Injury Surveillance System-All
Injury Program (NEISS-AlP). This paper summarizes the first full year's worth
ofNEISS-AIP data from 200 I for nonfatal injuries of all intents among elderly
Americans (ages 65 and older). It also uses the 2000 NEISS-AlP data to model
statistical differences among male and female injury patterns and to determine
which factors are associated with hospitalization and treated and released as an
outcome following a nonfatal injury.
Methods
The NEISS-AlP database has its roots in the National Electronic Injury
Surveillance System (NEISS), a database that has been managed and operated by
the U.S. Consumer Product Safety Commission since 1972.23 It is used by the
Commission to identifY and monitor consumer product-related injuries and for
assessing risk to the public. Analyses based on this database set the stage for
de-veloping both voluntary and mandatory safety standards.
Since the early 1980s, CPSC has assisted other federal agencies by using
NEISS to collect injury related data of special interest to them. In 1997, the
inter-agency agreement was modified to conduct the three-month NEISS All Injury
Pi-lot Study at 21 NEISS hospitals. 24 This study demonstrated the feasibility of
expanding NEISS to collect data on all injuries. National estimates based on this
study indicated product-related injuries that fall into CPSC's jurisdiction
injuries treated in U.S. hospital EDs. The NEISS All Injury Program provides an excellent data source for monitoring national estimates of nonfatal injuries over time.
Beginning in July 2000, the National Center for Injury Prevention and Control (NCIPC), Centers for Disease Control and Prevention (CDC) in collabo-ration with the U.S. Consumer Product Safety Commission (CPSC) expanded the National Electronic Injury Surveillance System (NEISS) to collect data on all types and causes of injuries treated in a representative sample of 66 U.S. hospitals with emergency departments (ED). This system is called the NEISS All Injury Program (NEISS-AIP).
NEISS-AIP is operated by the U.S. Consumer Product Safety Commission and collects information on initial visits for all types and causes of injuries treated in U.S. EDs. The scope of data collection goes beyond routine reporting of inju-ries associated with consumer-related products in CPSC's jurisdiction to include all injuries and poisonings. These data can be used to (l) measure the magnitude and distribution of nonfatal injuries in the United States; (2) monitor unintentional and violence-related nonfatal injuries over time; (3) identifY emerging injury problems; ( 4) identifY specific cases for follow-up investigations of particular in-jury-related problems; and (5) set national priorities (6). Data are collected
pas-sively from all medical records concerning an injury diagnosis by paid coders at participating study hospitals. Only information contained in the medical record can be coded.
i
~
These data are drawn from a nationally representative subsample of 66
(out of I 00) NEISS-AlP hospitals, which were selected as a stratified probability
sample of hospitals with a minimum of six beds and a 24-hour ED in the U.S. and
its territories. 25•26 The sample includes separate strata for very large, large,
me-dium, and small hospitals, defmed by the number of armual ED visits per hospital.
Data for this report come from the first and second years ofNEISS-AIP
data collection in July-December 2000 and January-December 2001, respectively.
These are treated as separate databases for analysis purposes. The 2001 data have
been used to calculate armualized estimates and rates of injuries. The 2000 data
have been used in the bivariate and multivariate analysis. This was done because
only the 2000 dataset has been made available to the public by the CDC in a form
that allows for calculating multiple variable analyses.Z7 All data reported in this
paper will cite from which of these two sources they were derived.
NEISS-AlP provides data on roughly 500,000 injury- and consumer
prod-uct-related ED cases each year, representing approximately 31 million injuries.
Data from these cases are weighted by the inverse of the probability of selection
to provide national estimates.28 Annualized estimates for this report are based on
weighted data for 36,752 nonfatal injuries among the elderly treated in EDs
dur-ing January-December 2001 and 17,605 nonfatal injuries durdur-ing July-December
2000. U.S. Census Bureau population estimates for 2001 were utilized in order to
arrive at injury rates for the overall population and population subgroups (i.e.,
age, sex, and race/ethnicity), which are based on the 2001 data.Z9 Annualized
available from 2000. This procedure, of course, will not account for any seasonal variation in injury rates or patterns.
Data analyses were done using SAS version 8 (SAS Institute, Cary, NC) and Intercooled STAT A version 7 (College Station, TX). Statistical tests with two-tailed P < 0.05 were considered statistically significant. Testing was done using Pearson's X2 for bivariate analysis and logistic regression for multivariate
analysis. A direct variance estimation procedure was used to calculate 95% con-fidence intervals around the injury estimates and to account for the complex sam-ple design. 30 When analyzing NEISS-AlP by specific dispositions and intents of injury by age, sex, or race/ethnicity some national estimates were based on rela-tively few cases and therefore unstable. The statistical criteria for determining unstable or unreliable national estimates were: (1) computation, based on fewer than 20 NEISS-AlP cases (based on unweighted data), (2) national estimates less than 1,200 (based on weighted data), or (3) the coefficient of variation (CV) of the estimate greater than 30%.31
Nonfatal injuries were defined as bodily harm resulting from acute expo-sure to an external force or substance, including unintentional and violence-related causes. 32 Cases were excluded from this analysis if 1) the person was less than 65 years old; 2) the principal diagnosis was for a (a) non-injury illness (n =
1850), or (c) unknown (n = 0); and 3) the ED visit represented a fatality (n = 89,
either dead on arrival or died in ED).33 Deaths were excluded from the analysis
because they are not captured completely by NEISS-AlP. This is because it is
likely that if an injury leading to a death occurs outside a hospital ED, then this
case will not present to a hospital. Since there is no way to control for this
possi-bility, the designers of the NEISS-AlP database have recommended excluding
those few who die and are captured from any analysis in an attempt to ensure that
these data are for nonfutal injuries only. 34
All injuries were classified according to the age, sex, race/ethnicity,
mechanism of injury, disposition, diagnosis, primary body part injured, location,
and intent. Exact definitions of how these variables were coded are contained in
Appendix B, which was derived from the NEISS-AlP coding manual. 35 Often
only one entry is available in the ED record for race or ethnicity. The
classifica-tion scheme for these data analyses assumed that most white Hispanics probably
were recorded on the ED record as Hispanics and that most black Hispanics
probably were recorded as black. This is an assumption that the CDC uses and
recommends when analyzing data from NEISS-AlP
?
6 The mechanism of injuryis the precipitating mechanism (e.g., fall, struck by/against, motor vehicle
occu-pant) that initiated the chain of events leading to the injury, similar to the
underly-ing cause of an injury-related death. Mechanisms of injury were classified into
recommended major external cause-of-injury groupings37'38 according to
defini-tions consistent with the International Classification of Diseases, Ninth Revision,
di-agnosis and intent of the injury were classified according to the most severe pre-senting injury. 40
Because the outcome variable was dichotomous, the multivariate analysis utilized a logistic regression model weighted for the study data to determine which characteristics of age, sex, race/ethnicity, mechanism of injury, diagnosis, primary body part injured, location, and intent that were statistically significantly associated with hospitalization and associated with treated and released as out-comes. Those variables not reaching a two-tailed P value < 0.05 were dropped from the initial models after a Wald test was run to determine that these variables as a group were not statistically significantly related to the outcomes. The two
I
'models were then run again without these variables to determine the final adjusted results. The adjusted odds ratios of the final models with P values and 95% con-fidence intervals are reported in Table 8, Appendix A. Those variables not reach-ing statistical significance for the logistic regression modelreach-ing hospitalization as an outcome include: under sex (unknown/unspecified), under race/ethnicity (black; Hispanic; other, non-Hispanic), under mechanism of injury
A series of dummy variables were used in the logistic regression models in order to make interpretation of the adjusted odds ratios easier. The adjusted odds ratios are thus reported in reference to an arbitrarily chosen characteristic. Some reference odds ratio variables (those set to OR= 1.0) were chosen to make inter-pretation more intuitive. For example, the younger age bracket of 65-74 was a natural comparison for the two older age groups. "Females" were chosen as the reference for "males." "Whites" were chosen as the reference for race/ethnicity, although only the "unknown/unspecified" group reached statistical significance in the model. "Home" was chosen as the reference for the other categories of loca-tion where the injury occurred. "Unintenloca-tional/unknown" was chosen as the ref-erence for intent. For mechanism of injury, diagnosis, and primary body part injured, it was decided that the reference characteristic would be the variable with the lowest adjusted odds ratios for the hospitalization outcome. For example, "strain/sprain" was arbitrarily set with an adjusted odds ratio = 1.0 and all other
diagnoses are in comparison to this diagnosis with respect to the outcome ofhos-pitalization. It was hoped that this would ease interpretation of the adjusted odds ratios.
In order to compare nonfatal injuries to fatal injuries, a third database was utilized. The National Vital Statistics System injury fatality data for 2000, which includes information from all death certificates filed in the 50 states and the Dis-trict of Columbia as reported to the National Center for Health Statistics (NCHS), CDC. Mortality data are derived from the Multiple Cause of Death data.41 NCHS collects, compiles, verifies and prepares these data for release to the public.
t
E F
These data are available on the National Center for Injury Prevention and Control's CDC website via the Web-based Injury Statistics Query and Reporting System (WISQARS).42 WISQARS fatal mortality reports provide tables of the total numbers of injury-related deaths and the death rates per 100,000 population. The reports list deaths according to mechanism and intent of injury by state, race, Hispanic origin, sex, and age groupings. All 1999 and later mortality statistics in WISQARS futal injury data are based on codes in the International Classification of Disease-lOth Revision (ICD-10).43
Results - Univariate and Bivariate Analysis
f
During 2001, an estimated 935,556 males and 1,731,640 females (total
I
approximately 2. 7 million) senior Americans aged 2:65 were treated in EDs fornonfatal injuries (Appendix A, Table 1). This represented 5.7% of all nonfatal injuries for males and 13.3% of all nonfatal injuries for females. The overall in-jury rate per 100,000 persons was higher among females (8,466) than males
(6,404) (Appendix A, Table 1). The injury rate also increased with each higher age bracket for both females and males until it reached a rate of 15,272 for fe-males ages ;:::85 and 11,547 for fe-males ages 2:85. Blacks appeared to have higher overall injury rates than White/non-Hispanics as well (7,230 vs. 6,499, although there is overlap within the 95% confidence intervals); however, these results must be interpreted with caution given the large number of unknowns and instability in the calculations of other race/ethnicity categories (Appendix A, Table 2).
other mechanisms, falls caused the highest rates of injuries by far across this
population ( 4,684) with struck by or against having the next highest rate of injury
(600). However, this mechanism of injury was disproportionately represented
among females (67.1%) more than males (50.5%, P < 0.0001) (Appendix A,
Ta-ble 4). Yet, males had higher percentages of other causes of nonfatal injury,
in-cluding being struck by or against (11.2% vs. 7.7%, P < 0.0001), occupying a
motor vehicle (9.2% vs. 6.5%, P < 0.0001), and being cut or pierced (7.2% vs.
2.7%, P < 0.0001). Most injuries among the elderly were diagnosed as fractures
(25.2%) or contusions/abrasions (23.2%), followed by lacerations (18.3%),
strains/sprains (12.9%), and internal injuries (3.5%). Again, there were
differ-ences among females and males. Fractures were disproportionately represented
among females (28.9%) more than males (18.2%, P < 0.0001), while lacerations
were found more frequently among males (23.8%) than females (15.4%, <
0.0001).
The parts of the body affected most were the head/neck (25.8%),
arms/hands (21.7%), legs/feet (18.1%), lower trunk (18.0%), and upper trunk
(12.3%) (Appendix A, Figure 1). There were some differences between males
and females, most notably in the head/neck (28.4% vs. 24.4%, P value< 0.0001 ),
arm/hand (24.6% vs. 20.1%, P value< 0.0001), leg/foot (14.5% vs. 20.0%, P
value< 0.0001), and lower trunk (14.8% vs. 19.7%, P value< 0.0001) (Appendix
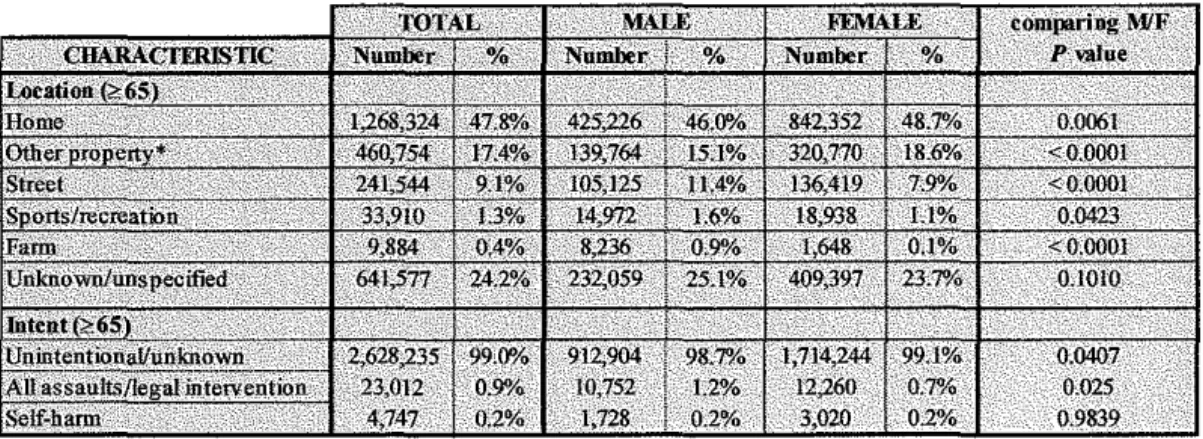
A, Figures 2 and 3, Table 5). The majority of nonfatal injuries among the elderly
did not appear to be intentional (99.0% unintentional/unknown) and occurred in
Most ofthe patients represented by these nonfatal injuries were treated
and then released (82.5% ), although an important number resulted in
tion (15.1 %). Females tended to have a lower treated and released to
hospitaliza-tion ratio (5.2:1) than males (6.0:1), suggesting that they were more likely to be
hospitalized after a nonfatal injury than their male counterparts. Further evidence
for this finding comes from the proportions of how many male injuries were
treated and released vs. hospitalized when compared to females, as well as higher
rates of hospitalization per 1 00,000 population for females than males ( 1 ,4 3 9 vs.
907, although the 95% confidence intervals do overlap) (Appendix A, Figure 5).
Table 7 in Appendix A shows that 83.6% of male injuries were treated
andre-leased while 81.9% offemale injuries were treated and reandre-leased (P = 0.0373),
whereas 14.0% of male injuries were hospitalized and 15.7% of female injuries
were hospitalized (P = 0.0331 ).
To compare nonfatal injuries to fatal injuries among the elderly, these
2001 NEISS-AlP data on nonfatal injuries were correlated with 2000 National
Vital Statistics System injury fatality data, which includes information from all
death certificates filed in the 50 states and the District ofColurnbia.44 The ratio of
nonfatal injuries to fatal injuries among those ages ~65 was significantly lower for
males ( 46:1) than females (1 00:1 ), indicating that it is more likely among the
eld-erly that an injury results in a fatality among males than among females. This
ra-tio also progressively decreased with each higher age bracket for both males and
females until for those ages ~85 the ratio was 30:1 among males and 64:1 among
females.
L
Results- Multivariate Analysis
One of the more interesting applications of this database is in studying what factors characterizing a nonfatal injury were associated with hospitalization. In this capacity, hospitalization serves as a proxy for severity of the injury, on the supposition that the more severe the injury, the more likely the patient was hospi-talized. Also, conversely, it is helpful to determine which factors were associated with being treated and released since these are likely to represent milder nonfatal injuries.
Because this is a cross-sectional study, when interpreting the odds ratios from the logistic regression modeling, it is only correct to state that there is an as-sociation between the outcome and the exposure. One cannot assign risk in these
I
lcircumstances, but one has to work backwards from the outcome to the exposure. Therefore, in this case, the outcomes, either hospitalization or treated and re-leased, will have higher odds of being associated with one particular exposure over another.
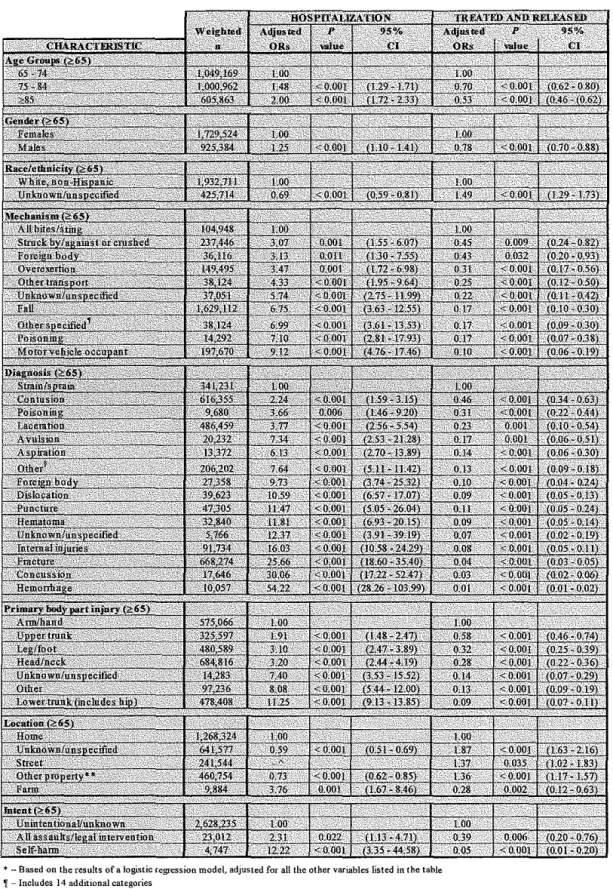
With that in mind, some of the findings (Appendix A, Table 8) from the logistic regression modeling ofhospitalization include increasing odds ratios for
each higher age bracket above 65-74 (OR= 2.00 for those ~85, P < 0.001), as well as a higher odds ratio associated with males (OR= 1.25, P < 0.001) when compared to females. This suggests that hospitalization is associated with being older or male. Similarly, the mechanism of injury with the highest odds of being associated with hospitalization was being a motor vehicle occupant (OR= 9.12, P
Frac-tures (OR= 25.66, P < 0.001) also had a high likelihood of being associated,
which was interesting when comparing this with the part of the body with the
highest odds, the lower trunk which includes the hips (OR= 11.25, P < 0.001).
Although the home (OR= 1.00) as a location was the reference odds ratio, it
ap-pears that hospitalization was also more highly associated with it than any other
location except farms (OR= 3.76, P < 0.001). Under intent, self-harm had the
highest odds ofhospitalization (OR= 12.22, P < 0.001).
Generally, the logistic regression odds ratios for the outcome of treated
and released was a mirror reflection ofhospitalization. Those characteristics for
which hospitalization had the highest odds ratios for having an association
gener-ally ranked with some of the lowest odds ratios for which treated and released was
associated. For example, the diagnosis of hemorrhage had an odds ratio of 54.22
for hospitalization while it had an odds ratio of0.01 (P < 0.0001) for treated and
released. Such evidence gives further weight to the findings of the logistic
regres-sion modeling with hospitalization as the outcome.
Discussion
These data confirm that injuries are a significant public health problem
among elderly Americans. Some of the important conclusions from these data
include: the similarities between nonfatal injuries among younger populations
and the elderly, characteristics associated with hospitalization as an outcome
fol-lowing nonfatal injuries, and differences between male and female nonfatal injury
Although the absolute numbers of nonfatal injuries among the elderly population are less than younger age groups (Appendix A, Figure 6), the rate for nonfatal injuries among this population was actually quite comparable (Appendix A, Figure 7). In fact, starting around age 65, the rates for nonfatal injuries begin to increase again after having steadily declined after the late-20s, peaking as high as 14,141 per 100,000 persons among the :0:85 population. This was similar to the nonfatal injury rate in the 25-29 (13,925) or 10-14 (13,252) age groups.
In addition, the rate ofhospitalization after a nonfatal injury among the
elderly (1 ,217) was significantly higher than any younger age group, suggesting, as other studies have also shown 45, that injuries among seniors tend to be of
greater severity. The multivariate logistic regression modeling for hospitalization as an outcome also shows which characteristics hospitalization tends to be more likely to be associated with. Characteristics with higher odds ratios for hospitali-zation probably represent the most severe presenting nonfatal injuries. Thus,
mechanisms of injury such as being a motor vehicle occupant (OR= 9.12, P <
l
0.001), poisoning (OR= 7.10, P < 0.001), and falls (OR= 6.75, P < 0.001); typesof injuries like hemorrhage (OR= 54.22, P < 0.001 ), concussion (OR= 30.06, P
higher likelihood of being hospitalized. This information also has implications
for those concerned with costs to the health care system as hospitalization is
cer-tainly one of the more expensive aspects of medical care.
Given the broad nature of this analysis, it is unclear from these data
ex-actly why nonfatal injuries appear to affect elderly females disproportionately
more than elderly males (Appendix A, Figure 8). However, many reasons could
be posited to help explain this difference. Females age 65 and older as a group
have an older average age as compared to males, a trend that alone could explain
some of the difference if being older in this population is associated with
in-creased risk of injury. Also as a result of being older, females are likely to be
I
widowers more often than their male counterparts, causing them to live at home
without another caregiver or to have to be institutionalized -both situations which
could increase their risk of injury. Alternatively, perhaps this difference in
nonfa-tal injury rates between senior females and males is not as surprising as it seems
given that this trend is actually the reverse of the situation for fatal injuries where
males 2:65 tended to have higher rates (140) than females (85) (Appendix A,
Fig-ure 9).46 In other words, the overall injury rate across both sexes may be equal
but it is possible that men are more likely to die as a result of an injury than their
female counterparts.
In addition, the reasons for the disparities between male and female
nonfa-tal injury patterns, such as differences in mechanism of injury, diagnosis and
pri-mary body part injured, remain unexplored. Some ofthese differences could
post-menopausal females than males or other disease burdens that fall disproportion-ately across the sexes, or differences in behavior and levels of activity. 47 It is im-portant to bear in mind, however, that these injury rates are not adjusted.
Adjusting for age, concurrent morbidities, or other characteristics could certainly reduce the differences; however, it could also widen them.
Most of the literature concerning injuries among the elderly focuses on falls and fall prevention, perhaps naturally given its prevalence and resulting bur-den of suffering. For example, it is estimated that one of every three people 65 years and older fulls each year.48 The total direct cost of all full injuries for the elderly in 1994 was $20.2 billion.49
events (all results are discounted 1996 dollars) - essentially nearly $1 billion in direct costs for only two states. One final article that examined the impact of fu-ture costs from several elderly morbidities, including hip fracfu-tures found that without major changes in the health of our older population, these health care costs will escalate enormously, in large part as a result of the projected growth of the "oldest old," those aged 85 years and above. Medicare costs for the oldest old may increase sixfold by the year 2040 (in constant 1987 dollars).52
Limitations
The fmdings in this paper are subject to at least six limitations. First, this study design provides only national estimates and does not allow for estimates by region, state, or local area. Second, NEISS-AlP data are based only on informa-tion in ED records and are not linked to or supplemented with other data sources (e.g., hospital inpatient records or ambulatory care settings). This means that the calculations based on this database likely under-reports the total number of annual nonfatal injuries in the U.S. However, on the other hand, it probably captures a representative sample of the more acute or severe injuries given that its sampling base is hospital emergency departments.
~-days after leaving the ED. However, given the manner in which these data are collected, it is not possible to exclude or characterize these later deaths.
Fourth, NEISS-AlP data reflect only those injuries that were severe enough to require treatment in an ED. Again, this probably under-represents a substantial amount of the total number of nonfatal injuries occurring each year since many probably also seek care in settings other than a hospital ED. Fifth, the NEISS-AlP database does not allow for more than one injury per ED case presentation and only records information from the ED record regarding the most severe injury- again, this likely under-reports the total number of injuries if the goal is to account for all the different actual types of injuries that occur. And, fi-nally, there are certain categories of interest that contain a significant number of unknowns, in particular, race/ethnicity (17.1%), location (24.2%), and intent (99.0% unintentional or unknown). Therefore, conclusions regarding these
should be interpreted with caution. In addition, data for intent probably represents a conservative estimate of assault-related injuries treated in EDs because these cases are generally under-reported53, and those cases where intent can not be
con-elusively determined from the ED record are grouped together with unintentional injuries.
likely to occur in the summer (e.g., firearm-related assaults) and fall (e.g., unin-tentional, recreational firearm-related injuries). 54 Thus, as an example, the overall annualized national estimate for firearm-related injuries based on data from this six-month period is likely to be higher than the estimate based on data obtained from the entire year 2000.
Conclusion
This analysis should serve as a starting point for public health profession-als, government, and the general public to better understand the magnitude and
L
characteristics of nonfatal injuries among senior Americans. Findings highlighted in this report, including the increasing rates and severity of injuries among the elderly and the differences among male and female injury patterns are a basis for further investigations into this public health problem.
rates among the elderly remain constant, there is a significant bump in the number
of injuries in this population. This trend, of course, is not limited to just the
United States and is, in fact, an international phenomenon. At least one
publica-tion has calculated that deaths from injury (and likely nonfatal injuries as well)
will increase globally through 2020.57
Data from NEISS-AlP can continue to be a source for monitoring trends,
evaluating interventions, and characterizing nonfatal injuries among the elderly,
especially as the population continues to age. Research should be directed at
fur-ther exploring the causes behind these trends and in designing and evaluating
pre-ventive measures. As one recent article has demonstrated58, even current injury
prevention programs that have been established as cost effective are not being
op-tirnally implemented. Injury prevention often can reduce medical costs and save
Acknowledgements
A significant amount of the data analysis upon which this paper is based
was done while completing a senior medical student epidemiology elective at the
Centers for Disease Control and Prevention in Atlanta, Georgia. The author
would like especially to thank his preceptor, Dr. Ann Dellinger, PhD, MPH,
sen-ior researcher in the National Center for Injury Prevention and Control (NCIPC).
This analysis was also based on expertise offered by K Gotsch and JL Annest,
PhD, Office of Statistics and Programming, NCIPC; J Stevens, PhD, Division of
Unintentional Injury Prevention, NCIPC; and data collected by the U.S.
Con-sumer Product Safety Commission. In addition, the author would like to thank his
master's thesis advisor, Dr. Adam Goldstein, for his guidance, tolerance, and
per-severance in seeing this through, as well as his second reader, Dr. Carol Runyan,
Appendix A - Tables and Figures
Table 1. Estimated mnnbers, percentages, and rate (per 100,000 population) of nonfutal injuries presenting to hospital EDs, by sex and age, 2001 NEISS-AlP data.
Table 2. Estimated numbers, percentages, and rate (per I 00,000 population) of nonfatal injuries presenting to hospital EDs for ages 265, by race/ethnicity and sex, 200 I NEISS-AlP data
" • Often only one entry is ava:ilaHe in the FD m::ord fur ra:e or ethnicity. The classification sc:he!m fur thesedataamlyses assum.U that JIDSt white Hispanics probably were recorded. on theiD recad a; Hspanics and that tmSt black Hisplllic> prohilly Mre reo:xded a; l:tdc.
* • National estinD:emigH be umtable because it is bastrl on <20 Ci&'S or the coefficient ofvmation is >3Wn
** ·There is no demminatorpopulation fiomwhK:h to calaJ1ate a rate.
Table 3. Estimated numbers, percentages, and rate (per 100,000 population) of nonfatal injuries pre·
senting to hospital EDs for mechanism of injury and diagnosis, by sex for ages ~65, 2001 NEISS-AlP
data.
* - includes 14 additional categories '' - includes I 1 additional categories
Table 4. Estimated percentages and chi-square significance testing for
dif-ferences between male and female mechanism of injury and diagnosis for
ages ~65, 2000 NEISS-AlP data.
* - includes 14 additional categories
.~ - includes II additional categories
L
L
'
L
0 I8J.I'/o
Figure 1. Proportions of body regions
injured for both sexes for ages <:65, 2000 NEISS-AIP data.
il'IJi% I!IQ:Y'/o
illlkw.l'neck
D!.eWfuot
• Uppo-trunk
ll Unlm:mn'Uil'lpecified
i!IAnn'hand
0 l.mwrtrunk(bK1udo;hlp)
~Other
Figure 2. Proportions of body regions injured for females for ages 2:65, 2000 NEISS-AIP data.
Dal.IJ'/o
t:'i43'/o liiO?Y~
Figure 3. Proportions of body regions injured for males for ages <:65, 2000 NEISS-AIP data.
Table 5. Chi-square significance testing for differences between male and female body regions injured for ages <:65, 2000 NEISS-AlP data; and injury rates, 2001 NEISS-AlP data
f--Figure 4. Injury rates for location where injury occurred by sex for ages <:65 with 95%
Cl, 2001 NEISS-AlP data.
Home Other property
(public, industry,
school settings)
Street
!!!!Male
Sports/recreation* Fann Unknown/unspecified
IIIII Female OTotal
I
* - National estimate might be unstable because it is based on <20 cases or the coefficient of
varia-tion is > 30%.
Table 6. Chi-square significance testing for differences between male and female intent and location of injuries for ages <:65, 2000 NEISS-AlP data.
* -Includes public, industrial, and school settings
j__
t--8,000
7,000
6,000
Figure 5. Injury rates for disposition by sex for ages ;o:65 with 95% CI, 200 I
NEISS-AlP data.
Treated/released Hospitalized Transferred Observed* Unknown/unspecified*
I!!! Male Ill! Female DTotal
* - National estimate might be unstable because it is based on <20 cases or the coefficient of varia-tion is >30%.
Table 8. Adjusted* odds ratios comparing hospitalization and treated and released with case characteristics, 2000 NEISS-AlP data.
*-Based on the results of a logistic regression model, adjusted for a!! the other vanables listed in the table
~-Includes 14 additional categories §-includes 10 additional categories
"-Characteristic not significant m the hospitalized loglStic regression model
** -public, industrial, and school settings
L
Figure 6. Number of nonfatal injuries for all ages by sex, 2002 NEISS-AlP data.
s 12 16 ro 24 2s n ~ ~ « 48 £ 56 60 64 ~ n % ~ 88 92 96 100 104 108
Age
II Females ~Males
Figure 7. Rate of nonfatal injuries per 100,000 population for all ages by sex, 2001
NEISS-AIP data.
Figure 8. Rate of nonfatal injuries per 100,000 population for all ages by sex with 95% CI. Data are from 2001 NEISS-AIP. Data for calculating error bars beyoud age 85 are not available.
Age
--Males --Females
Figure 9. Rate of nonfatal injuries per 100,000 population for all ages by sex, male and female separated out with 95% CI. Data are from 2000 National Vital Statistics System injury fatality data. Data for calculatiug error bars not available.
Age --Males -+-Females
~-250,000
200,000
150,000
100,000
50,000
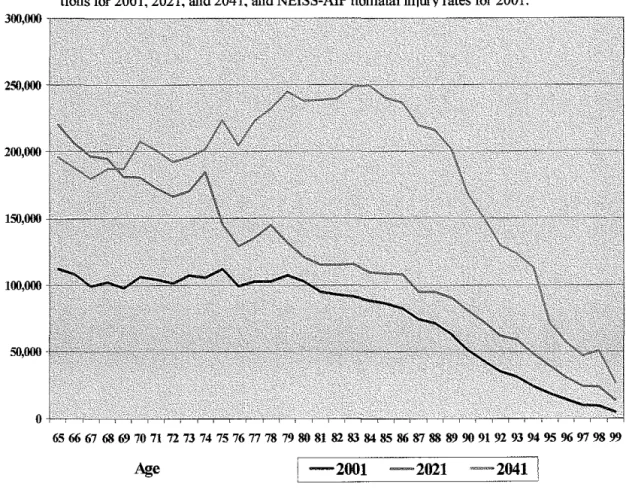
Figure 10. Projected number of nonfatal injuries in 2001, 2021, and 2041 for ages <:65,
using current injury rates. Based upon data from Census Bureau U.S. population projec-tions for 2001. 2021, and 2041. and NEISS-AIP nonfatal injury rates for 2001.
Age
! -2001 -2021 -2041 1L
L
L
Appendix B - How selected variables in NEISS-AlP are coded'9
I. General Characteristics:
Age: Age in years of the patient at the time of treatment, as recorded on the emergency department record.
Sex: Sex of the patient as recorded on the emergency department record. The three
pos-sible categories are male, female, and unknown/undetermined.
Race/Hispanic origin: Race and Hispanic origin of the patient is defined as recorded on
the emergency department (ED) record. On the ED record, often only one entry is avail-able for race or ethnicity. The classification scheme for this system assumes that most white Hispanics probably were recorded on the ED record as Hispanics, and most black Hispanics probably were recorded as black.
II. Mechanism oflnjury (also known as precipitating cause):
Cut/pierce/stab: Injury resulting from an incision, slash, perforation, or puncture by a
pointed or sharp instrument, weapon, or object. This category does not include injury from being struck by or against a blunt object (such as the side of a night stand) or bite wounds; these injuries fall in the category "struck by/against."
Fall: Injury received when a person descends abruptly due to the force of gravity and
strikes a surface at the same or lower level.
Foreign body: Injury resulting from entrance of a foreign body into or through the eye
or other natural body opening that does not block an airway or cause suffocation (as-phyxia). Examples include pebble or dirt in eye, BB in ear, or small children's toys in esophagus.
Other bite/sting: Injury from a poisonous or non-poisonous bite or sting through the
skin, other than a dog bite. This category includes human bite, cat bite, snake or lizard bite, insect bite, stings from coral or jellyfish, or bites and stings by other plants and ani-mals.
Overexertion: Working the body or a body part too hard, causing damage to muscle,
tendon, ligament, cartilage, joint, or peripheral nerve (e.g., common cause of strains, sprains, and twisted ankles). This category includes overexertion from lifting, pushing, or pulling or from excessive force.
Poisoning: Ingestion, inhalation, absorption through the skin, or injection of so much of
a drug, toxin (biologic or non-biologic), or other chemical that a harmful effect results, such as drug overdoses. This category does not include harmful effects from normal therapeutic drugs (i.e., unexpected adverse effects to a drug administered correctly to treat a condition) or bacterial illnesses.
Struck by/against or crushed: Injury resulting from being struck by (hit) or crushed by
a human, animal, or inanimate object or force other than a vehicle or machinery; injury
L
!
caused by striking (hitting) against a human, animal, or inanimate object or force other than a vehicle or machinery.
Motor vehicle occupant: Injury to a driver or passenger of a motor vehicle caused by a collision, rollover, crash or some other event involving another vehicle, an object, or a pedestrian. This category includes occupants of cars, pickup trucks, vans, heavy
transport vehicles, buses, and SUVs. Injuries to occupants of other types of vehicles such as ATVs, snowmobiles, and go-carts fall in the category of "other transport."
Other transport: Injury to a person boarding, alighting, or riding in or on all other transport vehicles involved in a collision or other event with another vehicle, pedestrian,
or animal not described above. It includes railway, water, air, space, animal and animal
drawn conveyances (e.g., horseback riding), ATVs, battery-powered carts, ski lifts, and other cable cars not on rails.
Unknown/unspecified cause: Injury for which the emergency department report does not provide enough information to describe the cause of injury.
Other specified causes: Injury associated with any other specified cause that does not fit another category. Some examples include causes such as electric current, electrocution, explosive blast, fireworks, overexposure to radiation, welding flash burn, or animal scratch. For the purposes of this analysis, it also includes 14 additional categories sub-sumed under this heading:
-Adverse effect from therapeutic drugs: Injury associated with adverse ef-fects during correct drug properly administered in therapeutic or prophy-lactic doses. Does not include accidental overdose of drugs or wrong drug given in error.
-Adverse effect from surgery/medical care: Complications associated with adverse events during medical care or surgical procedures causing injury. Includes foreign body left in surgical site, adverse effects of use of
medi-cal devices; failure in medimedi-cal procedures for treatment or therapy. Does not include accidental overdose of drugs or wrong drug given in error.
-DB/pellet gunshot: A penetrating force injury resulting from a BB, pellet, or other projectile shot from a BB or pellet gun (a compressed air or C02-powered BB or pellet gun). This category includes gunshot wound from a BB or pellet ri-fle or pistol. This category does not include injury caused by a compressed air-powered paint gun or nail gun, which falls in the category "other specified."
-Dog bite: Injury caused by a dog bite. This category does not include injury from other animal bites.
-Drowning/near drowning/submersion: Suffocation (asphyxia) resulting from submersion in water or another liquid.
-Firearm gunshot: A penetrating force injury resulting from a bullet or other projectile shot from a powder-charged gun. This category includes gunshot
does not include injury caused by a compressed air-powered paint gun or a nail gun, which falls in the "other specified" category.
-Fire/burn/inhalation: Severe exposure to flames, heat, or chemicals that leads
to tissue damage in the skin or places deeper in the body; injury from smoke in-halation to the upper airway, lower airway, or lungs.
-Inhalation/ingestion/suffocation: Inhalation, aspiration, or ingestion of food or
other object that blocks the airway or causes suffocation; intentional or accidental mechanical suffocation due to hanging, strangulation, lack of air in a closed place, plastic bag or falling earth. This category does not include injury resulting from a foreign body that does not block the airway (see foreign body).
-Machinery: Injury that involves operating machinery, such as drill presses,
fork lifts, large power-saws, jack hammers, and commercial meat slicers. This category does not include injury involving machines not in operation, falls from escalators or moving sidewalks, or injuries from powered lawn mowers or other powered hand tools or home appliances.
-Natural/environmental: Injury resulting from exposure to adverse natural and
environmental conditions (such as severe heat, severe cold, lightning, sunstroke, large storms, and natural disasters) as well as lack of food or water.
-Pedestrian (struck by or against a vehicle): Injury to a person involved in a
collision, where the person was not at the time of the collision riding in or on a motor vehicle, railway train, motorcycle, bicycle, airplane, streetcar, animal-drawn vehicle, or other vehicle. This category includes persons struck by cars, pickup trucks, vans, heavy transport vehicles, buses, and SUVs. This category does not include persons struck by other vehicles such as motorcycles, trains, or bicycles; these cases fall in the category of "other transport."
-Pedal cyclist: Injury to a pedal cycle rider from a collision, loss of control,
crash, or some other event involving a moving vehicle or pedestrian. This cate-gory includes riders of unicycles, bicycles, tricycles, and mountain bikes. This category does not include injuries unrelated to transport (moving), such as repair-ing a bicycle.
-Motorcyclist: Injury to a driver or passenger of a motorcycle resulting from a
collision, loss of control, crash, or some other event involving a vehicle, object, or pedestrian. This category includes drivers or passengers of motorcycles ( clas-sic style), sidecars, mopeds, motorized bicycles, and motor-powered scooters.
Ill. Intent of injury:
Assault, three types of assault plus "legal intervention" subsumed into one "assault"
category, made up of:
-Assault: Confirmed or suspected: Injury from an act of violence where physical
force by one or more persons is used with the intent of causing harm, injury, or
}-death to another person; or an intentional poisoning by another person. This category includes perpetrators as well as intended and unintended victims of vio-lent acts (e.g., innocent bystanders). This category excludes unintentional shoot-ing victims (other than those occurrshoot-ing durshoot-ing an act of violence), unintentional drug overdoses, and children or teenagers "horsing" around.
-Assault- other: This category includes a majority of the assaults and excludes cases where the reason for the assault was classified as sexual assault (as defmed below). If the emergency department record did not indicate that the assault in-volved sexual assault, then it was coded as other assault.
-Assault- sexual: An assault as defined above that also involves
• the use of physical force to compel another person to engage in a sexual act against his or her will, whether the act is completed or not,
• attempted or completed sex act involving a person unable to I) understand the nature of the act,
2) decline participation, or
3) communicate unwillingness to participate for whatever rea-son.
• abusive sexual contact: intentional touching, either directly or through the clothing, of the genitalia, anus, groin, breast, inner thigh, or buttocks of any person against his or her will or of a person who is unable to con-sent (e.g., because of age, illness, disability, the influence of alcohol or other drugs) or refuse (e.g., due to the use of guns or other non-bodily weapons, or due to physical violence, threats of physical violence, real or perceived coercion, intimidation or pressure, or misuse of authority). This category includes rape, completed or attempted; sodomy, completed or attempted; and other sexual assaults with bodily force, completed or attempted. Also, for all assault cases, there were two additional sub-data elements collected:
-Legal intervention: Injury or poisoning caused by police or other legal authori-ties (including security guards) during Ia w enforcement activiauthori-ties. Includes inju-ries and poisonings (mace, pepper spray) inflicted during legal action or
execution, or while attempting to enforce the law such as arrest or restraint of ar-rested persons.
Self-harm, confirmed or suspected: Injury or poisoning resulting from a deliberate vio-lent act inflicted on oneself with the intent to take one's own life or with the intent to harm oneself This category includes suicide, suicide attempt, and other intentional self-harm.
References
1 Sorock GS. Falls among the elderly: epidemiology and prevention. American Journal of
Pre-ventive Medicine 4(5):282-8, 1988 Sep-Oct.
2 O'Loughlin JL, et al. Incidence of and risk factors for falls and injurious falls among the
com-munity-dwelling elderly. American Journal of Epidemiology 137(3):342-54, 1993 Feb 1.
3
Sehested P and Severin-Nielsen T. Falls by hospitalized elderly patients: causes, prevention. Geriatrics 32( 4 ): I 01-8, April 1977.
4 Jessen J, Lundin-Olsson L, Nyberg L, Gustafson Y. Fall and injury prevention in older people
living in residential care facilities. A cluster randomized trial. Annals of Internal Medicine 136(10):733-41, 2002 May 21.
5
Brewer RD, Morris PD, Cole TB. Hurricane-related emergency department visits in an inland area: an analysis of the public health impact of Hurricane Hugo in North Carolina. Annals of Emergency Medicine 23(4):731-6, Aprill994.
6 Schwarz DF, et al. A longitudinal study of injury morbidity in an African-American population.
JAMA 271(10):755-60, 1994 March 9.
7
Bijur PE, et al. The epidemiology and causes of injuries resulting in hospitalization in New York City: 1990-1992. Bulletin of the New York Academy of Medicine 74( 1 ):31-50, Summer 1997.
8 Grisso JA, et al. Injuries among inner-city minority women: a population-based longitudinal
study. American Journal of Public Health 86(1):67-70, Jan 1996.
9 Schuster M, et al. Overview of causes and costs of injuries in Massachusetts: a methodology for
analysis of state data. Public Health Reports 110(3):246-50, May-June 1995.
10 Schnitzer PG and Runyan CW. Injuries to women in the United States: an overview. Women &
Health 23(1):9-27, 1995.
" Hunting KL, et al. Surveillance of construction worker injuries through an urban emergency department. Journal of Occupational Medicine 36(3):356-64, March 1994.
12
Grisso Ja, et al. Injuries in an elderly inner-city population. Journal of the American Geriatrics Society 38(12):1326-31, Dec 1990.
13
Cesare J, et al. Characteristics of blunt and personal violent injuries. Journal ofTrauma-Injury Infection & Critical Care 30(2):176-82, Feb 1990.
14 Polen MR and Friedman GD. U.S. Preventive Services Task Force. Automobile injury-
se-lected risk factors and prevention in the health care setting. JAMA 259(1):76-80, 1988 Jan 1.
15
Plasencia A and Borrell C. Population-based study of emergency department admissions and deaths from injuries in Barcelona, Spain: incidence, causes and severity. European Journal of Epidemiology 12(6):601-10, Dec 1996.
16
17 Pickett W, eta!. Nonfatal farm injuries in Ontario: a population-based survey. Accident
Analy-sis & Prevention27(4):425-33, Aug 1995. 18
For the latest analysis of this database, see: Stussman BJ. National Hospital Ambulatory Medi-cal Care Survey: 1995 emergency department summary. Advance Data (285): 1-19, 1997 April
15.
19 Burt CW and McCaig LF. Trends in hospital emergency department utilization: United States,
1992-99. Vital & Health Statistics- Series 13: Data from the National Health Survey (150):1-34,
Sept 2001.
20
Ragland DR, eta!. Disease and injury in California with projections to the year 2007: implica-tions for medical education. Western Journal of Medicine 168(5):378-99, May 1998.
21
Office of Statistics and Programming. Fatal injury mortality reports 2000. Atlanta, Georgia: National Center for Injury Prevention and Control, CDC. Available at:
http://webapp.cdc.gov/sasweb/ncipc/mortratelO.html.
22
McClure RJ and Douglas RM. The public health impact of minor injury. Accident Analysis &
Prevention 28(4):443-51 July 1996.
23
United States Department of Health and Human Services, Centers for Disease Control and Pre-vention, National Center for Injury Prevention and Control and United States Consumer Product Safety Commission. National Electronic Injury Surveillance System All Injury Program, 2000. ICPSR 3582 accompanying Coding Manual. Atlanta, GA: U.S. Department of Health and Human Services, Centers for Disease Control and Prevention, National Center for Injury Prevention and Control [producer], 2002. Ann Arbor MI: Inter-university Consortium for Political and Social Re-search [distributor], 2003.
24 Quinlan KP, Thompson MP, Annest Jl., eta!. Expanding the National Electronic Injury
Sur-veillance System to Monitor All Nonfatal h1iuries Treated in U.S. Hospital Emergency Depart-ments. Annals of Emergency Medicine 1999;34:637-643.
25
U.S. Consumer Product Safety Commission. NEISS All h1iury Program: sample design and
implementation. In: Schroeder T, Ault K, eds. Washington, DC: U.S. Consumer Product Safety Commission, 2000.
26
U.S. Consumer Product Safety Commission. NEISS coding manual2000. Washington, DC: U.S. Consumer Product Safety Commission, 2000.
27
U.S. Department ofHealth and Human Services, Centers for Disease Control and Prevention, National Center for Injury Prevention and Control, and United States Consumer Product Safety Commission. NATIONAL ELECTRONIC INJURY SURVEILLANCE SYSTEM ALL INJURY PROGRAM, 2000[Computer file]. ICPSR version. Atlanta, GA: U.S. Department ofHealth and Human Services, Centers for Disease Control and Prevention, National Center for Injury Preven-tion and Control [producer], 2002. Ann Arbor MI: Inter-university Consortium for Political and Social Research [distributor], 2003.
28
29 U.S. Census Bureau. Resident population projections of the United States by age, sex, race, and
Hispanic origin: 1992 to 2050 (machine readable file). Washington, DC, 2000. For more infor-mation about population data, visit the Bureau of the Census website at: www.census.gov.
30
U.S. Consumer Product Safety Cormnission. NEISS All Injury Program: sample design and
implementation. In: Schroeder T, Ault K, eds. Washington, DC: U.S. Consumer Product Safety
Commission, 2000.
31 United States Department of Health and Human Services, Centers for Disease Control and
Pre-vention, National Center for Injury Prevention and Control and United States Consumer Product Safety Cormnission. National Electronic Injury Surveillance System All Injury Program, 2000. ICPSR 3582 accompanying Coding Manual, 5. Atlanta, GA: U.S. Department of Health and Hu-man Services, Centers for Disease Control and Prevention, National Center for Injury Prevention
and Control [producer], 2002. Ann Arbor MI: Inter-university Consortium for Political and Social
Research [distributor], 2003.
32 U.S. Consumer Product Safety Commission. NEISS coding manual2000. Washington, DC:
U.S. Consumer Product Safety Commission, 2000.
33
United States Department of Health and Human Services, Centers for Disease Control and Pre-vention, National Center for Injury Prevention and Control and United States Consumer Product Safety Commission. National Electronic Injury Surveillance System All Injury Program, 2000.
ICPSR 3582 accompanying Coding Manual, 7. Atlanta, GA: U.S. Department of Health and
Hu-man Services, Centers for Disease Control and Prevention, National Center for Injury Prevention
and Control [producer], 2002. Ann Arbor MI: Inter-university Consortium for Political and Social
Research [distributor], 2003.
34
United States Department of Health and Human Services, Centers for Disease Control and Pre-vention, National Center for Injury Prevention and Control and United States Consumer Product Safety Cormnission. National Electronic Injury Surveillance System All Injury Program, 2000.
ICPSR 3582 accompanying Coding Manual, 7. Atlanta, GA: U.S. Department ofHealth and
Hu-man Services, Centers for Disease Control and Prevention, National Center for Injury Prevention
and Control [producer], 2002. Ann Arbor MI: Inter-university Consortium for Political and Social
Research [distributor], 2003.
35
U.S. Consumer Product Safety Commission. NEISS coding manual, all injury July 2002. Washington, DC: U.S. Consumer Product Safety Commission, 2002.
36 United States Department of Health and Human Services, Centers for Disease Control and
Pre-vention, National Center for Injury Prevention and Control and United States Consumer Product Safety Commission. National Electronic Injury Surveillance System All Injury Program, 2000. ICPSR 3582 accompanying Coding Manual, 7. Atlanta, GA: U.S. Department of Health and Hu-man Services, Centers for Disease Control and Prevention, National Center for Injury Prevention
and Control [producer], 2002. Ann Arbor MI: Inter-university Consortium for Political and Social
Research [distributor], 2003.
37
CDC. Recommended framework for presenting injury mortality data. MMWR 1997;46(No. RR-14).
38
Annest JL, Pogostin CL. CDC's short version of the ICECI (International Classification of Ex-ternal Causes of Injury): a pilot study. Report to the World Health Organization Collaborating Centers on the Classification of Disease. Atlanta, Georgia: U.S. Department of Health and Human Services, CDC, National Center for Injury Prevention and Control, 2000.
r
L
L
l
39 U.S. Department of Health and Human Services, Generic ICD-9-CM. Hospital version 1999.
Reno, Nevada: Channel Publishing LTD, 1998.
40 U.S. Consumer Product Safety Commission. NEISS coding manual, all injury July 2002.
Washington, DC: U.S. Consumer Product Safety Commission, 2002.
41
Hoyert DL, Arias E, Smith BL, Murphy SL, Kochanek KD. Deaths: Final data for 1999. Na-tional Vital Statistics Reports. Vol. 49, No.8, Hyattsville, Maryland: NaNa-tional Center for Health Statistics, 200 I.
42
CDC. Web-based Injury Statistics Query and Reporting System (WISQARS) [Online]. (2002). National Center for Injury Prevention and Control, Centers for Disease Control and Prevention (producer). Available from: URL: www.cdc.gov/ncipc/wisgars. [accessed April2003].
43 World Health Organization. International statistical classification of diseases and related health
problems. Tenth revision. Geneva, Switzerland: World Health Organization, 1992.
44 Office of Statistics and Programming. Fatal injury mortality reports 2000. Atlanta, Georgia:
National Center for Injury Prevention and Control, CDC. Available at: http://webapp.cdc.gov/sasweb/ncipc/mortrate!O.htrol.
45
Cunningham C, Howard D, Walsh J, Coakley D, O'Neill D. The effects of age on accident se-verity and outcome in Irish road traffic accident patients. Irish Medical Journa/94( 6): 169-71, June 2001.
46 Office of Statistics and Programming. Fatal injury mortality reports 2000. Atlanta, Georgia:
National Center for Injury Prevention and Control, CDC. Available at: http:/ /webapp.cdc.gov/sasweb/ncipc/mortrate I O.htrol.
47 CDC. Surveillance for injuries and violence among older adults. MMWR 1999;48(No. SS-8).
48
Tinetti ME, Speechley M, Ginter SF. Risk fuctors for falls among elderly persons living in the community. New England Journal of Medicine 1988;319(26):1701-7.
49
Englander F, Hodson TJ, Terregrossa RA. Economic dimensions of slip and full injuries. Jour-nal ofForensic Science 1996;41(5):733-46.
50
Bishop CE, et al. Medicare spending for injured elders: are there opportunities for savings? Health Affairs 21(6):215-23, 2002 Nov-Dec.
51 Thomas EJ, et al. Costs of medical injuries in Utah and Colorado. Inquiry 36(3):255-64, Fall
1999.
52 Schneider ELand Guralnik JM. The aging of America: impact on health care costs. JAMA.
263(17):2335-40, 1990 May 2.
53
CDC. Nonfutal physical assault-related injuries treated in hospital emergency departments-United States, 2000. MMWR 2002;5l(No. 21).
54 United States Department of Health and Human Services, Centers for Disease Control and
Pre-vention, National Center for Injury Prevention and Control and United States Consumer Product Safety Commission. National Electronic Injury Surveillance System All Injury Program, 2000. ICPSR 3582 accompanying Coding Manual. Atlanta, GA: U.S. Department of Health and Human
'
E
Services, Centers for Disease Control and Prevention, National Center for Injury Prevention and Control [producer], 2002. Ann Arbor MI: Inter-university Consortium for Political and Social Re-search [distributor], 2003.
55 CDC. Public Health and Aging: Trends in Aging- United States and Worldwide. MMWR
2003;52(No. 06):101-6. Figures taken from: U.S. Census Bureau. International database. Table 094. Midyear population, by age and sex. Available at:
http://www.census.gov/populationlwww/orojections/natdet-DlA.htrnl
56
CDC. Public Health and Aging: Trends in Aging - United States and Worldwide. MMWR
2003;52(No. 06):101-6. Figures taken from: U.S. Census Bureau. International database. Table 094. Midyear population, by age and sex. Available at:
http://www.census.gov/porulation/www/projections/natdet-DlA.htrnl.
57
Murry CJ and Lopez AD. Alternative projections of mortality and disability by cause
1990-2020: global burden of disease study. Lancet 349(9064):1498-504, 1997 May 24.
58 Miller TR and Levy DT. Cost-outcome analysis in injury prevention and control: eighty-four
recent estimates for the United States. Medical Care 38(6):562-82, June 2000.
59 United States Department of Health and Human Services, Centers for Disease Control and
Pre-vention, National Center for Injury Ptevention and Control and United States Consumer Product Safety Conunission. National Electronic Injury Surveillance System All Injury Program, 2000. ICPSR 3582 accompanying Coding Manual Atlanta, GA: U.S. Department of Health and Human Services, Centers for Disease Control and Prevention, National Center for Injury Prevention and Control [producer], 2002. Ann Arbor MI: Inter-university Consortium for Political and Social Re-search [distributor], 2003.
L
'
L
;
L
t
Bibliography
Annest JL, Pogostin CL. CDC's short version of the ICECI (International
Classification ofExternal Causes of Injury): a pilot study. Report to the World Health Organization Collaborating Centers on the Classification of Disease. Atlanta, Georgia: U.S. Department ofHealth and Human
Services, CDC, National Center for Injury Prevention and Control, 2000.
Bijur PE, et al. The epidemiology and causes of injuries resulting in
hospitalization in New York City: 1990-1992. Bulletin of the New York
Academy of Medicine 74(1):31-50, Summer 1997.
Bishop CE, et al. Medicare spending for injured elders: are there opportunities for savings? Health Affairs 21(6):215-23, 2002 Nov-Dec.
Brewer RD, Morris PD, Cole TB. Hurricane-related emergency department visits in an inland area: an analysis of the public health impact of Hurricane Hugo in North Carolina Annals of Emergency Medicine 23( 4):731-6, Aprill994.
Burt CW and McCaig LF. Trends in hospital emergency department utilization:
United States, 1992-99. Vital & Health Statistics- Series 13: Data from
the National Health Survey (150):1-34, Sept 2001.
Cesare J, et a!. Characteristics of blunt and personal violent injuries. Journal of
Trauma-Injury Infection & Critical Care 30(2): 176-82, Feb 1990.
CDC. Nonfatal physical assault-related injuries treated in hospital emergency departments- United States, 2000. MMWR 2002;5l(No. 21).
CDC. Public Health and Aging: Trends in Aging- United States and Worldwide.
MMWR 2003;52(No. 06):101-6. Figures taken from: U.S. Census
Bureau. International database. Table 094. Midyear population, by age and sex. Available at:
http://www.census.gov/populationlwww/projections/natdet-DlA.html.
CDC. Recommended framework for presenting injury mortality data. MMWR
1997;46(No. RR-14).
CDC. Surveillance for injuries and violence among older adults. MMWR 1999;48(No. SS-8).