..
Asthma ED, Outpatient & Inpatient Utilization in Durham County Among Children Enrolled in CCNC
By
Elizabeth Azzato
A Master's Paper submitted to the faculty of the University of North Carolina at Chapel Hill
In partial fulfillment of the requirements for the degree of Master of Public Health in
ABSTRACT. Objectives: To determine if an association exists in Durham County between time the North Carolina Medicaid care management program (CCNC) has been in place and changes in service utilization patterns among asthmatic children, and to assess the relationship between program duration and
racial disparities.
Methods: CCNC program years 2000,2001, 2002 were evaluated. Individuals
aged 0-18 with an asthma Medicaid claim (ICD9 code 493.xx) emolled in CCNC
were eligible. Incidence rate ratios and likelihood rates were calculated for outpatient, ED and hospital use, controlling for age, race, gender, pregnancy,
welfare status and person-months. Analysis was also done with sample stratified by race.
Results: Compared to 2000, the adjusted rate of outpatient use was 1.317 times
greater in 2001 (p=0.007) and 1.216 times greater in 2002 (p=0.032). Compared
to 2000, the adjusted rate of emergency department use was 1.428 times greater in
2001 (p=0.034), 1.693 times greater in 2002 (p=O.OOl). There were no significant differences in inpatient utilization by time period or race. Although African
American and Hispanic outpatient use increased more than Caucasians over time, an initial disparity remained statistically significant, with Caucasians being more
likely to use ambulatory care than either race. African Americans increased their ED use over time, but there were no statistically significant disparities in ED use.
Conclusions: CCNC emollee use of ambulatory care increased from year 2000 to
rose, rather than decreasing. Evalnation across more program years is necessary to determine the long-term effect on ED utilization and cost.
Introduction
Asthma is the most common chronic condition of childhood.1 Ranking as
the third most common cause of hospitalization for children under fifteen,2 asthma was responsible for over 650,000 pediatric emergency room visits in 1999.3 The prevalence of pediatric asthma is higher among minorities and low-income
individuals;4 specifically, the Medicaid population is more likely to have an
emergency department visit or hospitalization for asthma than those with private insurance5 (See Addendum A)
Numerous studies have documented that there is a disproportionate burden
of asthma among racial/ethnic minorities6.7·8 Within the Medicaid population, African American children with asthma are more likely than Caucasians to visit
the emergency department or be hospitalized for asthma9 A recent study among children with asthma enrolled in a state Medicaid PCCM or fee-for service
program found that black children were 75% more likely and Hispanic children were 56% more likely than white children to have had 2:1 asthma ED visits per
year, after controlling for case mix, provider type, disability status, age and
gender.10
In an attempt to improve patient quality oflife while decreasing high-cost
utilization of the emergency department and hospital, insurance companies and state Medicaid programs began to embrace case management as a possible
patients and then implements individualized care plans, appears to work, at least
for asthma-related quality of life; several randomized controlled trials have
determined that case management has decreased asthma symptom days, improved lung function and decreased school absenteeism.12•13•14 Evidence regarding case management and service utilization, however, is less conclusive. (See Addendum
B)
Case management also seems effective for low-income children with
asthma. A randomized, controlled, multi-site trial evaluated a family-focused asthma intervention, which included family and PCP education, as well as regular case worker follow-up. This intervention, designed for inner-city children 5 to II
years old with moderate to severe asthma, living in inner-city census tracts where
at least 20% of the population was below the federal poverty level, resulted in fewer symptom days than control.15 A controlled trial of asthmatic children
enrolled in Medicaid found that participation in a comprehensive asthma
intervention including education and case workers resulted in decreased ED and
hospital visits, as well as decreased health care charges.16 Also, preliminary data
from the Harlem Children's Zone Asthma Initiative (HCZAI), which manages children twelve and younger with asthma through home visits by a pediatric team,
supports case management; children enrolled in the intervention had fewer missed school days and ED visits.17
Community Care of North Carolina (CCNC), a community-based care management program, was created in 1998 by the North Carolina Division of
existing primary care case management system, Carolina ACCESS. CCNC
emphasizes case management, with networks of local providers working
collaboratively to coordinate patient care. As of December 2002, there were 12
networks covering over 250,000 Medicare beneficiaries. At present, CCNC is specifically targeting individuals with high levels of health expenditures (such as
those that exhibit high emergency department utilization rates) or those with chronic conditions that can lead to high costs. The methods employed to improve
care quality and reduce costs for these patients include PCP-centered care and increased preventive services. Case managers also identify and help to resolve barriers to appropriate service use for individual patients. (See Addendum C)
Asthma is one high-cost chronic condition that CCNC has been targeting. A study examining the four systems of North Carolina Medicaid delivery
(Carolina ACCESS, CCNC, HMOs and fee-for-service) in the treatment of persistent pediatric asthma from 1998 to 1999 reported that 67% of enrollees in CCNC were receiving appropriate long-term control asthma medications,
compared with 58% in Carolina ACCESS, 53% in fee-for-service and 53% in the
HMOs. These significant differences suggested that pediatric enrollees in CCNC were more like! y to have proper asthma treatment than other groups. 18
In a state-wide evaluation ofCCNC from January 2000 to December
2002, children with asthma had lower total health care costs per member per month (pmpm) than those enrolled in Carolina ACCESS during the same time
emergency department visits and 21% fewer per-emollee astlnna-related inpatient
hospitalizations in 2002. Average number of emergency department visits per 1,000 children with asthma emolled in CCNC also decreased during this time
period, with 843 such visits in 2000, 808 visits in 2001 and 679 visits in 2002. Decreases were also seen in the average number of inpatient admissions per 1,000 pediatric astlnnatic enrollees; there were 158 visits per 1,000 enrollees in 2000,
decreasing to 128 in 2001 and 97 in 2002. However, it is important to note that
no effort was made to control for astlnna severity in the above study.
The average cost pmpm for children with astlnna varied significantly by geographic location, however, ranging from $152.79 to $402.80 in 2002. Durham
County had an average pmpm cost of $337.64 during 2002, which ranks among the higher pmpm costs for individual counties. 19 Therefore, it is important to
evaluate the program on the county level, to assure that Durham County is having
a similar impact on emergency department and hospital use for pediatric asthmatics to those found statewide.
This study will assess whether: 1) there is an association in Durham between length of time children with astlnna were emolled in CCNC and changes
in patterns of service utilization from 2000 to 2002, and 2) a racial disparity exists
between groups enroiied in CCNC, and CCNC has racial differences in outpatient, emergency department and hospital utilization over time.
HYPOTHESIS: Ideally, under the CCNC plan, with its improved provider
program, with decreases in emergency department and hospital use. Further, racial disparities, if any exist, should decrease or disappear over time among enrollees in CCNC.
Methods
Overview
To test the hypothesis that utilization patterns for the study population would improve over time, changes in utilization were examined over a three-year
time period, from 2000 to 2002, controlling for changes in case mix over that time
period. This three-year time period was chosen to correlate with the earlier
state-wide evaluation performed by the Sheps Center. Since the hypothesis was that improved provider practice, care management, and patient education would lead
to greater use of ambulatory care and decreased inpatient and emergency
department utilization, utilization for these three types of services was examined.
In order to have a clearer understanding of any possible changes in outcome utilization, an overall visit rate ratio, the likelihood of a visit and a visit rate ratio
amongst service utilizers was calculated. Using this combination of outcomes, it
is possible to determine if a change in overall outcome rate is due to a change in the number of individuals using the service (likelihood term), due to a change in
the rate amongst users (user rate) or both. To examine the impact of race on utilization, the outcome of utilization was stratified by race groups. Finally, to
take into account the impact of trends in service utilization that were not specific
county-level trends in ED utilization. County-county-level trends in outpatient and inpatient utilization were not evaluated due to difficulties obtaining all relevant data.
Study methods and design were approved through both the DUMC
Institutional Review Board (Registry# 6656-05-ZROER) and the University of
North Carolina School of Public Health Institutional Review Board (Reference# 05-2477).
Data
Two sources of data were used for this study. The Carolina ACCESS
Emollment database provides descriptive and program history data for all Durham County Medicaid participants emolled in Community Care of North Carolina. This database includes emollee name, date of birth, gender, race, address, phone,
program status, primary care provider facility, personal Medicaid ID number (PID), Social Security number (SSN), emollee status in the program each month
(started the program, continued to be active, left the program), as well as the type of Medicaid program under which the individual was entered. This information is
collected by DSS workers; it is important to note that race/ethnicity information is
based on the workers' impression, and not self-identification. As emollees sign
up or renew Medicaid coverage, their data is stored in the program's eligibility information system and transferred to the state Community Care of North Carolina Office. These data are then forwarded to Duke Community Health
Network and added the Emollment database. There are approximately 41,000
The Carolina ACCESS Encounter database includes all outpatient,
inpatient and emergency department encounters through Duke University Medical
Center (DUM C), Durham Regional Hospital, Lincoln Community Health Center,
and DUMC-associated outpatient clinics for emollees of Community Care of
North Carolina. Lincoln Community Health Center data are not available for all
years, specifically the second half of 2004 and 2005; however the data is complete
for all three years of interest for this study. Also, any outpatient visits outside of
Lincoln Community Health Center and the DUMC system would not be captured
by this data. These missing data are unlikely to be significant, as during this time
period, emollment in CCNC required choosing a PCP through Lincoln or DUMC,
and special permission was required to go elsewhere. Further, most specialty care
for these emollees would likely be provided at either of these two locations. As
DUMC controls all inpatient facilities in Durham County, this database represents
all Durham County inpatient and emergency department use by CCNC emollees.
This database includes emollee PID number, start and end dates of the encounter,
location and CPT codes, primary and secondary ICD-9 codes and provider
information, such as provider name. Initially, Medicaid claims data were to be
used for this analysis; however, the data did not arrive from the Division of
Medical Assistance in time for this evaluation. Therefore, the Carolina ACCESS
Encounter database was used in its stead. Medicaid claims data would have
provided information about encounters that were located outside of Durham
County, as well as information regarding health care charges; this information is
The following variables were included in the analysis: gender, age, race,
number of months active in program, welfare, pregnancy and disability status and provider. Gender was coded as a male/female. Age during year of interest was
calculated from date of birth. Race, which was considered important to answer the hypotheses, was coded as African American, Asian, Caucasian, Hispanic and
Other. As mentioned above, race was based on case worker impression; therefore, there may be some discrepencies, especially between Caucasian and
Hispanic or differences in race determination from year to year. Number of
months active in the program, a necessary control, was calculated from enrollee
status information. As socioeconomic status is a risk factor for an asthma
diagnosis, welfare status was extracted from the type of Medicaid program under which enrollees entered the program. As pregnancy and disability status may
affect service utilization, this information was also extracted from the type of Medicaid program the under which enrollees entered CCNC. Welfare, pregnancy
and disability status were coded as yes/no variables.
Subject Selection
Subjects were identified as asthmatic by the North Carolina Division of
Medical Assistance (DMA), who provided a list of all North Carolina Medicaid
enrollees with an asthma diagnosis (ICD9 code 493.xx) in their Medicaid claims from 1998 to 2005. These individuals were linked to the Carolina ACCESS Enrollment database via Medicaid identification number and SSN. Children with
asthma appropriate for inclusion in the study were then identified as all
for 2000, 2001, and 2002. As there were too few individuals emolled during all three years of interest (45 out of the 1615 emollees), a true cohort analysis could not be performed. Instead, each individual was treated as a unique case in each year. Conversely, because the number of individuals emolled during all three years was so small, the analysis did not have to take into account possible
collinearity between outcome values for the same person over multiple years.
Collinearity is a problem that occurs when one set of data is highly correlated to another set of data, such that one set can be predicted by another. However, due to the small numbers of individuals emolled all three years, there was no need to account for the a person's outcome values one year predicting the outcome values for another year.
These year-specific cohorts were then linked via Medicaid identification number to the Carolina ACCESS Encounter database. This allowed the creation
of a new dataset, which included all children with asthma emolled in CCNC for
the year of interest, demographic information including age, race and gender, PCP, pregnancy, disability and welfare status, number of emergency department, hospital and outpatient visits, and the number of months each emollee was active in the program.
Data Analysis
Univariate, bivariate and multivariate analyses were performed using the program STAT A. A p-value less than 0.05 was considered significant. Based on the univariate analysis, some recoding was done (e.g., collapsing the racial
variable type (categorical versus continuous) and number of variable categories.
Bivariate analysis was used to test for collinearity among the independent
variables and potential controls (none was detected) and to determine which
variables should be included as controls in the multivariate analyses. Poisson
regressions with controls were then performed to determine the effect of program
year on the volume of emergency department, outpatient and inpatient utilization,
with the log of active months as the offset and robust standard error calculations.
This allowed for calculation of incidence rate ratios controlled for the number of
people enrolled in the program and the number of active months in the program.
These outcomes were also evaluated on a yes/no basis to determine the number of
enrollees utilizing the services. Logistic regressions were performed to analyze
the effect of program year on this outcome. Subjects were determined to be
"users" for each outcomes if they had any emergency department, outpatient or
inpatient visits, respectively. A subject level "user-rate" for each outcome per
year was then created, consisting of the number of visits per user divided by the
number of active months the subject was in the program. In other words, this user-rate included only those individuals with at least one outcome visit. Poisson
regressions were then performed to determine the effect of program year on the
user-rate of emergency department, outpatient and inpatient utilization, with the
log of active months as the offset and robust standard error calculations. This
allowed for calculation of "user" incidence rate ratios controlled for the number of
Each regression was also performed stratified by race, to determine if there were any racial differences in outcome utilization over time.
County-level yearly emergency department utilization rates were
determined by calculating the ratio of the number of billed emergency department visits in Durham County to the year-specific county population. Billed
emergency department visits were obtained through DUMC and Durham Regional Hospital encounter data, and yearly county population data were
obtained from North Carolina State Center for Health Statistics20
Results
Sample Description and Bivariate Analysis
Using the eligibility criteria outlined above, 429 eligible enrollees were
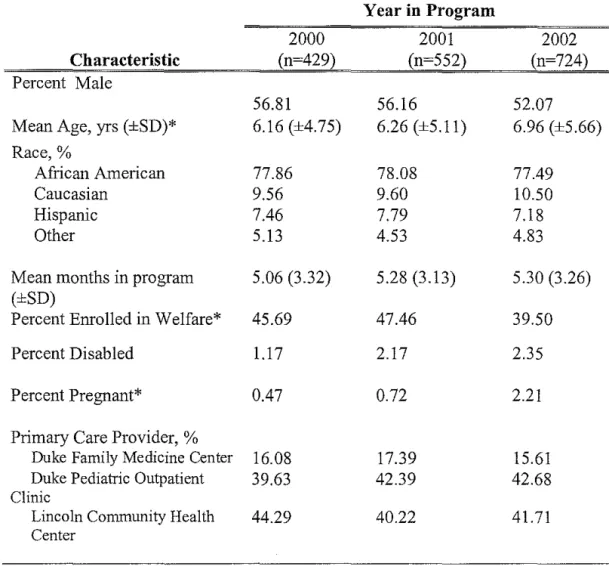
identified for the year 2000, 552 enrollees for the year 2001 and 724 enrollees for the year 2002. Participant demographic characteristics for each program year are provided in Table I. Bivariate regression showed the differences in age
distribution, percent pregnant, and percent on welfare across the three years to be
statistically significant (p<0.05). Mean months active in the program were similar across program years.
Three types of health services utilization outcomes were assessed:
outpatient, emergency department and hospitalization. For each of these types of health service, mean visits per enrollee, percentage of enrollees with one or more
such visits during the year, and mean visits per active months among those
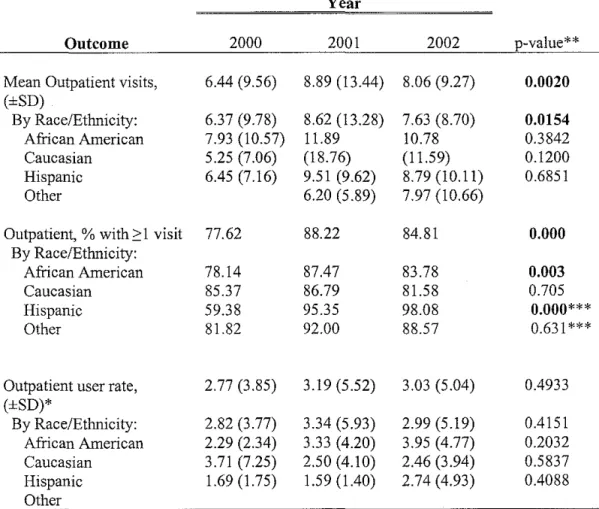
Mean outpatient visits increased from 6.44 in 2000 to 8.89 in 2001, with a slight decrease to 8.06 visits in 2002 (Table 2). This upward trend was significant (p=0.0021 ). The percentage of participants with one or more outpatient visits
increased from 77.62% in 2000 to 88.22% in 2001, with 84.81% in 2002. This upward trend was also significant (p=O.OOO). Among participants with one or more outpatient visits, there was no significant difference in visits per active months among program years.
Trends in outpatient visits differed amongst races. Like the enrollees overall, African Americans showed an increased trend in mean outpatient visits (p=0.0154), and in percentage of enrollees using ambulatory services (p=0.003), but no difference in user outpatient rate, suggesting an increase in use due to
increased number of enrollees utilizing outpatient services. Hispanics showed an increased trend in the percentage of individuals having any outpatient visit (p=O.OOO), but no change in mean outpatient visits or outpatient user rate. Caucasians and those categorized as Other did not show a change in outpatient
utilization over time.
Mean emergency department visits increased from 0.23 in 2000 to 0.34 in 2001 and 0.44 in 2002 (Table 3). This upward trend was significant (p=0.0005). Also, the percentage of participants with one or more emergency department visits increased from 15.85% in 2000 to 20.83% in 2001 and 23.07% in 2002.
This upward trend was significant (p=0.013). However, among participants with one or more emergency department visits, there was no significant difference in
Trends in emergency department utilization differed amongst races. African Americans showed an increased trend in mean number of ED visits (p=0.006) in percentage of enrollees using ED services (p=0.012), but no
difference in user ED rate, suggesting an increase in use due to increased number of enrollees utilizing ED services. Caucasians showed an increased trend in percentage of enrollees using ED services (p=O.Ol 0). Hispanics showed an increased trend in user ED rate (p=0.0424). Those categorized as Other had no
change in emergency department utilization.
Average number of emergency department visits for all Durham County
was also calculated, and the rates of increase compared with those of the Durham County pediatric asthmatics enrolled in CCNC (Table 4). Emergency department
utilization for Durham County increased 9.05% from 2000 to 2002, while
Durham County pediatric asthmatics enrolled in CCNC increased their emergency
department utilization by 96.0%.
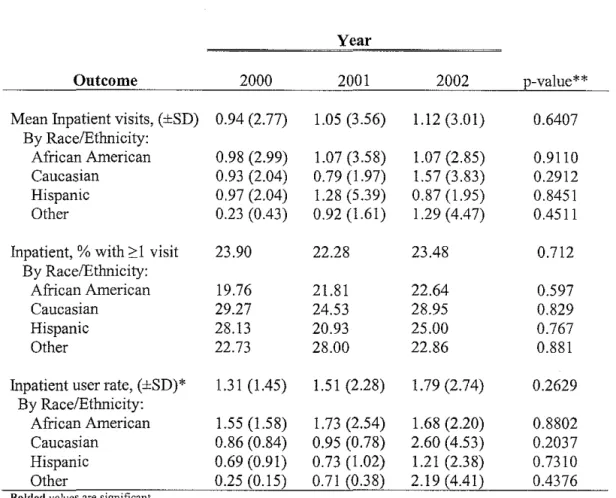
There were no significant differences in mean inpatient visits, percentage of participants with one or more inpatient visits, or inpatient visits per active .
months among participants with one or more inpatient visits across program years, either for the group as a whole or specific racial/ethnic category (Table 5).
Mean outcomes for each year were evaluated by race (Tables 6 through 8).
Mean outpatient use did not vary significantly between racial categories in years
visits (Table 6). Mean emergency department and inpatient utilization did not vary significantly between racial categories in ail program years (Tables 7 and 8).
Coiiinearity between program year and control variables was tested. None of the variables were found to be highly correlated to each other. Age, race,
pregnancy and welfare status were significantly related to the outcomes as weii as to program year, and were therefore controiied for in the multivariate analyses. Gender was not correlated to the program years, but was correlated to the outcomes; since there were sufficient degrees of freedom, it was included in the
multivariate analysis. The number of active months in the program was also included in the analyses as an offset.
Multivariate Analyses
Outpatient Utilization
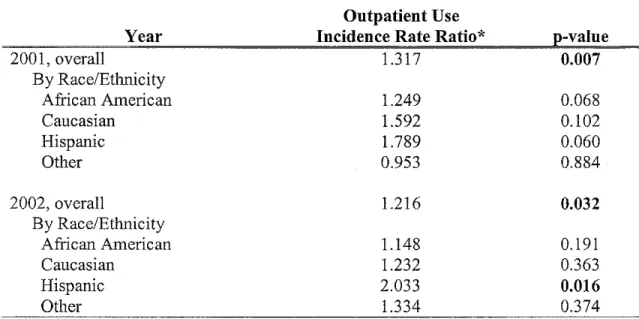
Outpatient utilization is presented in Tables 9 through I 1 and discussed
below.
The multivariate analysis confirmed that the overaii volume of outpatient utilization increased from 2000. The rate of outpatient use was 1.317 times greater in the year 2001 than in 2000 (p=0.007) and 1.216 times greater in the year 2002 than in 2000 (p=0.032) when adjusted for age, gender, race, pregnancy and
welfare status, and controiied for person-months (Table 9). The chance of having an outpatient visit increased from the year 2000, suggesting an increase in the
number of participants using ambulatory services. Overaii, when adjusted for other variables, participants were 2.386 times more likely to have an outpatient
compared with 2000 (Table 1 0). Among those with one or more outpatient visit, there was no difference in outpatient use from 2000 to 2001 or 2002, suggesting that the rate of outpatient use did not change among those utilizing ambulatory services (Table 11 ). Therefore, the overall increase rate of outpatient utilization is due to an increased number of enrollees accessing ambulatory care and not an
increased rate amongst users.
There were some differences in outpatient utilization among racial groups.
African Americans were 2.125 times more likely to have an outpatient visit in 2001 (p=O.OOO) and 1.769 times more likely to have an outpatient visit in 2002 (p=0.002) when compared with the year 2000. African Americans did not have
an overall increased rate of outpatient use compared with 2000; however this value was near significance in 2001.
Hispanics showed an increased rate of outpatient utilization; in 2002, the rate of use for Hispanic patients was 2.033 times greater than in the year 2000
(p=0.016). This overall increase in rate seems due to increased numbers of
Hispanics accessing ambulatory care. Hispanics were especially more likely to have an outpatient visit in the years 2001 and 2002 when compared with 2000; Hispanics were 23.935 times more likely to have an outpatient visit in 2001 (p=0.001) and 40.859 times more likely to have an outpatient visit in 2002
(p=0.001). Caucasians did not have an increased overall rate of outpatient use, although amongst users the increased rate of outpatient use nears significance in year 2001 when compared to 2000.
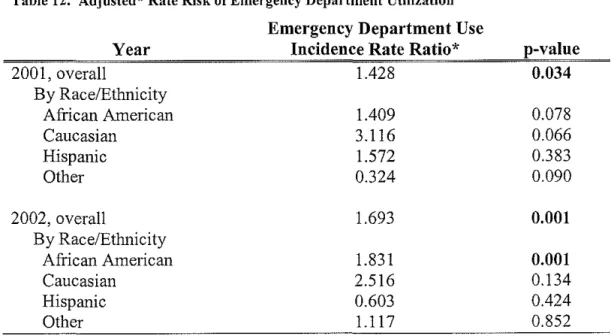
Key findings from the multivariate analysis of emergency department
utilization are presented in Tables 12 through 14.
The multivariate analysis confirmed that overall emergency department use increased from year 2000. The rate of emergency department use was 1.428 times greater in 2001 than in 2000 (p=0.034) and 1.693 times greater in 2002 than in 2000 (p=0.001) when adjusted for age, gender, race, pregnancy and welfare
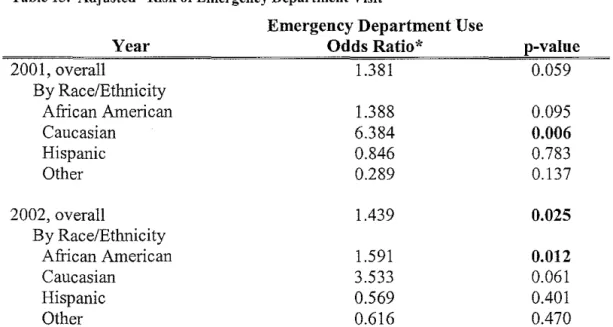
status, and controlled for person-months (Table 12). There was no significant difference in the risk of having an emergency department visit from year 2000 to year 2001. However, participants in year 2002 were 1.439 times more likely to
have an emergency department visit than participants in year 2000 (p=0.025) when adjusted for other variables (Table 13). Among those who have one or
more emergency department visits, there is no significant change in the rate of emergency department use for service users from year 2000 to year 2001 in the population as a whole. However, there is a 1.343 increase in the rate of
emergency department use for this group from year 2000 to year 2002 (p=0.026)
when adjusted for other variables (Table 14). Therefore, the overall increase in emergency department utilization appears to be due to an increase in the number of service users as well as an increased rate of use among those with one or more
emergency department visits.
The overall rate of emergency department use for African Americans was
1.831 times greater in 2002 than in 2000 (p=0.001 ). African Americans are 1.591 times more likely to have an emergency department visit in year 2002 than in year
amongst users compared to 2000, although this value is very near significance in
2002. Therefore, it appears that this increased rate of ED use amongst African
Americans is likely due to a combination of increased numbers of participants
using the ED, as well as increased utilization rate among users.
Caucasians do not have a higher rate of ED use compared to 2000;
however, this rate nears significance in 2001. Caucasians were 6.384 times more
likely to have an emergency department visit in 2001 than in year 2000 (p=0.006)
when adjusted for other variables; however, this increased risk does not continue
to year 2002. Therefore, any increase in ED rate amongst Caucasians were due to
increased number of individuals using the ED.
Although among Hispanics, there is no change in ED rate compared to
2000, among Hispanics with one or more emergency department visit, the rate of
emergency department use is 2.857 times greater in year 2001 than year 2000
(p=O.OOl) when adjusted for other variables. This difference does not continue to
year 2002.
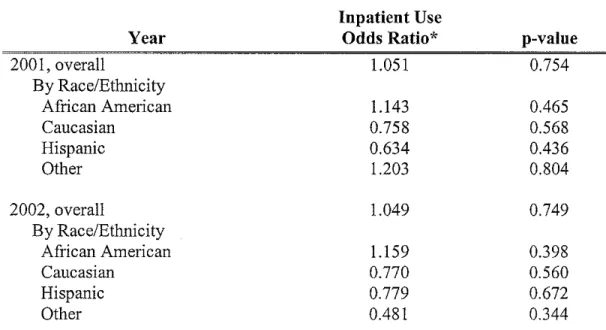
Inpatient Utilization
Inpatient utilization is presented in Tables 15 through 17 and discussed
below.
The multivariate analysis confirmed that there is no difference in inpatient
utilization, either in the rate of use or in the risk of an inpatient visit, from year
2000. However, participants categorized as other in their race/ethnicity have an
inpatient utilization rate 4.321 times greater in year 2002 compared to 2000
one or more inpatient visits also have an inpatient utilization rate 8.926 times
greater in 2001 (p=0.004) and 17.782 times greater in 2002 (p=O.OOO) when
compared with the year 2000. This suggests that this race category has an
increase in the inpatient rate of utilization among those who use the hospital, but
that there is no difference in the number of individuals using inpatient services.
Service Utilization Among Races Compared to Caucasians
In order to evaluate a possible racial disparity, adjusted incidence rate
ratios ofthe outcomes for each program year of interest compared to the
Caucasian population are provided in Table 18.
Some significant disparities can be seen for outpatient utilization.
Although not significant for all racial categories, minorities have a decreased rate
of outpatient utilization compared to Caucasians in year 2000. Although there is
not a significantly decreased rate of outpatient utilization among African
Americans compared to Caucasians in 2000, the gap between the races become
significant in years 2001 and 2002. This rate ratio decreases throughout this time
period, suggesting an increasing gap in service utilization. Hispanics have a
significantly lower rate of outpatient utilization than Caucasians for all years of
interest; however, these rate ratios are increasing throughout this time period,
suggesting a decreasing gap in service utilization. Others only have a
significantly lower rate during 2001; no pattern in service utilization compared
with Caucasians can be discerned.
There is no difference between ED utilization rates between African
initially have a non-significant increased rate in ED use, have a lower rate of ED use than Caucasians in 2002, suggesting an overall decrease in ED use for Hispanics when compared to Caucasians. Others have a lower rate in 2001, but again, no pattern is discernable in ED utilization when compared to Caucasians. No initial disparity is noted in year 2000 among any racial group.
No differences are present throughout the years in inpatient utilization,
with the exception of Others, who have a lower rate of inpatient utilization during
the year 2000.
Discussion
This study set out to answer two overarching questions: 1) has health services utilization for pediatric asthmatics in CCNC changed over time? 2) are
there racial disparities in health services utilization for this group, and has this changed over time? Over time, it had been expected that changes would occur in emergency department, hospital and outpatient utilization. Ideally, expected improved provider practice, care management, and patient education would have
lead to greater use of ambulatory care and decreased ED and inpatient utilization;
however, the data only partially conform to these expected changes.
Overall outpatient utilization, as expected, has increased significantly from 2000, due to increased numbers of enrollees using ambulatory care. Part of this increase can be explained by the fact that enrollment in CCNC requires the
identification of a primary care physician. This identification process may encourage participants to seek regular care. Further, care managers and
regular and continuous physician care, especially in the treatment of chronic conditions such as asthma.
Overall, however, the rate of emergency department utilization has also increased significantly from 2000, in part due to increased number of participants using the emergency department and an increased rate of emergency department use among those with one or more ED visit. Although the ED rate in Durham
County is also increasing during the time period of interest, it clearly does not
explain the extent of increase among the CCNC pediatric asthmatics. Children with asthma may be more likely than the remaining population to visit the emergency department; however, this fact alone cannot explain why the rate of increase in emergency department use would be ten-fold greater for this
population. This increased rate cannot be explained by referral of more severe cases of asthma into CCNC, since the majority of children with Medicaid in Durham County are emolled in CCNC. The most likely explanation is that
increased ambulatory care has not yet translated into lower emergency department
use. In other words, it is possible that the increase in outpatient utilization seen
from 2000, which is hopefully leading to improved asthma treatment, will not lead to a decrease in emergency department use immediately. Families and caretakers may need time to assimilate new education and care plans before they begin behavioral change. However, this still does not explain that the rate of ED
use is actually increasing for this time period. There is also the possibility that the
outpatient management. It is difficult to judge this without a comparison of ED use among non-CCNC children with asthma during this same time period.
Inpatient utilization did not change over the time period of interest. This
is paradoxical in light of the increase in emergency department use. If the
children using the ED had severe asthma attacks that warranted hospital care, one
would expect the inpatient utilization to also increase. So, the increased ED use
with non-concurrent increase in hospitalization could be due to non-severe
emergent cases or patients seeking to use the ED for urgent, outpatient care. In
other words, it is possible that participants were seeking care for mild asthma that
should have been adequately controlled through proper outpatient care. However,
it may also be that the ED has become extremely effective at dealing with severe
asthmatic episodes. Also, there is the possibility that the emphasis of the program
on getting care is pushing people to get care, but these services may not be
adequately managed through the PCP. Again, it also may be that the increase in
outpatient utilization has not yet led to increased long-term asthma control.
It had also been expected that if a racial disparity existed for any of these
outcomes, ideally under the CCNC plan, it would decrease or disappear. Initially,
there were few disparities amongst the racial groups. Hispanics had a lower rate
of outpatient use in the year 2000 than Caucasians; although this difference
decreased throughout the time period of interest, it was still significant in year
2002. Although Hispanics and African Americans have increased rates of
outpatient utilization from 2000, while Caucasian outpatient utilization remains
Hispanics, as expected, have a decrease in the overall disparity, African Americans seem to experience an increasing disparity over time. This may be partly due to a change in case mix, or due to the fact that increased rate in outpatient utilization among African Americans reaches significance, in part,
because of a larger sample size.
Unlike previous studies, this study showed a lack of disparity amongst
racial groups for ED utilization. If anything, some minority groups, specific Hispanics and Others, were less likely to visit the ED than Caucasian participants. However, this data must be examined with the caveat that case workers made the
race identification, not the enrollees themselves. Either way, although some of the racial groups showed significant changes in ED utilization over time, none of these changes led to an increased rate of use when compared with Caucasians. This is an especially favorable outcome from a program perspective, as there have
been racial disparities in ED use in Medicaid programs in the past. It is possible that care managers, aware of the documented disparities seen between these racial groups and Caucasians, were particularly attentive to encouraging minorities to reduce ED use and increase outpatient utilization. Also, it is possible that bilingual care managers or interpreters were in greater supply during later years.
Inpatient use remains stable for all racial groups except those categorized as Others. It appears that there is an increased rate of inpatient use among Others those with one or more inpatient visit, suggesting that these individuals are
suffering from severe asthma or a concurrent illness. However, this increased rate
This study is limited by the inability to measure and control for asthma
severity. It is possible that patients had more severe disease in later program years, contributing to the increase in emergency department use. However, it is
unlikely that controlling for severity would completely eliminate the striking
increase in emergency department use from 2000 to 2002. In addition, further
study encompassing more program years is warranted; it is possible that
emergency department and hospital utilization decrease later. Further, this study
could not control for seasonal variations in service utilization; one would expect
that in the care of a respiratory disease such as asthma, season has an important
role in disease exacerbation. It is also possible some of the racial differences
result from shifting populations or changes in case worker race identification.
Also, it is possible that some encounters were missed if patients used
out-of-county-facilities. It is unlikely that enrollees were using primary care services
out of Durham County, since patients require special permission to obtain a PCP
that is out of the CCNC network, but patients could have used specialty care
outside the county or outside of the Duke/Durham Regional and Lincoln systems.
Enrollees could have used hospital services in a neighboring county, but unless a
majority of the patients were engaging services elsewhere, it would not have
greatly altered the results. Finally, there is always the possibility of data entry
error. Less data entry error would be likely in the Medicaid claims data. Also,
any out-of-county service use could have been tracked and added to the
Some implications of this paper are discernible. As mentioned above,
further research is necessary; specifically, similar analyses extended to further
program years and Medicaid claims data would provide a better understanding of
program outcomes. Ideally, a concurrent control group of Carolina ACCESS
participants would have provided more information as to the effectiveness of the
program. Further, claim information could have provided information on any
cost-saving benefit of the program. Other outcomes, such as school absenteeism,
lung function, symptom-free days or patient satisfaction could also be evaluated.
From a program standpoint, CCNC may be succeeding in its goal of
increasing patient ambulatory care utilization. However, more needs to be done
to decrease the emergency department use among enrollees. This increase in ED
utilization may be due to the fact that Durham County, unlike some of the other
counties hires only lay-persons to work as care-managers. It is possible that these
care-managers, unlike social workers and nurses hired by other counties, do not
have the medical training necessary accurately determine which children need
intervention or to education patients. It is also possible that program goals and initiatives are not being strongly emphasized to CCNC providers, or, providers,
without routine evaluations, are not committing to the asthma disease initiatives
provided by the state. Improved family understanding of asthma and a desire to be
more participatory in disease control may have decreased caretakers' tolerance
regarding asthma symptoms, driving patients to the ED at the earliest signs and
symptoms of an attack. Also, it is possible that the PCPs cannot handle the
emergency department. Increased emphasis on program initiatives, and increased
care-manager disease training would likely help with these problems; however,
without a more thorough evaluation it is not known if such measures are
necessary.
Regardless, the overall trend looks good for enrollee ambulatory care.
However, it is unconfirmed whether this increased ambulatory care is improving
outcomes or saving money. Further study with Medicaid claims data will provide
a more thorough and accurate account of these findings. The next step will be to
test for the continuation of this upward emergency department trend, and either to
confirm a later drop in emergency department utilization, or to find ways of
revamping the program, with the fundamental goal of converting this increased
enrollee access to ambulatory care into improved patient outcomes. Qualitative
analyses on physician practices, as well as patient quality-of-life and health
Tables and Figures
Table 1. Participant Characteristics
Year in Program
2000 2001 2002
Characteristic (n=429) (n=552) (n=724)
Percent Male
56.81 56.16 52.07
Mean Age, yrs (±SD)* 6.16 (±4.75) 6.26 (±5.11) 6.96 (±5.66)
Race,%
African American 77.86 78.08 77.49
Caucasian 9.56 9.60 10.50
Hispanic 7.46 7.79 7.18
Other 5.13 4.53 4.83
Mean months in program 5.06 (3.32) 5.28 (3.13) 5.30 (3.26)
(±SD)
Percent Enrolled in Welfare* 45.69 47.46 39.50
Percent Disabled 1.17 2.17 2.35
Percent Pregnant* 0.47 0.72 2.21
Primary Care Provider, %
Duke Family Medicine Center 16.08 17.39 15.61
Duke Pediatric Outpatient 39.63 42.39 42.68
Clinic
Lincoln Community Health 44.29 40.22 41.71
Center
Table 2. Outpatient Utilization, by Year
Year
Outcome 2000 2001 2002 p-value**
Mean Outpatient visits, 6.44 (9.56) 8.89 (13.44) 8.06 (9.27) 0.0020
(±SD)
By Race/Ethnicity: 6.37 (9.78) 8.62 (13.28) 7.63 (8.70) 0.0154
African American 7.93 (10.57) 11.89 10.78 0.3842
Caucasian 5.25 (7.06) (18.76) (11.59) 0.1200
Hispanic 6.45 (7.16) 9.51 (9.62) 8.79 (10.11) 0.6851
Other 6.20 (5.89) 7.97 (10.66)
Outpatient, % with 2:1 visit 77.62 88.22 84.81 0.000
By Race/Ethnicity:
African American 78.14 87.47 83.78 0.003
Caucasian 85.37 86.79 81.58 0.705
Hispanic 59.38 95.35 98.08 0.000***
Other 81.82 92.00 88.57 0.631 ***
Outpatient user rate, 2.77 (3.85) 3.19 (5.52) 3.03 (5.04) 0.4933
(±SD)*
By Race/Ethnicity: 2.82 (3.77) 3.34 (5.93) 2.99 (5.19) 0.4151
African American 2.29 (2.34) 3.33 (4.20) 3.95 (4.77) 0.2032
Caucasian 3.71 (7.25) 2.50 (4.10) 2.46 (3.94) 0.5837
Hispanic 1.69 (1.75) 1.59 (1.40) 2.74 (4.93) 0.4088
Other
Bolded values are significant
*Mean rate per active months among participants with ?::1 Outpatient visit
**Analyses over time: Mean Outpatient visit & Mean user Outpatient rate analyses: one-way AN OVA;% with Outpatient visit analyses: chi squared
Table 3. Emergency Department Utilization, by Year
Year
Outcome 2000 2001 2002 p-value**
Mean ED visits, (±SD) 0.23 (0.60) 0.34 (0.86) 0.44 (1.10) 0.0005
By Race/Ethnicity:
African American 0.22 (0.58) 0.32 (0.82) 0.46 (1.14) 0.0006
Caucasian 0.17 (0.63) 0.60 (1.13) 0.49 (1.14) 0.1235
Hispanic 0.25 (0.51) 0.40 (0.98) 0.19 (0.56) 0.3850
Other 0.45 (0.91) 0.12 (0.33) 0.51 (1.04) 0.1897
ED, % with 2:1 visit 15.85 20.83 23.07 0.013
By Race/Ethnicity:
African American 15.27 19.95 23.53 0.012
Caucasian 7.32 33.96 25.00 0.010
Hispanic 21.88 18.60 13.46 0.590
Other 31.82 12.00 25.71 0.283***
ED user rate, (±SD)* 0.36 (0.33) 0.52 (0.66) 0.54 (0.59) 0.0820
By Race/Ethnicity:
African American 0.40 (0.35) 0.50 (0.67) 0.58 (0.63) 0.1952
Caucasian 0.50 (0.43) 0.56 (0.68) 0.38 (0.27) 0.5771
Hispanic 0.17 (0.09) 0.79 (0.66) 0.40 (0.34) 0.0424
Other 0.22 (0.13) 0.19 (0.06) 0.54 (0.70) 0.3805
Bolded values are significant
*Mean rate per active months among participants with ::::r ED visit
**Analyses over time: Mean ED visit & Mean user ED rate analyses: one-way AN OVA;% with ED visit analyses: chi squared
***Fisher's Exact
Table 4. ED Rates oflncrease for CCNC and Durham County, by Year
Population
Durham County CCNC Pediatric Asthmatics
All Durham County
Rate of Increase from 2000
2001 2002
29.6% 96.0%
Table 5. Inpatient Utilization, by Year
Year
Outcome 2000 2001 2002 p-value**
Mean Inpatient visits, (±SD) 0.94 (2.77) 1.05 (3.56) 1.12 (3.01) 0.6407
By Race/Ethnicity:
African American 0.98 (2.99) 1.07 (3.58) 1.07 (2.85) 0.9110
Caucasian 0.93 (2.04) 0.79 (1.97) 1.57 (3.83) 0.2912
Hispanic 0.97 (2.04) 1.28 (5.39) 0.87 (1.95) 0.8451
Other 0.23 (0.43) 0.92 (1.61) 1.29 (4.47) 0.4511
Inpatient, %with ::>1 visit 23.90 22.28 23.48 0.712
By Race/Ethnicity:
African American 19.76 21.81 22.64 0.597
Caucasian 29.27 24.53 28.95 0.829
Hispanic 28.13 20.93 25.00 0.767
Other 22.73 28.00 22.86 0.881
Inpatient user rate, (±SD)* 1.31 (1.45) 1.51 (2.28) 1.79 (2.74) 0.2629
By Race/Ethnicity:
African American 1.55 (1.58) 1.73 (2.54) 1.68 (2.20) 0.8802
Caucasian 0.86 (0.84) 0.95 (0.78) 2.60 (4.53) 0.2037
Hispanic 0.69 (0.91) 0.73 (1.02) 1.21 (2.38) 0.7310
Other 0.25 (0.15) 0.71 (0.38) 2.19 (4.41) 0.4376
Bolded values are significant
*Mean rate per active months among participants with~ 1 Inpatient visit
Table 6. Mean Outpatient Use, by Race and Year
Year African
American
2000 6.37
2001 8.62
2002 7.63
Bolded values are significant
*One-way ANOV A across races
Mean Outpatient Use, by Race
Caucasian Hispanic
7.93 5.25
11.89 9.51
10.78 8.79
Table 7. Mean ED Use, by Race and Year
Year African
American
2000 0.22
2001 0.32
2002 0.46
Bolded values are significant
*One-way ANOV A across races
Mean ED Use, by Race
Caucasian Hispanic
0.17 0.25
0.60 0.40
0.49 0.19
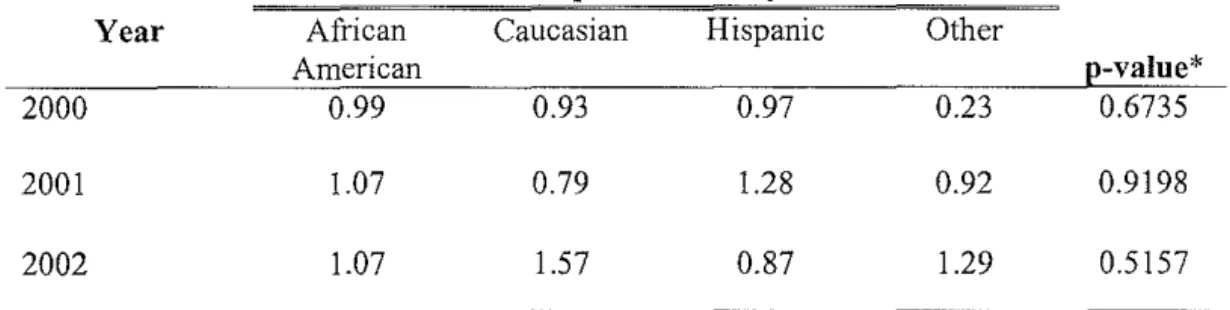
Table 8. Mean Inpatient Use, by Race and Year
Year African
American
2000 0.99
2001 1.07
2002 1.07
Bolded values are significant *One-way ANOV A across races
Mean Inpatient Use, by Race
Caucasian Hispanic
0.93 0.97
0.79 1.28
1.57 0.87
Other
e-value*
6.45 0.6822
6.20 0.2725
7.97 0.0446
Other
e-value*
0.45 0.3003
0.12 0.705
0.51 0.3886
Other
e-value*
0.23 0.6735
0.92 0.9198
Table 9. Adjusted* Rate Risk of Outpatient Utilization
Outpatient Use
Year Incidence Rate Ratio* p-value
2001, overall 1.317 0.007
By Race/Ethnicity
African American 1.249 0.068
Caucasian 1.592 0.102
Hispanic 1.789 0.060
Other 0.953 0.884
2002, overall 1.216 0.032
By Race/Ethnicity
African American 1.148 0.191
Caucasian 1.232 0.363
Hispanic 2.033 0.016
Other 1.334 0.374
Bolded values are significant
*Poisson Regression; Reference year 2000, adjusted for age, gender, race, pregnancy and welfare status, offset by log of active months
Table 10. Adjusted* Risk of Outpatient Visit
Outpatient Use
Year Odds Ratio* p-value
2001, overall 2.386 0.000
By Race/Ethnicity
African American 2.125 0.000
Caucasian 1.174 0.794
Hispanic 23.935 0.001
Other 2.233 0.406
2002, overall 1.439 0.025
By Race/Ethnicity
African American 1.769 0.002
Caucasian 0.748 0.597
Hispanic 40.859 0.001
Other 1.300 0.746
Bolded values are significant
Table 11. Adjusted* Rate Risk of Outpatient Utilization Among Outpatient Users
Outpatient User
Year Incidence Rate Ratio* p-value
2001, overall 1.161 0.138
By Race/Ethnicity
African American 1.127 0.314
Caucasian 1.590 0.082
Hispanic 1.029 0.924
Other 0.846 0.582
2002, overall 1.108 0.245
By Race/Ethnicity
African American 1.062 0.559
Caucasian 1.300 0.208
Hispanic 1.181 0.538
Other 1.287 0.423
Bolded values are significant
*Poisson Regression; Reference year 2000, adjusted for age, gender, race, pregnancy and welfare status, offset by log of active months
[Among those subjects with ?: 1 outpatient visits]
Table 12. Adjusted* Rate Risk of Emergency Department Utilization
Emergency Department Use
Year Incidence Rate Ratio* p-value
2001, overall 1.428 0.034
By Race/Ethnicity
African American 1.409 0.078
Caucasian 3.116 0.066
Hispanic 1.572 0.383
Other 0.324 0.090
2002, overall 1.693 0.001
By Race/Ethnicity
African American 1.831 0.001
Caucasian 2.516 0.134
Hispanic 0.603 0.424
Other 1.117 0.852
Bolded values are significant
Table 13. Adjusted* Risk of Emergency Department Visit
Emergency Department Use
Year Odds Ratio* p-value
200 I, overall 1.381 0.059
By Race/Ethnicity
African American 1.388 0.095
Caucasian 6.384 0.006
Hispanic 0.846 0.783
Other 0.289 0.137
2002, overall 1.439 0.025
By Race/Ethnicity
African American 1.591 0.012
Caucasian 3.533 0.061
Hispanic 0.569 0.401
Other 0.616 0.470
Bolded values are significant
*Logistic Regression; Reference year 2000, adjusted for age, gender, race, pregnancy and welfare status, active months
Table 14. Adjusted* Rate Risk of Emergency Department Utilization Among Emergency Department Users
Emergency Department
Year User p-value
Incidence Rate Ratio*
200 I, overall 1.233 0.106
By Race/Ethnicity
African American 1.141 0.362
Caucasian 1.171 0.628
Hispanic 2.857 0.001
Other 1.313 0.606
2002, overall 1.343 0.026
By Race/Ethnicity
African American 1.348 0.053
Caucasian 1.085 0.799
Hispanic 1.286 0.589
Other 1.567 0.328
Bolded values are significant
Table 15. Adjusted* Rate Risk of Inpatient Utilization
Inpatient Use
Year Incidence Rate Ratio* p-value
2001, overall 1.076 0.719
By Race/Ethnicity
African American 1.031 0.898
Caucasian 0.834 0.702
Hispanic 1.300 0.680
Other 3.492 0.082
2002, overall 1.086 0.719
By Race/Ethnicity
African American 1.013 0.949
Caucasian 1.129 0.771
Hispanic 0.844 0.766
Other 4.321 O.o38
Bolded values are significant
*Poisson Regression; Reference year 2000, adjusted for age, gender, race, pregnancy and welfare status, offset by log of active months
Table 16. Adjusted* Risk oflnpatient Visit
Inpatient Use
Year Odds Ratio* p-value
2001, overall 1.051 0.754
By Race/Ethnicity
African American 1.143 0.465
Caucasian 0.758 0.568
Hispanic 0.634 0.436
Other 1.203 0.804
2002, overall 1.049 0.749
By Race/Ethnicity
African American 1.159 0.398
Caucasian 0.770 0.560
Hispanic 0.779 0.672
Other 0.481 0.344
Bolded values are significant
Table 17. Adjusted* Rate Risk oflnpatient Utilization Among Inpatient Users
Inpatient User
Year Incidence Rate Ratio* p-value
2001, overall 1.108 0.544
By Race/Ethnicity
African American 0.983 0.930
Caucasian 1.353 0.491
Hispanic 2.214 0.252
Other 8.926 0.004
2002, overall 1.064 0.672
By Race/Ethnicity
African American 0.894 0.491
Caucasian 1.849 0.096
Hispanic 1.681 0.193
Other 17.782 0.000
Bolded values are significant
*Poisson Regression; Reference year 2000, adjusted for age, gender, race, pregnancy and weltftre status, offset by log of active months
Table 18. Outcome Utilization Rates by Race Compared to Caucasians, by Year
Utilization Compared to Caucasians
Outpatient Utilization By Race/Ethnicity:
African American Hispanic
Other
Emergency Department Utilization By Race/Ethnicity: African American Hispanic Other Inpatient Utilization By Race/Ethnicity: African American Hispanic Other
Bolded values are significant (p<0.05)
2000 0.761 0.453 0.770 1.271 1.397 1.851 0.981 0.767 0.201 Adjusted* IRR By Year 2001 0.615 0.461 0.490 0.576 0.790 0.173 1.247 0.919 0.953 2002 0.677 0.600 0.715 0.915 0.383 0.636 0.647 0.459 0.536
10
9
f/)
....
8
f/)
>
7
...
0 6
...
Cl>5
.0 E 4 :::1 zt::
3
CISCl>
2
21
0
1
2
Year in Program
Figure 1. Mean Outcome Visits, by Year
3
--+-
Mean Outpatient Visits, -m-Mean Inpatient Visits.
i
Mean ED Visits
Mean outpatient, inpatient and emergency department visits have an overall increasing trend from
year 2000 to year 2002.
ACKNOWLEDGEMENTS
I would like to thauk my mentors Lloyd Michener, M.D., Mina Silberberg, Ph.D. and Bob Komad, Ph.D. for help with my project background and design, as well as their help in preparing this thesis. I would also like to thauk Vic
Hasselblad for help designing my analysis, Jean Rabold for database and Microsoft Access help, as well as the Department of Community and Family Medicine (DUMC) for allowing me access to the database and workspace.
References:
1
National Center for Health Statistics. Asthma fast stats.
http://www.cdc.gov/nchs/fastats/asthma.htm. Accessed March 3, 2005. 2
National Center for Health Statistics. 2002 National Hospital Discharge Survey. http://www.cdc.gov/nchs/data/adlad342.pdf. Accessed March 3, 2005.
3
Mannino DM eta!. Surveillance for asthma-United States, 1980-1999. MMWR. 2002;5l(SS01):1-13.
4
National Center for Health Statistics. Summary health statistics for U.S. children: national health interview survey, 2002. Vital and health statistics. 2004; 1 0(221 ).
5
Ortega AN, Belanger KD, Paltiel D, Horwitz SM, Bracken MB, Leaderer BP. Use of health services by insurance status among children with asthma. Medical Care. 2001;39(10):1065-1074.
6 Akinbami, L, and K. Schoendorf. Trends in Childhood Asthma: Prevalence,
Health Care Utilization and Mortality. Pediatrics. 2002;110:315-322.
7
Elster, A. J. Jarosik, J. VanGeest, and M. Fleming. Racial and Ethnic Disparities in Health Care for Adolescents. Arch Pediatr Adolesc Med. 2003;157:867-874.
8
Lieu, T., P. Lozano, J. Finelstein, F. Chi et. al. Racial/Ethnic Variation in Asthma Status and Management Practice Among Children in Managed Medicaid. Pediatrics. 2002; 109:857-865.
9
Lozano P, Connell FA, Koepsell TD. Use ofhealth services by African American children with asthma on Medicaid. JAMA. 1995;274(6):468-473.
10
Shields, A., C. Comstock and K. Weiss. Variations in Asthma Care by Race/Ethnicity Among Children Enrolled in a State Medicaid Program. Pediatrics. 2004; 113:496-504.
11
McPhillips-Tangum C, Erceg CM. Approaches to asthma management: an assessment of health insurance plans. AHIP Coverage. 2005;Jan/Feb:38-44.
12
13
Greineder DK, Loane KC, Parks P. A randomized controlled trial of a pediatric asthma outreach program. J Allergy Clin Immunol. 1999; I 03(3,Ptl ):436-440. 14
Lozano P, Finkelstein JA, et. al. A multisite randomized trial of the effects of physician education and organizational change in chronic-asthma care: health outcomes of the Pediatric Asthma Care Outcomes Research Team II Study. Arch Pediatr Adolesc Med. 2004;158(9)875-83.
15
Evans R. et al. A randomized clinical trial to reduce asthma morbidity among inner-city children: results of the National Cooperative Inner-City Asthma Study. J Pediatr. 1999;135(3):332-338.
16
Kelly CS et al. Outcomes evaluation of a comprehensive intervention program for asthmatic children enrolled in Medicaid. Pediatrics. 2000; 105(5): 1029-35.
17
Nicholas SW et al. Reducing childhood asthma through community-based service delivery-New York City, 2001-2004. MMWR. 2005;54(01):11-14. 18
Jones-Vessey KA. Using HEDIS measures to evaluate Medicaid managed care organization performance: the treatment of persistent asthma in the pediatric Medicaid population. CHIS Studies. February 2001, No. 124.
19
Ricketts TC, Greene S, Silberman P, Howard HA, Poley S. Evaluation of Community Care of North Carolina asthma and diabetes management initiatives: January 2000-December 2002. The Cecil G. Sheps Center for Health Services Research. April 15, 2004.
20
North Carolina State Center for Health Statistics. North Carolina Vital
ADDENDUM A
Pediatric Asthma: Burden of Suffering Overview
The most common chronic disease of childhood, asthma is responsible for a large percentage of urgent care visits and hospitalizations each year. Asthma
management can be complex, sometimes requiring multiple medications and excellent patient and provider communication. However, mismanaged asthma can be costly, adding to the disease's already high economic and personal burden.
Asthma: Diagnosis, Management and Prognosis
Asthma is characterized by reversible obstruction of large and small
airways in the lungs due to a hyperreactivity to various triggers. Typified by intermittent and recurrent episodes of cough, shortness of breath and wheezing, this chronic disease is classified and treated based on symptom severity (Table 1 ).
Bronchial hyperreactivity, the central feature of asthma, is due to an
allergic inflammatory response to an environmental stimulus. As bronchial inflammation increases, mucosal edema, smooth muscle contraction and mucus
production lead to airway obstruction. This obstruction causes the wheezing attacks and other symptoms of asthma. All young children and infants, with their
smaller airway size, lower elastic recoil, decreased smooth muscle supports, mucous gland hyperplasia and decreased collateral ventilation are at increased risk for airway obstruction. Symptoms of asthma can be initiated by various
Table 1. Asthma Classification and Treatment
Asthma Symptom Severity Severity
Classification
Mild Intermittent • Symptoms 5.2 times a week
• Asymptomatic & Normal PEF between exacerbations • Nighttime symptoms 5.2
times a month
Mild Persistent • Symptoms 2:2 times a week but 5.2 times a day • Exacerbations may affect
activity
• Nighttime symptoms 2: 2 times a month
Moderate Persistent • Daily symptoms
• Daily use of inhaled short-acting beta2-agonists
• Exacerbation affects activities • Nighttime symptoms >I
time a week
Severe Persistent • Continual symptoms • Limited physical activity
• Frequent exacerbations • Frequent nighttime
symptoms
*FEVs forced exp1ratory volume at I second tPEF =peak expiratory flow
Source: Institute for Clinical Systems Improvemene
Lung Long-Term
Function Control Daily Medications
FEY 1* or PEFt No daily medications
2:80% predicted needed
and PEF variability
5.20%
FEV1 orPEF Low dose inhaled
2:80% predicted corticosteroids
andPEF (preferred)
variability 20- OR
30% leukotriene modifiers,
theophylline, nedocromil or cromolyn
FEV1 orPEF Medium or high dose
2:60% - S:80% inhaled corticosteroid predicted and plus inhaled long-acting PEF variability beta2-agonist (preferred)
2:30% OR
Medium dose inhaled corticosteroid plus leukotriene modifier,
theophylline or oral long-acting
beta,-agonist
FEV1 orPEF Medium or high dose
S:60% predicted inhaled corticosteroid
and PEF PLUS long-acting
beta,-variability agonist (preferred)
2:30% AND/OR leukotriene
modifier AND/OR theophylline
objective measures and assessment of asthma monitoring 2) control of factors contributing to asthma severity, 3) pharmacologic therapy, and 4) patient education for a partnership in asthma management.3
Measurement and assessment of asthma monitoring is two-part, including the initial diagnosis and assessment of asthma and the periodic assessment and monitoring of the patient. The initial diagnosis is established when the clinician finds episodic symptoms of partially reversible airflow obstruction, such as
wheezing and shortness of breath and other diagnoses, such as infections,
pulmonary malformations or cystic fibrosis are excluded. Asthma severity, based on symptom severity, nighttime symptoms and lung function, is assessed as either
mild intermittent, mild persistent, moderate persistent or severe persistent (Table I). After the initial diagnosis and assessment are made, periodic monitoring and
reassessment are required to determine effectiveness of asthma therapy. The NLHBI recommends discussing quality of life, asthma signs and symptoms, number and type of asthma exacerbations and medications at these clinic visits.
Such activities are done with the goal of maintaining as near normal lung function as possible while preventing chronic symptoms and exacerbations.
Control of environmental factors, such as cigarette smoke, particulate
matter pollution and allergens can reduce asthma exacerbations. Other
contributing factors include gastroesophageal reflux (GER), rhinitis, sinuisitis and
allergic bronchopulmonary aspergillosis, all of which can trigger severe asthma
severity. Discussion of these factors with the patient, as well as attempts to control or remove them, are important for proper asthma management.
Pharmacotherapy is necessary to reverse and decrease the frequency of
asthmatic symptoms (Table 1 ). Such management is obtained by use of selective betaz-agonists, or bronchodilators, which relax broncholary smooth muscle, as well as increase mucociliary clearance. Short -acting beta2-agonists, such as albuterol, are useful for acute attacks or quick-relieftherapy in chronic asthma.
Long-acting beta2-agonists, such sahneterol, last approximately 12 hours and are useful in treating chronic asthma that is not responsive to other therapy. Chronic asthma (mild persistent, moderate persistent, or severe persistent) also requires
anti-inflammatory medication for prevention of symptoms. These medicines include mast cell degranulation inhibitors ( cromolyn, nedocromil), inhaled
corticosteroids (fluticasone) and oral corticosteroids. Oral corticosteroids have a host of deleterious side effects and are only used for chronic disease if all other therapies fail. Other anti-inflammatory agents include leukotriene antagonists and
lipoxygenase inhibitors, as well as sustained-released preparations of
theophylline, which is a bronchodilator with mild anti-inflammatory effects. As patient understanding and adherence are necessary for proper asthma management, it is important that asthma education and self-management
techniques are stressed from the first visit. Open communication to encourage
compliance, as well as a tailored, written action plan, should be provided to each
The long-term prognosis for asthma is good; however, patients may require emergency treatment or hospitalization for asthma control. Although asthma can be fatal, the majority of patients diagnosed before age five are free of
symptoms by adolescence. Those at increased risk for persistent asthma include those with severe asthma, specific allergies, a family history of asthma, lower respiratory tract infection in infancy and maternal smoking. 1•2.3
Pediatric Asthma Morbidity and Mortality: A Population Perspective Asthma affects over 14.9 million people in the United States; a
disproportionate percentage of those affected are children. According to the National Center for Health Statistics, approximately 8.9 million children have had a diagnosis of asthma and approximately 4.2 million children have had an asthma
attack in the past year, making asthma the most common chronic disease of childhood (Table 2). Further, in 1995 asthma was responsible for 1.5 million emergency department visits, over 500,000 hospitalizations and 5,500 deaths.4 In
1998, asthma management accounted for approximately 12.7 billion dollars in
health care costs5 and has increased to over 14 billion dollars in 20046 The personal and economic burden of asthma is high, especially for children.
Asthma prevalence and sequelae differs among various age groups (Table
2). Over 12% of children (under 18 years old) have had a diagnosis of asthma at some point in their lives, with 5. 7% having an asthma attack in the past 12
months. Children are also more likely than adults to have a hospital stay due to
to note that there are differences among pediatric age groups as well; children aged 0-4 years old, while having a lower prevalence of asthma than all children (7.0%), are responsible for the most asthma hospitalizations, with a rate of 60.3 per 10,0007
Table 2. Asthma Prevalence by Age
Age Range, Lifetime Asthma Asthma Asthma
years Asthma Attack Hospital Mortality
Diagnosis Prevalence, 0/o Discharge
Rate, Prevalence, 0
/o Rate, Per 100,000
Per 10,000
All (0-65+) 10.8 4.2 16.5 1.5
0-17 12.4 5.7 27.5 0.3
0-4 7.7 4.6 60.3 0.2
5-17 14.1 6.1 15.6 0.3
18+ 10.3 3.7 12.7 2.0
Source. Natwnal Center for Health Stat1sttcs
Boys were more likely than girls to have been diagnosed with asthma
(14% versus 10%) and more likely to have had an attack in the past 12 months (7% versus 5%). Other risk factors for a diagnosis of asthma included low
socioeconomic status, belonging to a single-mother family, or being African American. Children who were in poor or fair health were seven times more likely
to have had an asthma attack in the past year than those in good or excellent health8
Pediatric asthma prevalence has changed over time, with an average increase of 4.3% per year from 1980 to 1996, and a peak prevalence of7.5% in
1995. The asthma hospitalization rate increased as well from 1980 to 1999, by 1.4% per year. More concerning, the pediatric asthma death rate increased by
Economic Burden of Asthma
With such a high morbidity, it is not surprising that asthma also has a high economic burden. According to a study by the American Lung Association, direct and indirect costs of adult and pediatric asthma totaled approximately 14
billion dollars in 2004. The majority of this cost was associated with direct costs, such as hospitalization and medications; however, indirect costs, such as missed school days, were one-third of the total expenditure (Figure 1 )6
Figure 1. Economic Costs of Asthma
9%
School Days Lost
10%
Mortality
14%
20%
Inpatient Care 29%
Physician Services 9%
Several studies of pediatric asthma have estimated asthma-related costs. Using the 1987 National Medical Expenditure Survey, Lozano and associates
assessed the per capita impact of pediatric asthma on medical care utilization and