Identifying Interaction Segments between Two Cytoskeletal Proteins via Firth Logistic Regression
By Angela Xue
Senior Honors Thesis UNC Chapel Hill Department of Biostatistics
March 2019
Abstract:
Microtubules (MTs) are cytoskeletal polymers responsible for multiple cytoplasmic activities, such as enabling intracellular transport, stabilizing the cell’s shape, and forming mitotic spindles to separate chromosomes during mitosis. MT-associated proteins (MAPs) localize to the MT where they modulate MT dynamics through molecular and structural changes to the MT. One protein family of MAPs, Protein A, accelerates MT assembly and promotes MT growth. Protein A is consisted of multiple domains that share similar structures. We
hypothesized that the C-terminal domain of Protein A (termed Protein A-1) also contains a region with similar structures of the other known domains. Previous studies have also shown that Protein B, a MT plus end tracking protein, localizes to the MT plus end via its C terminal. Thus, we hypothesized that the N-terminal region of Protein B interacts with Protein A-1. Using Firth logistic regression, we found that the N terminal of Protein B interacts with Protein A-1. Protein B 1-49 is the shortest Protein B construct that interacts with Protein A-1 with similar strength as the N terminal of Protein B.
Introduction:
Microtubules (MTs) are cytoskeletal polymers responsible for multiple cytoplasmic activities, such as enabling intracellular transport, stabilizing the cell’s shape, and forming mitotic
spindles to separate chromosomes during mitosis. The head-to-tail arrangement of αβ-tubulin leads to polarity to the MT. α tubulin is exposed at the slow-growing MT minus end whereas β tubulin
transition between GTP-bound β tubulin and GDP-bound β tubulin in the MT lattice (via polymerization-dependent nucleotide hydrolysis) underlies the ability of MT to be dynamic (Downing and Nogales, 1998).
Methods
Knocksideways Cell Data
This dataset includes five variables and 714 observations. The five variables include Group, Construct, Grade, Interaction_n, and Interaction. The Group variable stands for the cell dish that the data were obtained from for a certain Protein B construct. The Construct variable indicates the specific Protein B construct used in the experiment. The Grade variable is the qualitative graded interaction strength, with “--” as no interaction, “+” as weak interaction, “++” as moderate interaction, and “+++” as strong interaction. The Interaction_n is the categorical variable that indicates the interaction strength. Specifically, Interaction_n is equal to “0” when Grade is “--”, “1” when Grade is “+”, “2” when Grade is “++”, and “3” when Grade is “+++”.
And the Interaction variable is the character variable that specifies the meaning of each Grade.
Statistical Considerations
Both the Construct variable and the Interaction_n variable are categorical variables. Since there are 13 constructs and four different types of interaction strength, the data table followed the s x r table. Since the response variable (Interaction_n) is an ordinal variable, we utilized the mean score test to detect general association between different protein B constructs and their interaction strength with Protein A-1. Qs is the statistic for this test.
Qs = (𝑛−1) ∑ 𝑛𝑖+(𝑓̅−𝜇𝑖 𝑎) 2 𝑠
𝑖=1
𝑛𝑣𝑎 where 𝑓𝑖 = ∑
𝑎𝑗𝑛𝑖𝑗
𝑛𝑖+
𝑟 𝑗=1
phenomenon of separation. Thus, in order to address the separation issue, we used Firth logistic regression to maximize the log-likelihood and enhance the model’s ability to imitate the true data generation process of the dataset. Firth logistic regression adds a new term to the logistic
regression model to offset the infinite growth of the first-order term, which serves to generate a more effective score function (Wang, 2014). As the sample size increases, the extra term converges to zero, assembling the regular logistic regression model (Wang, 2014). We treated the Interaction variable as a binary variable: “strong interaction” and “moderate interaction” were represented as “interaction” while “weak interaction” and “no interaction” were represented as “no interaction”. Odds ratios were the major statistics used to compare different interaction
Results
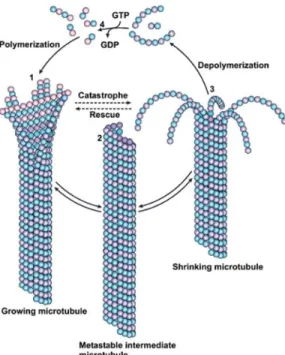
Figure 1. MT Dynamics. Microtubules undergo constant shifts between MT polymerization, depolymerization and pause.
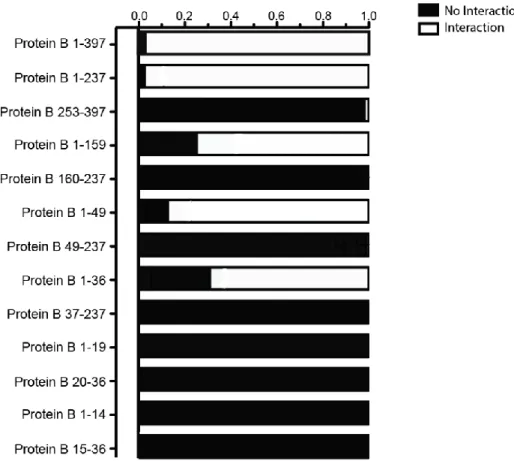
Figure 2 shows the schematic diagram of different constructs of Protein B conceived in this study. Figure 3 suggests that Protein B 1-36 is the shortest construct that seems to have a relatively strong interaction with Protein A-1. Protein B 1-397 interacts with Protein A-1 most strongly.
Table 1. Mean Score Test for the general association between different Protein B constructs and their corresponding interaction strength with Protein A-1.
Alternative Hypothesis
Statistic Qs Value DF Probability
Row Mean Scores Differ
According to Table 1, the test statistic Qs is 595.7 (df = 13). The p-value is < 0.0001. This
means that assuming the null hypothesis is true, the probability of obtaining a sample as extreme as ours is < 0.0001, very unlikely. Thus, we can reject the null hypothesis that the means of each row are all equal, indicating that there is a general association between the different Protein B constructs and different strength of interaction with Protein A-1.
Table 2. Firth Logistic Regression for Interaction Strength Comparison Between Protein B 1-397 and Protein B 1-237.
Construct Comparison (Interaction Strength with Protein A-1)
Odds Ratio Estimate
95% Wald Confidence Limits Protein B 1-397 vs. Protein B 1-237 0.202 (0.010, 4.145)
Table 2 shows that the interaction between Protein B 1-397 and Protein A-1 may be as strong as the interaction between Protein B 1-237 and Protein A-1.
Table 3. Firth Logistic Regression for Interaction Strength Comparison Between the N-Terminal and C-N-Terminal Regions of Protein B with Protein A-1.
Construct Comparison (Interaction Strength with Protein A-1)
Odds Ratio Estimate
95% Wald Confidence Limits Protein B 1-237 vs. Protein B 253-397 < 0.001 (< 0.001, 0.011)
Protein B 1-159 vs. Protein B 160-237 0.003 (<0.001, 0.061) Protein B 1-49 vs. Protein B 49-237 0.004 (<0.001, 0.024) Protein B 1-36 vs. Protein B 37-237 0.005 (<0.001, 0.087)
Table 4. Firth Logistic Regression (Reference Level: Construct Protein B “1-36”). Construct Comparison (Interaction
Strength with Protein A-1)
Odds Ratio Estimate 95% Wald Confidence Limits Protein B 1-397 vs. Protein B 1-36 6.861 (2.065, 22.802)
Protein B 1-237 vs. Protein B 1-36 33.975 (1.933, 597.137) Protein B 1-159 vs. Protein B 1-36 0.995 (0.454, 2.181) Protein B 15-36 vs. Protein B 1-36 0.006 (<0.001, 0.107) Protein B 20-36 vs. Protein B 1-36 0.005 (<0.001, 0.092) Protein B 1-19 vs. Protein B 1-36 0.004 (<0.001, 0.075) Protein B 1-14 vs. Protein B 1-36 0.004 (<0.001, 0.077)
Based on Table 4, almost all interaction strength comparisons of protein B constructs with Protein B 1-36 are statistically significant. Only the 95% Wald confidence limit of the odds ratio for the construct comparison between Protein B 1-159 and Protein B 1-36 includes the null value 1, indicating that the interaction strength of the two constructs with Protein A-1 may be the same. Compared with Protein B 1-36, all the other Protein B constructs have significantly
different interaction strength with Protein A-1.
Table 5. Firth Logistic Regression (Reference Level: Construct Protein B “1-49”). Construct Comparison (Interaction
Strength with Protein A-1)
Odds Ratio Estimate 95% Wald Confidence Limits Protein B 1-397 vs. Protein B 1-49 2.629 (0.728, 9.496)
Protein B 1-237 vs. Protein B 1-49 13.008 (0.715, 236.754) Protein B 1-36 vs. Protein B 1-49 0.383 (0.163, 0.903)
Based on Table 5, Protein B 1-49 may have similar interaction strength with Protein A-1 as Protein B 1-397 and Protein B 1-237, indicating that Protein B 1-49 is the shortest Protein B piece that interacts very strongly with Protein A-1. Protein B 1-49 interacts with Protein A-1 more strongly than Protein B 1-36.
Table 6. Firth Logistic Regression (Reference Level: Construct Protein B “1-159”). Construct Comparison (Interaction
Strength with Protein A-1)
Odds Ratio Estimate 95% Wald Confidence Limits Protein B 1-397 vs. Protein B 1-159 6.895 (2.002, 23.750)
Based on Table 6, Protein B 1-159 may have similar interaction strength with Protein A-1 as Protein B 36. However, compared with Protein B 237 and Protein B 397, Protein B 1-159 may have weaker interaction strength with Protein A-1.
Discussion:
According to the Mean Score Test that analyzes the general association between the response variable and independent variable, the interaction strength between Protein B and Protein A-1 is associated with the specific Protein B construct. The statistic Qs is 595.7, with a df
of 13 and p-value of < 0.0001 (Table 1). This means that assuming the null hypothesis is true, the probability of obtaining a sample as extreme as ours is < 0.0001, very unlikely. Thus, we can reject the null hypothesis that there is no association between the response variable (interaction strength of Protein B Construct with Protein A-1) and the independent variable (specific Protein B construct). In other words, the patterns of the response levels are heterogeneous across
different levels of the independent variable.
The full length of Protein B has 982 residues, and the N-terminal of Protein B is mainly responsible for its interaction with Protein A-1 (Figure 3). The confidence interval of the odds ratio for the odds of Protein B 1-397 and Protein B 1-237 includes the null value 1. We can say that the interaction strength of Protein B 1-397 may be the same as that of Protein B 1-237 with Protein A-1 (Table 2). The Firth logistic regression showed that the odds of strong or some interactions between the Protein B construct and Protein A-1 are all significantly different
intervals were all below 1 (Table 3). This means that the N-terminal domain of the Protein B has a stronger interaction with Protein A-1 than the C-terminal domain of Protein B, which is
consistent with the findings reported in the published literature (Li et. al, 2011).
According to the qualitative presentation of the interaction data, Protein B 1-36 seems to be the shortest construct that interacts relatively strongly with Protein A-1 (Figure 3). We see that any construct smaller than Protein B 1-36, compared with Protein B 1-36, had significantly different interaction strength with Protein A-1, with all confidence intervals of odds ratios excluding the null value of 1 and the upper bounds of the intervals all close to 0 (Table 4). However, interestingly, the confidence interval of the odds ratio of Protein B 1-273 and Protein B 1-36 (1.933, 597.137) did not include the null value of 1 (Table 4). The lower bound of the confidence interval (1.933) is close to 1. We can see that the odds of Protein B 1-237 obtaining a strong interaction or some interaction with Protein A-1 are at least 1.933 times the odds of Protein B 1-36. Thus, Protein B 1-36 may not be the most ideal, shortest construct that interacts strongly with Protein A-1.
Protein B 1-49 may be similar to that of Protein B 1-237 or Protein B 1-397 and lead to larger interaction strength.
References:
Al-Bassam, J., Chang, F. (2011). Regulation of microtubule dynamics by TOG-domain proteins XMAP215/Dis1 and CLASP. Trends in Cell Biology, 21(10), 604-614.
Bowne-Anderson, H., Hibbel, A., Howard, J. (2015). Regulation of microtubule growth and catastrophe: Unifying theory and experiment. Trends in Cell Biology, 25(12), 769-779. Brouhard, G. J., Stear, J. H., Noetzel, T. L., Al-Bassam, J., Kinoshita, K., Harrison, S. C., et al.
(2008). XMAP215 is a processive microtubule polymerase. Cell, 132(1), 79-88.
Downing, K. H., Nogales, E. (1998). Tubulin structure: Insights into microtubule properties and functions. Current Opinion in Structural Biology, 8(6), 785-791.
Honnappa, S., Gouveia, S. M., Weisbrich, A., Damberger, F. F., Bhavesh, N. S., Jawhari, H., Grigoriev, I., Rijssel, F. J.A. v., Buey, R. M., Lawera, A., Jelesarov, I., Winkler, F. K., Wuthrich, K., Akhmanova, A., Steinmetz, M. O. (2009). An EB1-Binding Motif Acts as a Microtubule Tip Localization Signal. Cell, 138(2), 366-376.
Li, W., Miki, T., Watanabe, T., Kakeno, M., Sugiyama, I., Kaibuchi, K., & Goshima, G. (2011). EB1 promotes microtubule dynamics by recruiting Sentin in Drosophila cells. The Journal of Cell Biology, 193(6), 973–983.
Slep KC. (2009). The role of TOG domains in microtubule plus end dynamics. Biochem Soc Trans, 37, 1002–1006.