Calculating Medication Compliance, Adherence, and Persistence in
Administrative Pharmacy Claims Databases
R. Scott Leslie, MedImpact Healthcare Systems, Inc., San Diego, CA
ABSTRACT
Compliance, adherence, and persistence are outcomes easily measured in pharmacy claims databases. However, these measures are often interchanged and calculated differently. The research community should settle on a common set of definitions and methods. This paper briefly explains compliance and persistence terminology and methods commonly used in observational pharmacy claims research and furthermore presents a preferred manner adopted by the Medication Compliance and Persistence Special Interest Group of ISPOR, the International Society for Pharmacoeconomics and Outcomes Research.
INTRODUCTION
Administrative pharmacy claims for the most part are cleaner and easier to work with than other administrative health care claims databases (i.e. medical and laboratory claims). First of all, the process of adjudicating pharmacy claims encompasses checking member eligibility and certain member and health plan restrictions. Therefore, errors are limited because a claim won’t process unless required fields are entered correctly. Second, data fields are
straightforward and intuitive. Data includes patient and prescriber information plus drug and dosing details (days of supply, quantity, drug name, and medication class, to name a few). An added benefit of pharmacy claims is “real time” availability. Many pharmacy claims databases are updated daily or weekly and don’t suffer from lag time encountered with medical records.
A downside of pharmacy databases, which is inherent for all observational databases, is actual utilization is likely to differ from observed utilization. That is, we don’t know if patients truly consume their medications and/or adhere to the medication dosing instructions.
Health outcomes related to pharmacy utilization include compliance, adherence, and persistence measurements. The purpose of this paper is to describe a recommended definition of the terms and offer code that calculates these medication utilization outcomes. This code can be a helpful start for calculating additional outcome measures.
THE TERMS AND CONCEPTS
The general term of adherence was defined by the World Health Organization in their 2001 meeting as, “the extent to which a patient follows medical instructions”. Specific to medication adherence, a systematic literature review by Hess et al. was conducted to gather methods used to calculate adherence in administrative pharmacy databases. Authors used a MEDLINE search and found multiple terms used to describe the concept and identified 11 manners used to calculate the metric.
A more comprehensive literature review on compliance, adherence and persistence was conducted by the Medication and Compliance Special Interest Group of ISPOR, the International Society for Pharmacoeconomics and Outcomes Research (Cramer et al.). This work group reviewed literature from 1966 to 2005 on the subject and also found inconsistency in definitions, methodology, and computations for these concepts. Researchers found the terms were used interchangeably and different measures were used for difference disease states. They also found arbitrary ways for defining good and poor compliance limits, and no guidance on methodology. Hence a set of methods and definitions would benefit the research community. At least some guidelines or a framework model for future work and interpretation of previous work. After this review the work group spent years of discussion to develop definitions and guidelines. They propose two distinct concepts to be used to describe patient’s medication behavior.
First, the terms compliance and adherence are to be used synonymously and to be defined as,
”the extent to which a patient acts in accordance with the prescribed interval and dose of a dosing regimen”. Second, persistence should be defined as the,
“the duration of time from initiation to discontinuation of therapy”.
Furthermore, the Analytic Methods Working Group developed a checklist of items that should be considered or included in a retrospective database analysis (Peterson et al). Using the ISPOR ideas and recommendations, I offer ways to calculate these pharmacy utilization outcomes using SAS®.
COMPLIANCE
Compliance can be calculated as both a continuous and dichotomous measure. As a continuous measure, the most common methods, as outlined and proposed by the ISPOR working group, are by way of medication possession ratio (MPR) and proportion of days covered (PDC). MPR is the ratio of days medication supplied to days in an time interval (Steiner). Where PDC is the number of days covered over a time interval (Benner). This differs from MPR in that it credits the patient with finishing the current fill of medication before starting the next refill. Some believe compliance can be overestimated by simply summing the days supply because patients usually refill their medication before completing the current fill.
With both methods, compliance can be made a dichotomous measure (compliant or not compliant) if a patient attains a specified level of compliance. This level should be based on results of studies showing detrimental health
outcomes when compliance drops below a certain level. For instance, research supports a 95% compliance threshold for antiretroviral medications (Paterson) and an 80% level for lipid lowering medications (Benner). Because optimal compliance is associated with the pharmacokinetics and dynamics of the drug, the days supplied, quantity supplied, and fill date fields in a claims database are the key variables required to compute MPR and PDC.
COMPLIANCE MEASURE BY MEDICATION POSSESSION RATIO
A simple calculation for MPR is to sum the days of supply for a medication over a time period using a SQL procedure. This time period may be a fixed time interval or the length the patient used the medication, for instance date of last claim. When using a fixed time interval one can truncate days of utilization that falls after the interval as done in the data step below. This truncation assures that all patients are reviewed over a similar time interval (all have the same 180-day denominator).
proc sql;
create table mpr as
select distinct member_id, count(*) as num_fills, sum(days_supply) as ttldsup, max(index_dt+days_supply,max(fill_dt+days_supply)) - index_dt as duration from claims
group by member_id; quit;
data mpr_adj; set mpr;
if duration gt 180 then do; compdiff=duration-180; dsuptrnc=ttldsup-compdiff; mpr=dsuptrnc/180; end; else do; mpr=ttldsup/180; end;
/* if want mpr to have max of 1 and duration have max of 180 days*/ mpr=min(mpr,1.0);
durtrnc=min(duration,180); run;
Using an example where a patient has three claims over a 180-day study period, the date of first claim (index date) is the first day of the study period and the end of the study period is 180 days after date of first claim (Figure 1).
Obs member_id fill_dt index_dt drug days_supply 946 603 02/17/2005 02/17/2005 a 30 947 603 06/13/2005 02/17/2005 a 30 948 603 08/11/2005 02/17/2005 a 30 Summing the days_supply field results in a total of 90 days of supply (ttldsup), but with the third claim extending beyond the study interval, the days supplied (dsuptrnc) is 65. Therefore, MPR is 65 days over 180 days or 0.361.
Figure 1: Medication Fill Patten in 180 Day Period 2/17/05 to 8/17/05 Claim 1 Day 1-30 6/13/2005 to 7/12/05 Claim 2 Day 117-146 8/11/05 to 9/9/05 Claim 3 X X Day 176-180
Study Period Begins Study Period Ends
2/17/05 8/17/05
Day 151-180 Day 181-210 Day 1-30 Day 31-60 Day 61-90 Day 91-120 Day 121-150
COMPLIANCE MEASURE BY PROPORTION OF DAYS COVERED
PDC looks at all days in the 180-day period to check for medication coverage. To calculate the PDC for the scenario above, indicator variables for each day are used to flag medication coverage. The resulting compliance proportion is similar to MPR in this scenario; however, can be different in situations with longer days of supply per claim or when calculating compliance for more than one medication. Although PDC requires more complex code, the added benefit is information on medication coverage specific for each day, assuming that the patient is consuming the medication as prescribed. This is helpful when assessing compliance for multiple medications. The days of overlap may be used to show an incremental gain by using both medications at the same time.
STEP 1
The first step is to transpose the data to a single observation per patient data set. This is done twice for the purposes of detailing the fill dates and corresponding days supply for each fill. It is essential to sort the data set by patient and fill date. Start and end dates for each subject are also calculated.
proc sort data=claims; by member_id fill_dt; run;
proc transpose data = claims out=fill_dates (drop=_name_) prefix = fill_dt; by member_id;
var fill_dt; run;
proc transpose data = claims out=days_supply (drop=_name_) prefix = days_supply; by member_id;
var days_supply; run;
data both;
merge fill_dates days_supply; by member_id;
format start_dt end_dt mmddyy10.; start_dt=fill_dt1;
end_dt=fill_dt1+179; run;
Obs member_id fill_dt1 fill_dt2 fill_dt3 fill_dt4 fill_dt5 265 603 02/17/2005 06/13/2005 08/11/2005 . .
Obs days_supply1 days_supply2 days_supply3 days_supply4 days_supply5 265 30 30 30 . . Obs start_dt end_dt
265 02/17/2005 08/15/2005
STEP 2
Next, a data step uses arrays and DO loops to find the days of medication coverage for each patient and calculates the proportion of covered days in the review period. The first array, daydummy, creates a dummy variable for each day in the review period. The next two arrays, groups the fill_dt and days_supply variables setting up the DO loops. In this data set, the maximum number of fills incurred by a patient was 11 so there are 11 elements for these two arrays. One can set the number of elements to a value beyond the reasonable amount of fills or get the maximum number of fills in the data set from a proc contents procedure. The first do loop sets each dummy variable,
daydummy, to 0. The second do loop uses an IF statement to flag the days of the review period that the patient was supplied the medication. Next, the variable dayscovered sums the daydummy variables. This sum is used as the numerator in calculating p_dayscovered, the proportion of covered days in the 180 day study period.
data pdc; set both;
array daydummy(180) day1-day180;
array filldates(*) fill_dt1 - fill_dt11;
array days_supply(*) days_supply1-days_supply11; do ii=1 to 180; daydummy(ii)=0;end;
do ii=1 to 180;
do i = 1 to dim(filldates) while (filldates(i) ne .);
if filldates(i)<= start_dt + ii -1 <= filldates(i)+days_supply(i)-1 then daydummy(ii)=1;
end; end; drop i ii;
dayscovered=sum(of day1 - day180);label dayscovered='Total Days Covered'; p_dayscovered=dayscovered/180;label p_dayscovered='Proportion of Days Covered'; run;
proc print data=pdc;where member_id=603;run;
The result is a data set that has 180 dummy variables, one for each day of the time period, indicating medication coverage. Only a few of the dummy variables are displayed below. In this example the patient’s last fill_date is on day 176 (see Figure 1 above) with a majority of the days supply for this claim extending beyond the study period. The claim is truncated and only 5 of days of this claim are included in the days covered count.
Obs member_id day1 day2 day3 day4 day5 ***day6-day29*** day30 day31 day32 day33 265 603 1 1 1 1 1 1 1 0 0 0
Obs ***day34-day115*** day116 day117 day118 day119 ***day120-day145*** day146 265 0 0 1 1 1 1 1 Obs ***day147-day174*** day175 day176 day177 day178 day179 day180 265 0 0 1 1 1 1 1 Obs dayscovered p_dayscovered
EXAMPLE 2: CREDITING OVERLAPPING DAYS SUPPLY
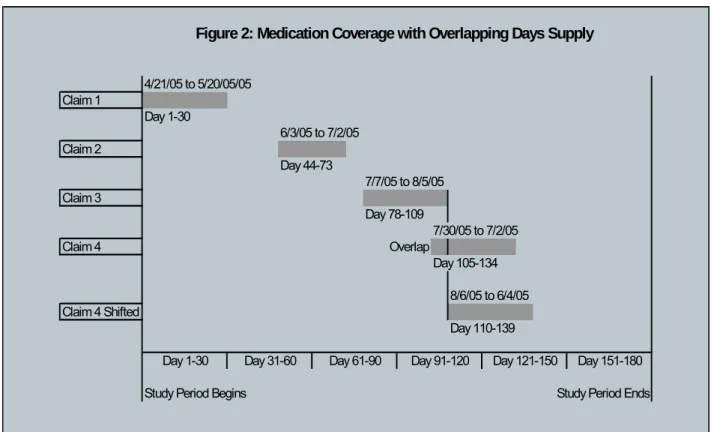
In this example, a patient refills their medication before exhausting the previous fill. Figure 2 shows this scenario, where the fourth claim, filled on 7/30/05, occurs before the end of supply of the third claim (8/5/05). Proportion of days covered is calculated in the same manner and credits the patient for the overlapping days supply assuming the patient is finishing the current prescription before starting the refill prescription. This code is similar to the previous example with one extra step that identifies the overlapping days supply and shifts the fill date forward to the day after the end of supply of the previous fill.
Using the same steps as in previous example, adding this additional DO loop adjusts fill dates by shifting them forward. This starts with the second fill:
do u=2 to 11 while (filldates(u) ne .);
if filldates(u)<filldates(u-1)+days_supply(u-1) then filldates(u)=filldates(u-1)+days_supply(u-1); end;
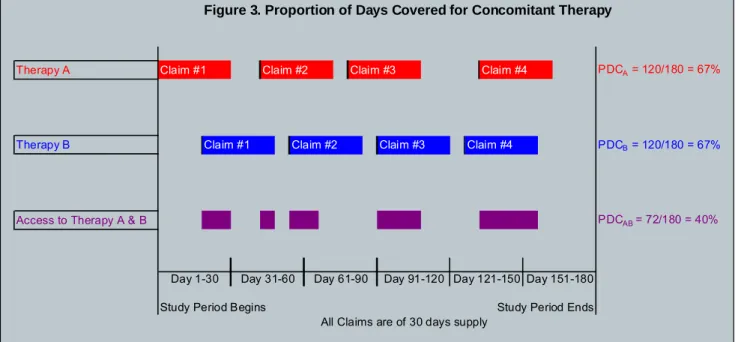
Shifting the fourth fill date credits the patient with 7 more days supply, increasing the days covered from 113 to 120 and increasing proportion of days covered from to 62.8% to 66.6%. Larger differences would be seen in cases where a patient has multiple claims and multiple overlaps. These steps can be used to calculate length of therapy of multiple medications. To assess compliance to therapy of two medications, two sets of day dummy variables would be created and the DO loops would then flag the days that both medications were covered. Such a scenario is illustrated below in Figure 3.
Figure 2: Medication Coverage with Overlapping Days Supply
4/21/05 to 5/20/05/05 Claim 1 Day 1-30 6/3/05 to 7/2/05 Claim 2 Day 44-73 7/7/05 to 8/5/05 Claim 3 Day 78-109 7/30/05 to 7/2/05 Claim 4 Overlap Day 105-134 8/6/05 to 6/4/05 Claim 4 Shifted Day 110-139
Study Period Begins Study Period Ends
Day 151-180 Day 1-30 Day 31-60 Day 61-90 Day 91-120 Day 121-150
Figure 3. Proportion of Days Covered for Concomitant Therapy
Therapy A Claim #1 Claim #2 Claim #3 Claim #4 PDCA = 120/180 = 67%
Therapy B Claim #1 Claim #2 Claim #3 Claim #4 PDCB = 120/180 = 67%
Access to Therapy A & B PDCAB = 72/180 = 40%
Study Period Begins Study Period Ends
All Claims are of 30 days supply
Day 151-180 Day 1-30 Day 31-60 Day 61-90 Day 91-120 Day 121-150
PERSISTENCE
As noted, compliance is delineated from persistence, since persistence is “the duration of time from initiation to discontinuation of therapy”. This is usually the time, measured in days, from first claim to last claim (plus the days supply of the last claim) considering the days between refills. A limit on the days between fills, or ”gap”, should be set based on the properties of the drug (Peterson). For medications used on seasonal basis, e.g., asthma or allergic rhinitis medications, persistence can be measured as number for refills for a medication within a time interval to monitor patient’s refill behavior.
Persistence can also be described as a dichotomous variable (persistent or not) if a person was continued therapy beyond an elapsed time period, e.g. 90, 180, or 365 days.
In example 2 shown in Figure 2, persistence would be defined as days to discontinuation and measured as days from day of first claim to day of first gap that is ≥ 30 days. Days to discontinuation would be the 130 days from 4/21/05 to 6/04/05 because the first gap of 30 days or longer occurs after the last claim. Notice the gaps between the first and second claim and second and third claim are allowable as these gaps are less than 30 days. Therefore the patient is not considered discontinuing therapy until after the fourth claim.
proc sort data=claims;by member_id fill_dt;run; data pers;
set claims;
by member_id fill_dt;
lstsply=fill_dt+days_supply; gap=fill_dt-lag(lstsply);
if first.member_id=1 then epsd=1; else if gap>30 then epsd+1; format lstsply mmddyy10.; run;
proc sql;create table gap as
select distinct member_id, max(epsd) as epsd from pers
group by member_id;quit;
proc freq data=gap;tables epsd;run; proc sql;
where epsd=1
group by member_id;quit;
proc freq data=persis;tables days_therapy;run;
CONCLUSION
Administrative pharmacy claims are useful in calculating observed compliance (a.k.a. adherence) and persistence health outcomes. Reviews of research found a variety of definitions, methods, terminology on these subjects. To provide a model for future work and interpretation of previous work, the Medication Compliance and Persistence Special Interest Group of ISPOR proposed methods and philosophy based on years of review by subject matter experts and leaders in the field. This paper presents the proposed concepts and terminology for the outcomes and offers SAS® code to compute these measures.
The appropriate level of compliance is dependent on the disease and the properties of the medication. MPR is the most commonly used measure and provides a reasonable estimate of compliance and persistence. PDC adds more information on medication coverage specific for each day, but assumes a patient is consuming refills as prescribed. Every measure is fraught with an element of error and a calculated compliance based on observable data gives an estimate of actual compliance. Reliable and valid data sources minimize the impact of error. Understanding patient’s medication use increases the knowledge of whether therapeutic ineffectiveness or noncompliance contributes to poor patient outcomes.
REFERENCES
Hess, L.M., Raebel, M.A., Conner, D.A., Malone, D.C. 2006. “Measurement of Adherence in Pharmacy Administrative Databases: A Proposal for Standard Definitions and Preferred Measures”. The Annals of Pharmacotherapy 40;1280-1288
International Society of Pharmacoeconomics and Outcomes Research (ISPOR) Medication Compliance and Persistence Special Interest Group.
http://www.ispor.org/sigs/medication.asp
Cramer, J.A. et al. 2007. “Medication Compliance and Persistence: Terminology and Definitons”. Value in Health 11(1):44-7.
Peterson AM et al. 2007. ”A Checklist for Medication Compliance and Persistence Studies Using Retrospective Databases”. Value in Health 10(1):3-12.
Steiner J.F., Prochazka A.V. 1997. “The assessment of refill compliance using pharmacy records. Methods, validation, and applications”. Journal of Clincal Epidemiology 50:105-106.
Benner JS, Pollack MF, Smith TW, et al. Long-term persistence in sue of statin therapy in elderly patients. JAMA 2002;288.455-6.
Paterson D.L., Swindells S., Mohr J., et al. 2000. “Adherence to protease inhibitor therapy and outcomes in patients with HIV infection”. Ann Intern Med 133:21-30.
Leslie, R. Scott. 2007. “Using Arrays to Calculate Medication Utilization.” Proceedings of the 2007 SAS Global Forum, Orlando, FL. Paper 043-2007.
SAS Institute Inc. 2004. “SAS Procedures: The SQL Procedure”. SAS OnlineDoc® 9.1.3. Cary, NC: SAS Institute Inc. http://support.sas.com/onlinedoc/913/docMainpage.jsp?_topic=proc.hlp/a000146897.htm (April 2, 2006)
SAS Institute Inc. 2004. “Language Reference Concepts: Array Processing”. SAS OnlineDoc® 9.1.3. Cary, NC: SAS Institute Inc.
http://support.sas.com/documentation/onlinedoc/91pdf/sasdoc_913/base_lrconcept_9196.pdf (April 2, 2006) SAS Institute Inc. 2004. “SAS Procedures: The TRANSPOSE Procedure”. SAS OnlineDoc® 9.1.3. Cary, NC: SAS
ACKNOWLEDGMENTS
The author would like to thank Femida Gwadry-Sridhar for her explanation of the presented compliance and persistence concepts and her review of this paper.
CONTACT INFORMATION
Your comments and questions are valued and encouraged. Contact the author at: R. Scott Leslie
MedImpact Healthcare Systems, Inc. 10680 Treena Street
San Diego, CA 92131 Work Phone: 858-790-6685 Fax: 858-689-1799
Email: [email protected]
SAS and all other SAS Institute Inc. product or service names are registered trademarks or trademarks of SAS Institute Inc. in the USA and other countries. ® indicates USA registration.