IEICE Electronics Express, Vol.* No.*,*-*
References
A method for estimating the
3D rendering performance of
the SoC in the early design
stage
Zhen Xie
a), Yang Zhang, and Longxing Shi
National ASIC System Engineering Research Center, Southeast University, Nanjing, 210096, China
Abstract: A method for estimating the 3D rendering performance of the
SoC (System on Chip) in the early design stage is proposed. Commonly the rendering performance is evaluated by some widely used graphics bench-marks. However these benchmarks need the support of the OS (Operation System), which makes them impractical in the early design stage of the SoC. In this work, through building a linear regression model, low-level graphics performances are used to estimate the rendering performance of the system for specific graphics benchmarks. The benefit is that the low-level perfor-mances can be obtained in the early design stage by simulation, and the es-timation can be made as well to help designers make decisions. Experiments show that the results estimated properly match with the practical perfor-mances measured.
Keywords: SoC, 3D rendering performance, benchmark, estimation Classification: Electron devices, circuits, and systems
[1] T. Capin, K. Pulli and T. Akenine-Moller: IEEE Computer Graphics and ap-plications 28 [4] (2008) 74.
[2] X. Ma, Z. Deng, M. Dong and L. Zhong: Computer 46 [4] (2013) 76.
[3] The Khronos Group Inc.: OpenGL ES common profile specification (2010) https://www.khronos.org.
[4] T. Mitra and T. C. Chiueh: MICRO (1999) 62.
[5] J. Roca, V. Moya, C. González, C. Solís, A. Fernández and R. Espasa: IISWC (2006) 17.
[6] S. Molnar, M. Cox, D. Ellsworth and H. Fuchs: IEEE Computer Graphics and applications 14 [4] (1994) 23.
[7] P. J. Joseph, K. Vaswani and M. J. Thazhuthaveetil: HPCA (2006) 99.
1 Introduction
3D graphics applications, especially 3D games have in recent years become prevalent on mobile devices, such as smartphones and tablets [1]. 3D graphics
copyediting. Content is final as presented.
DOI: 10.1587/elex.11.20140386 Received April 24, 2014 ©IEICE 2014
applications require the support of graphics hardware. Most mobile devices have graphics hardware (i.e., the mobile GPU) integrated into a SoC (System on Chip), together with the core processor and other peripherals. Obviously, the 3D ren-dering performance of the mobile GPU is related to the system architecture.
The modern SoC is evolving at a rapid pace. In the quest for better perfor-mance, sophisticated architectural enhancements have being introduced. However, the increasing complexity of architectures has direct consequence on the design. To meet the application requirements and arrive at optimal design points, esti-mating system performance in the early design stage is expected.
There are several widely used 3D graphics benchmarks for mobile devices, such as GFXBench and Basemark X, which use the average frame rate of con-sole-quality gaming content to quantify the 3D rendering performance. However, such benchmarks need the support of the OS (Operation System). The problem is that in the early design stage, the hardware prototype is not implemented yet, and the simulation time for running the OS and the benchmark is too long to be ac-ceptable. Besides, specific versions of the OS are required by these benchmarks, which probably cannot run on the target SoC. What is more, it has been observed on most Android devices that the max rendering frame rate is limited at 60 fps, so the results of benchmarks with smaller workloads could be inaccuracy for the high-end SoC.
In this paper, we aimed at providing a method for estimating the frame rate of specific applications for the SoC in the early design stage. The experimental re-sults show that compared to the practical application performance measured on the real-life SoC, the rendering performance estimated is appropriate. To the best of our knowledge, this is the first study that has ever been attempted.
The rest of this paper is organized as follows. In Section 2, we discuss the basic concept of the mobile GPU pipeline and the estimation method. The ex-perimental frame-work and the results are described in Section 3. Finally, Section 4 concludes the paper.
2 Overview of the estimation method
2.1 Mobile GPU Pipeline AbstractionSince the architectures of graphics hardware designed by vendors are diverse [2], OpenGL (Open Graphics Library) is presented to interact with different graphics hardware. OpenGL is a cross-language, multi-platform application programming interface for rendering 2D and 3D graphics. OpenGL ES (OpenGL for Embedded Systems) [3] is a subset of OpenGL, designed for embedded systems. At present, OpenGL ES 2.0 is popular, and our work is based on this version.
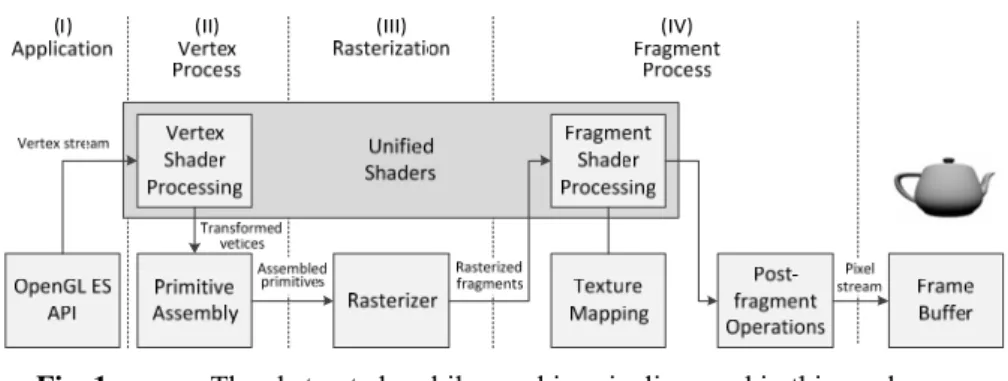
OpenGL ES abstracts 3D rendering as a series of operations. Inspired by OpenGL ES, we use a logical, abstracted graphics pipeline to describe mobile GPU architecture in this work, as illustrated in Fig. 1. The abstracted graphics pipeline contains the following stages executed one by one: application, vertex process, rasterization and fragment process.
Some papers reported the results of dynamic 3D workload characterization efforts [4, 5]. The results show that the workload of 3D applications is unique, i.e. the workload for each pipeline stage is distinctive, which results the different ren-dering frame rate from others. The most important processes of the renren-dering pipeline are vertex process, texture mapping and operations processed by shaders. Blending is the most common post-fragment operation. Experiments show that whether the step is enabled or disabled, the rendering time remains the same. This means the step of post-fragment operations does not stall the pipeline nor impact the performance of fragment process. We think the reason is that the TBR (Tile Based Rendering) architecture [6] has been widely used in mobile GPUs, the main benefit of which is that fast on-chip buffer can be used during the rendering for color and depth operations.
Therefore, we conclude it is feasible to use the performance of each pipeline stage, called low-level performances, to estimate the frame rate of a specific 3D application. The low-level performances can be obtained in the early design stage, consisting of the triangle throughput, the texture fillrate and the calculation speed of shaders (i.e. FLoating-point Operations Per Second, FLOPS). The flow of the proposed 3D rendering performance estimation method is shown in Fig. 2.
We construct a linear regression models to relate the practical application rendering performance to the low-level performances. A regression model is a compact mathematical representation of the relationship between the response variable and the input parameters, widely used to obtain estimates of parameter significance as well as predictions of the response variable [7]. One of the simpler forms of such models is
Fig. 1. The abstracted mobile graphics pipeline used in this work.
Low-level Performances
Practical Application Performances Measured by test suites or microbenchmarks,
based on simulation platform
Measured by graphics benchmarks, based on hardware platform
Triangle Throughput Texture Fillrate Calculation Speed of Shaders
Estimating
Fig. 2. The flow of the proposed 3D rendering performance
0 1
m i i i
y x
. (1)Where y is the dependent or response variable, {xi | 1 ≤i ≤m} are the independent or regressor variables and ε is the residual, i.e. the error due to lack of fit. β0 is interpreted as the intercept of the response surface with the y-axis and {βi | 1 ≤i≤
m} are known as the partial regression coefficients. The coefficient values rep-resent the expected change in the response y per unit change in xi and indicate the relative significance of the corresponding terms.
Our goal in this paper is to accurately estimate the coefficient values. We achieve this by performing measurement-based experiments in which the regres-sor variables are different and the resulting performance metric is fitted as per Eq. (1), minimizing the residual error simultaneously. As a by-product, we obtain an ordering of the significant factors affecting the rendering performance.
2.3 Method for obtaining the low-level performances
The low-level performances can be obtained in the early design stage by RTL simulation, since mobile GPU vendors provide test suites that SoC designers can use to verify the integration of the mobile GPU into their designs. Based on the test suites, the ideal low-level performances can be obtained by simulation in the early design stage, including the triangle throughput and the texture fillrate. The calcu-lation speed of shaders can be concluded from the structure of the shader.
In this work, a suite of microbenchmarks, named SeuBench, is designed to evaluate the practical low-level performances, which is based on OpenGL ES 2.0. We have implemented a SoC which integrates with a mobile GPU, and the IP (Intellectual Property) core and the corresponding test suites are provided by the vendor. Experiments show that there is a negligible gap, about 3%, between the ideal low-level performances (measured by the test suits based on simulation platform) and the practical low-level performances (measured by the micro-benchmarks based on hardware platform). Therefore, the practical low-level per-formances are used as the regressor variables to estimate the partial regression coefficients and the rendering performance of different mobiles GPUs.
3 Experiments and results
In this section, experiments are carried out to demonstrate how the estimation works. Some mobile devices are measured by microbenchmarks to obtain the low-level performances, which are used as the regressor variables to construct a linear regression model for a specific 3D application and estimate the partial re-gression coefficients. The rendering performance estimated is compared with the measured practical application performance to validate the estimation method.
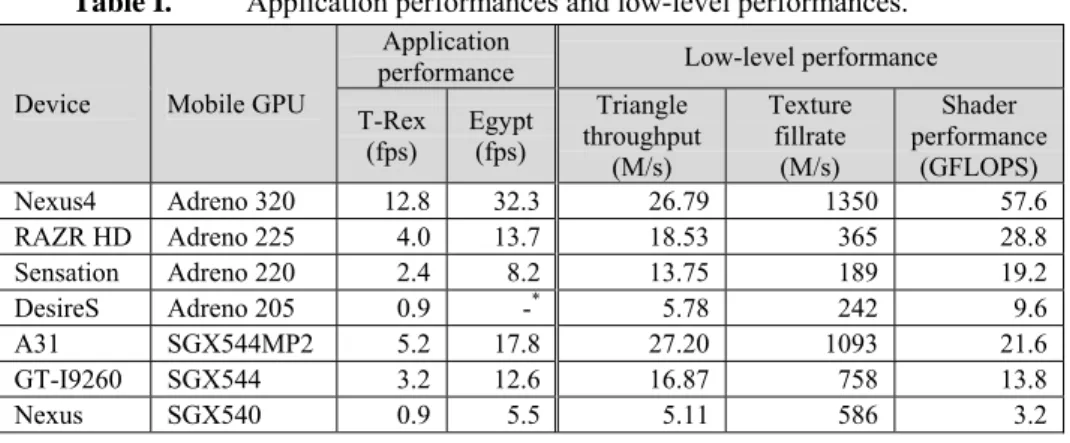
Graphics benchmark GFXBench 2.7 T-Rex HD Offscreen (T-Rex) and GFXBench 2.5 Egypt HD Offscreen (Egypt) are used to represent the practical 3D application and evaluate the 3D rendering performance. These two benchmarks use the average frame rate of console-quality gaming content to quantify the 3D rendering performance. Some mobile devices are measured by the benchmarks and microbenchmarks, and the results are shown in Table I. Note that dynamic
voltage and frequency scaling (DVFS) is a commonly-used power management technique. We use a tweaking tool named Trickster MOD to set the GPU scaling governor (on-demand or performance), performances measured are approximate, which means that mobile GPU are running at the peak frequency during bench-marking and the results measured are the peak performances.
The application frame rates and the low-level performances of these devices are considered as samples, and processed using MATLAB to train the linear re-gression model. Leave-One-Out Cross-Validation (LOOCV) is used to test the accuracy of the predictive model. A single sample from the original samples is used as the validation data, and the remaining samples are used as the training data. This is repeated such that each sample is used once as the validation data. For each sample, the frame rate of the specific application estimated using the linear regress model is compared with the practical result as shown in Fig. 3. The frame rates estimated substantially match those measured, and the maximum error of the es-timation is 1.07 fps for T-Rex and 1.48 fps for Egypt, which is acceptable.
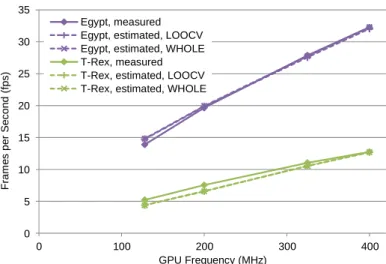
The results from the cross-validation are averaged to produce a single esti-mation. The average partial regression coefficients are shown in Table II (identi-fied as LOOCV in the Source column). Nexus4 with the mobile GPU running at different frequencies are used as new devices to test the linear regression model, as shown in Fig. 4.
0 2 4 6 8 10 12 14 Nexus4
RAZR HD Sensation DesireS A31 GT-I9260 Nexus
T-Rex, Frames per Second (fps)
Measured Estimated
0 5 10 15 20 25 30 35 Nexus4
RAZR HD Sensation
DesireS A31 GT-I9260 Nexus
Egpyt, Frames per second (fps)
Measured Estimated
Fig. 3. LOOCV: graphics benchmarks measured and estimated
per-formances for mobile devices with different mobile GPUs.
Table I. Application performances and low-level performances.
Device Mobile GPU
Application
performance Low-level performance
T-Rex (fps)
Egypt (fps)
Triangle throughput
(M/s)
Texture fillrate
(M/s)
Shader performance
(GFLOPS)
Nexus4 Adreno 320 12.8 32.3 26.79 1350 57.6
RAZR HD Adreno 225 4.0 13.7 18.53 365 28.8
Sensation Adreno 220 2.4 8.2 13.75 189 19.2
DesireS Adreno 205 0.9 -* 5.78 242 9.6
A31 SGX544MP2 5.2 17.8 27.20 1093 21.6
GT-I9260 SGX544 3.2 12.6 16.87 758 13.8
Nexus SGX540 0.9 5.5 5.11 586 3.2
Besides, all the seven samples are used as training data to train the linear re-gression model, and the partial rere-gression coefficients are also shown in Table II (identified as WHOLE in the Source column). The coefficients are close to the average coefficients produced by the cross-validation. This model is also validated by the new devices (Nexus4 with the mobile GPU running at different frequencies) as shown in Fig. 4. As expected, the two sets of estimation results are also very close, and both match the practical performances well, which suggests the esti-mation method is effective. The linear regression model trained by all the samples is adopted since the results match the performances measured a little better. The maximum error of the estimated frame rate is 0.97 fps for T-Rex and 0.93 fps for Egypt. The results are accurate enough to be acceptable.
From Table I and Table II, we can also find that for Nexus4 improving the triangle throughput, texture fillrate and shader performance by 1% will increase the frame rate of T-Rex by 0.01%, 0.40% and 0.73% respectively, and increase the frame rate of Egypt by 0.23%, 0.47% and 0.45% respectively. This means that for T-Rex, the bottleneck of the rendering is shader calculation and texture mapping, and the triangle throughput has little impact on the performance. While for Egypt, the impact of the triangle throughput cannot be ignored.
By simulation, the low-level performances of a SoC architecture parameter setting can be measured in the early design stage, and then the relationship be-tween SoC architecture parameters and the rendering performance can be built to help designers make decisions. For example, the rendering performance increases
0 5 10 15 20 25 30 35
0 100 200 300 400
Fram
e
s
pe
r
S
e
c
o
n
d
(f
ps)
GPU Frequency (MHz) Egypt, measured
Egypt, estimated, LOOCV Egypt, estimated, WHOLE T-Rex, measured T-Rex, estimated, LOOCV T-Rex, estimated, WHOLE
Fig. 4. Graphics benchmarks measured and estimated performances
for Nexus4 with the mobile GPU running at different frequencies.
Table II. The coefficients of the low-level performances.
Application Source ThroughputTriangle Texture fillrate performance Shaders Intercept
T-Rex WHOLE LOOCV 0.0018 0.0038 0.1598 -1.6580
0.0026 0.0037 0.1601 -1.6616
Egypt WHOLE LOOCV 0.1825 0.0087 0.2903 -1.2917
with the running frequency of the mobile GPU, while the growth flattens as shown in Fig. 4. Designers can choose the optimized selectable range of the peak running frequency considering the power consumption.
4 Conclusions
In this paper, a method for estimating the 3D rendering performance of the SoC in the early design stage is proposed. Considering the composition of the rendering pipeline, it is feasible to use the low-level performances to estimate the frame rate of a specific 3D application. The low-level performances could be obtained in the early design stage, consisting of the triangle throughput, the texture fillrate and the calculation speed of shaders. A linear regression models is constructed to relate the practical application rendering performance to the low-level performances. The rendering performance estimated is compared with the practical application ren-dering performance, and the result shows that the estimation method is accurate and effective, which could also be used to help architects choose appropriate ar-chitecture parameters and make the optimized design decisions.
Acknowledgments
This work was supported by the National Natural Science Foundation of China (61204023), the National High Technology Research and Development Program of China (863 Program) (2012AA012703) and the Natural Science Foundation of Jiangsu Province (BK2011334).