A Graph theory algorithmic approach to data clustering and its
Application
K. Venkatasubramanian, Dr. S.K.Srivatsa,
Dr. C. Parthasarathy
Research Scholar, SCSVMV University, KancheepuramSenior Prof. Department of CSE
Pratyusha Institute of Technology & Management(PITAM) Chennai-602 025.
Assistant Professor,Dept. of IT, SCSVMV University Kancheepuram
Abstract
Clustering is the unproven classification of data items, into groups known as clusters. The clustering problem has been discussed in many area of research in many disciplines; this reflects its huge usefulness in the field of data analysis. However, clustering may be a difficult problem statistically, and the differences in assumptions in different disciplines made concepts and methodologies slow to occur. This paperpresentstaxonomy of clustering techniques, and recent advances in graphtheorytic approach. We also describe some important applications of clustering algorithms such as image segmentation, object recognition, and information retrieval.
Key words- weighted graph, clustering, image segmentation, image retrieval.
1. Introduction
Data clustering is an key methodology in explore the data analysis. The main objective of clustering is to partition a dataset into clusters in terms of its basic structure, without resorting to any a priori knowledge such as the number of clusters, the distribution of the data elements, etc. Clustering is a powerful tool and has been studied and applied in many research areas, which include image segmentation [1,2], machine learning, data mining [3], and bioinformatics [4,5]. Although many clustering methods have been proposed in the recent decades, there is no universal one that can deal with all cluster problems, since in the real world clusters may be of arbitrary shapes, varied densities and unbalanced sizes [6,7]. In addition, Kleinberg [8] presented an impossibility theorem to indicate that it is difficult to develop a universal clustering scheme. However, in general, users have not any a priori knowledge on their datasets, which makes it a tough task for them to
select suitable clustering methods. This is the dilemma of clustering.
Wu, Zhenyu et al [9], introduced a novel graph theoretic approach for data clustering and its application to the image segmentation problem where The data to be clustered are represented by an undirected adjacency graph with arc capacities assigned to reflect the similarity between the linked vertices. Clustering is achieved by removing arcs of to form mutually exclusive subgraphs such that the largest inter-sub-graph maximum flow is minimized. The segmentation is achieved by effectively searching for closed contours of edge elements (equivalent to minimum cuts ), which consist mostly of strong edges, while rejecting contours containing isolated strong edges. This method is able to accurately locate region boundaries and at the same time guarantees the formation of closed edge contours.
2. Graph–Theoretic Clustering
We represent the data to be clustered as an undirected edge-weighted graph with no self-loops G =(V, E,w) , where V = {1,...,n} is the vertex set, E⊆V × V is the edge set, and w : E → IR * +is the (positive)
weight function. Vertices in G correspond to data points, edges represent neighborhood relationships, and edge-weights reflect similarity between pairs of linked vertices (fig-1). As customary, we represent the graph G with the corresponding weighted adjacency (or similarity) matrix, which is the n × n symmetric matrix A = (aij) defined
as[10]-aij= ( , ), ( , ) ∈
0, ℎ .
cluster and those outside. When the entities are represented as an edgeweightedgraph, these two conditions amount to saying thatthe weights on the edges within a cluster should be large,band those on the edges connecting the cluster nodes to theexternal ones should be small[12,13].
Fig-1, similarity weighted graph with
To give our formal definition of a cluster, we start withthe intuitive idea that the assignment of the edge-weightsinduces, in some way to be described, an assignment ofweights on the vertices. This perspective gives us a chanceto analyze the assignment of the edge-weights in a simplerand fruitful way. To grasp the intuition behind this idea, consider the graph in Figure 1 and the subgraph inducedby the set S = {4, 5, 6, 7}. Observe that the edges incident on 7 has the high weight where as the edges incident in 4 are low weight which shows a ranking among the vertices. This ranking among the edges and vertices gives us an idea about the cluster formation. [14,15].
2.1 Feature Extraction
This work, used the textural features which is a vector consists of two sets offeatures which are intended to perform a multi-scale textureanalysis which is crucial for a compact representationin large databases containing different types of compleximages.The first set of features are computed from the line-angle-ratiostatistics which is a texture histogram methodthat uses the spatial relationships between lines as well asthe properties of their surroundings. Spatial relationshipsare represented by the angles between intersecting linepairs and properties of the surroundings are representedby the ratio of the mean gray levels inside and outside theregions spanned by those angles. The second set of featuresare the variances of gray level spatial dependenciesand are computed from the
co-occurrence matrices for differentspatial relationships[16,17].
3. Image Retrieval
In most of the retrieval algorithms, a distance measureis used to rank the database images in ascending order oftheir distances to the query image, which is assumed to correspondto a descending order of similarity. we defined a likelihood ratio to measure the relevancyof two images, one being the query image and onebeing a database image, so that image pairs which had ahigh likelihood value were classified as “relevant” and theones which had a
lower likelihood value were classified as“irrelevant”.
Fig-2 , Image retrival of 10 images when N=5, 1 is the original query
between each query imageand each image in the retrieval set of that query image[20].
4. Algorithm for Graph Theoretic Clustering
Given dense regions, to find the clusters of the graph,
1. Define the dense-region relation F as
F = { (B1, B2) | B1, B2are dense regions of R
# ∩
# ≥
# ∩
# ≥ }
where MINOVERLAP is a threshold supplied by the user. Merge the regions that have enough overlap if all of the nodes in the set resulting after merging have high enough associations.
The result is a collection of clusters in the graph. Note that a node can be a member of multiple clusters because of the overlap allowed between them.
5. Experiments and Results
Application to image segmentation
We apply our clustering methodology to the segmentation of intensity and color images. The image to be segmented is represented as an edge-weighted undirected graph, where vertices correspond to individual pixels and the edge-weights reflect the “similarity ” between pairs of vertices. As
customary, we define a similarity measure between
pixels based on brightness/color proximity. Specifi -cally, in our experiments the similarity between pixels i and T j was measured by [21]:
where σ is a positive real number which affects the decreasing rate of w, and F(i) is defined as the
intensity value at node i, normalized to a real number in the interval [0, 1], for segmenting brightness images, and as F(i)= [v, vs sin(h),vscos(h)](i), where
h, s, v are the HSV values of pixel i, for color segmentation.
In principle, our clustering algorithm consists of iterativelyfinding a dominant set in the graph using
replicator dynamics and then removing it from the graph, until all vertices have been clustered. Indeed, in the experiments reported here, to avoid the formation of small meaningless clusters, we repeated the process until 90% of the pixels were clustered, the remaining ones being assigned to the closest clusters, in terms of brightness/color proximity. In our experiments, we used the discrete-time replicator equations . The process was started from the simplex barycenter and stopped after a few iterations (typically, no more than three). To improve the segmentation results, after convergence small isolated regions were incorporated into larger ones
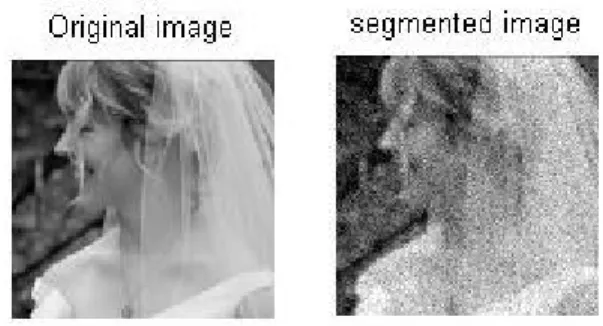
(seefigure’s captions for details). Figures 3 to 7 show
the results obtained with our segmentation algorithm on various natural brightness and color images. The left side of eachfigure shows the original image and
the right one shows the corresponding segmentation, where connected pixels having the same gray level are intended to belong to the same region. On average, the algorithm took only a few seconds to return a segmentation, on a machine equipped with a 750 MHz Intel Pentium III. Figure 3 shows an intensity image taken during a baseball game that has been used originally by Shi and Malik [24] and other authors [4, 7]. As can be seen, unlike other algorithms [24, 7, 4], ours was able to separate the grassy region from the back wall in a nice way.
Figure 2.An 80 × 120 intensity image and its
segmentation. Parameter setting: σ =0.14. Minimal region size of interest is 11
We have introduced the notion of a dominant set ofvertices in an edge-weighted graph and have shown howthis concept can be relevant in pairwise clustering as wellas image segmentation problems. The framework, however, is general and can beapplied in a variety of computer vision and pattern recognitiondomains such as, for example, texture segmentation,perceptual grouping, and the unsupervised organization of an image database.
Though many researchers have done a lot of work in this field , a lot of work has to be done in this area. In this work we have got the result i.e a segmented image from an original image but we could not consider the noise removal process concurrently. In future work one can consider this point and use different noise removal algorithm to obtain a better quality image.
References
[1] W. Cai, S. Chen, D. Zhang, Fast and robust fuzzy c-means clustering algorithms incorporating local information for image segmentation, Pattern Recognition 40 (2007) 825–838.
[2] Z. Wu, R. Leahy, An optimal graph theoretic approach to data clustering: theory and its application to image segmentation, IEEE Transactions on Pattern Analysis and Machine Intelligence 15 (1993) 1101–
1113.
[3] J. Han, M. Kamber, Data Mining: Concepts and Techniques, Morgan-Kaufman, San Francisco, 2006. [4] Z. Yu, H.S. Wong, H. Wang, Graph-based consensus clustering for class discovery from gene expression data, Bioinformatics 23 (2007) 2888–
2896.
[5] S. Bandyopadhyay, A. Mukhopadhyay, U. Maulik, An improved algorithm for clustering gene expression data, Bioinformatics 23 (2007) 2859–
2865.
[6] A.K. Jain, M.C. Law, Data clustering: a user's dilemma, Pattern Recognition and Machine Intelligence, Lecture Notes in Computer Science, 3776, Springer, Berlin, Heidelberg, 2005, pp. 1–10.
[7] R. Xu, D. Wunsch II, Survey of clustering algorithms, IEEE Transactions on Neural Networks 16 (2005) 645–678.
[8] J. Kleinberg, An Impossibility Theorem for Clustering, MIT Press, Cambridge, MA, USA, 2002.
[9] Wu, Zhenyu, and Richard Leahy. "An optimal graph theoretic approach to data clustering: Theory and its application to image segmentation." Pattern Analysis and Machine Intelligence, IEEE Transactions on 15.11 (1993): 1101-1113.
[10] Iam-On, Natthakan, et al. "A link-based cluster ensemble approach for categorical data clustering." Knowledge and Data Engineering, IEEE Transactions on 24.3 (2012): 413-425.
[11 ]Elhamifar, Ehsan, and Rene Vidal. "Sparse subspace clustering: Algorithm, theory, and applications." Pattern Analysis and Machine Intelligence, IEEE Transactions on 35.11 (2013): 2765-2781.
[12] Menendez, Hector D., David F. Barrero, and David Camacho. "A genetic graph-based approach for partitional clustering." International journal of neural systems 24.03 (2014): 1430008.
[13] Zhang, Hao, et al. "A Novel Clustering Algorithm on Large-Scale Graph Data."Cloud Computing and Big Data (CCBD), 2014 International Conference on. IEEE, 2014.
[14] Dong, Xiaowen, et al. "Clustering on multi-layer graphs via subspace analysis on grassmann manifolds." Signal Processing, IEEE Transactions on 62.4 (2014): 905-918.
[18] Hadjighasem, Alireza, et al. "A Spectral Clustering Approach to Lagrangian Vortex Detection." arXiv preprint arXiv:1506.02258 (2015). [19]R Forsati, AKeikha, M Shamsfard -Neurocomputing, 2015 – Elsevier Forsati, Rana, Andisheh Keikha, and Mehrnoush Shamsfard."An improved bee colony optimization algorithm with an application to document clustering."Neuro-computing 159 (2015): 9-26.
[20] DG Ferrari, LN de Castro - Information Sciences, 2015–ElsevierFerrari, Daniel Gomes, and Leandro Nunes de Castro."Clustering algorithm selection by meta-learning systems: A new distance-based problem characterization and ranking combination methods." Information Sciences 301 (2015): 181-194.