Effects of Rating Scale Direction Under
the Condition of Different Reading
Direction
Dagmar Krebs
1& Yaacov G. Bachner
2 1Justus Liebig University, Giessen, Germany,
2
Ben-Gurion University of the Negev, Beer-Sheva, Israel
Abstract
Because response scales serve as orientation for respondents when mapping their answers to response categories, it can be expected that the decremental (from positive to negative) or incremental (from negative to positive) order of a response scale provides information that influences response behavior. If respondents interpret the first category on a scale as signifying “most accepted,” then starting an agree/disagree scale with “agree completely” or “disagree completely” may result in their forming different subjective hypotheses about the “most acceptable” response. If this principle applies in general, respondents’ reactions to horizontal response scales with different orders of response categories should be similar in the two directions of reading – right to left or left to right. This paper tests two hypoth-eses: first, that decremental scales elicit more positive responses than incremental scales; second, that this pattern holds under the condition of different reading direction. These hypotheses were tested using a German and an Israeli student sample. Seven-point decre-mental and incredecre-mental scales were applied in each sample; only the scale endpoints were verbally labeled. The questions asked related to extrinsic and intrinsic job motivation and achievement motivation. For data collection, a split-ballot design with random assignment of respondents to decremental and incremental scales was applied in both samples. Results revealed that response-order effects occur similarly in the right-to-left and the left-to-right reading direction.
Keywords: response-order effect; scale direction; reading direction; primacy and recency effect; satisficing
Direct correspondence to
Dagmar Krebs, Justus Liebig University, Giessen, Germany E-mail: [email protected]
Introduction
In this article, we investigate whether response-order effects occur similarly in dif-ferent reading directions (i.e., right to left vs. left to right). For this comparison, we conducted an experiment in Israel and Germany using rating scales. As response-order effects, we investigated the effects of scale direction on response behavior by applying a decremental (i.e., from positive to negative) and an incremental (i.e., from negative to positive) response scale.
Since the beginning of attitude measurement, social scientists have defined attitudes as evaluations expressing the degree of favorableness toward an attitude object. Therefore, attitude measurement relies on responses expressing this degree of favorableness on a continuum extending from favor to disfavor, agree to dis-agree, etc. The use of rating scales in social science surveys has a decades-long tradition. Information retrieved from scale handbooks (Bruner, 2013; Fowler, 1995; Robinson, Shaver and Wrightsman, 1999) shows that over 90 per cent of attitude measurement used the rating scale technique developed by Likert (1932). This technique originally applied a five-point, fully labeled scale offering response cat-egories on an approve/disapprove continuum with a neutral midpoint (i.e., strongly approve, approve, undecided, disapprove, strongly disapprove). Since these early days, a vast amount of methodological research has investigated the effects of dif-ferent response-scale attributes on response behavior.
over-view of 603 scales used in questionnaires revealed that 55% used a 7-point scale and 30% used a 5-point scale (Weijters, Cabooter, & Schilleweart, 2010). When it comes to the complexity of scales with seven compared to five response categories, there is consensus within the scientific (survey methodology) community that high-educated respondents can handle more differentiated scales, but that 5-point scales should be used in general population surveys (Weijters, et al. 2010). Therefore, as we were using student samples, we decided to employ a 7-point scale in our experi-mental study.
Empirical research on completely or partially labeled response scales has been published by Krosnick (1999); Krosnick and Fabrigar (1997); Krosnick and Presser, 2010; Tourangeau, Rips, and Raisinski (2000); and Weng (2004). Krosnick and Fabrigar (1997) and Menold and Bogner (2014) expressed a preference for com-pletely labeled scales, arguing that verbal labels offered greater clarity of response alternatives, especially for respondents with a low level of education. However, the authors admitted that a 7-point scale with refined verbal labels for each response category could be more demanding than a 7-point scale with verbal labels only at the endpoints. Formulating (seven) verbal labels is difficult enough in one language. However, it is even more challenging when, as in our study, two languages are used (i.e., Hebrew and German). According to Fowler and Cosenza (2008), num-bers between the verbally labeled endpoints translate much better across languages than do adjectives. We therefore decided to employ 7-point scales with verbal labels at the endpoints and numbers in between.
Regarding scale polarity, we refer to the findings of Schwarz, Knäuper, Hip-pler, Noelle-Neumann, and Clark (1991), who compared two sets of a 10-point rat-ing scale with bipolar verbal endpoints. One set contained numerical values from -5 to +5, whereas values of the other set ranged from 0 to 10. Regardless of the scale labels, responses piled up in the positive half of the scale. Apparently, the negative numbers changed the meaning of the verbal labels, thereby suggesting that respon-dents interpreted the endpoints not as logical complements but as polar opposites (success/no success vs. success/failure). To avoid this unintended effect, there is a tendency in the literature to use unipolar scales (Schaeffer & Presser, 2003). Accordingly, the endpoint-labeled, 7-point scale used in this study is unipolar.
might be due to the (comparatively) small response-order effects in rating scales. The decision whether a response scale should start with the positive or the negative response category seems to be largely up to the individual researcher. This circum-stance applies within the left-to-right reading direction. However, little to nothing is known about response-order effects in another reading direction, namely right to left. Although Rayner (1998) mentioned the possibility that writing/reading direc-tion influences response behavior, there has been no systematic research on the occurrence of response-order effects in the right-to-left versus the left-to-right read-ing/writing direction. This lack of research prompted us to conduct an experiment on response-order effects with Israeli (reading right to left) and German (reading left to right) respondents using a decremental scale (from positive to negative) and an incremental scale (from negative to positive). Both scales were 7-point, endpoint labeled, and unipolar.
Theoretical Background and State of Research
The existence of response-order effects has been known since the beginning of survey methodology in the 1920s (Mathews, 1929) and has been shown in many empirical studies (e.g., Bishop & Smith, 2001; Malhotra, 2008; Yan & Keusch, 2015). As Krosnick and Alwin (1987) demonstrated, the shape of these response-order effects depends to a large extent on presentation mode – auditory or visual. Whereas the auditory mode promotes recency effects (i.e., endorsement of response alternatives appearing late on a list or a response scale), visual presentation pro-motes primacy effects (i.e., endorsement of alternatives appearing early on a list or a response scale). Although it was well-known for years that the order in which response alternatives are presented to respondents can significantly alter the results and conclusions of public opinion polls (Bishop & Smith, 2001, p. 479), a theo-retical explanation for this phenomenon was lacking. As recently as the 1980s, two complementary explanations were offered: satisficing theory, proposed by Krosnick and Alwin (1987) and Krosnick (1991), and cognitive elaboration theory, proposed by Sudman, Bradburn, and Schwarz (1996). Both theories explain the occurrence of primacy effects by deeper cognitive processing of response alternatives presented earlier rather than later in a list. And both theories also emphasize mode differences and expect primacy effects in the case of visual presentation and recency effects in the case of auditory presentation. Furthermore, empirical evidence generally shows smaller effects for rating scales than for categorical scales (Sudman et al., 1996).an optimal solution. This approach, known as “bounded rationality” or “satisfic-ing” (Simon, 1959), explains response-order effects as a strategy to minimize cog-nitive effort, which, following Krosnick (1991), results in a primacy effect in visual presentations. Accordingly, the primacy effect occurs either because respondents select the first acceptable response category, thereby inhibiting consideration of later ones, or because they are not capable of processing all the response categories equally, thereby leading to preferential selection of the initial ones. With respect to response-order effects, Krosnick (1992) and Krosnick, Narayan, and Smith, (1996) describe this response behavior as “weak satisficing” that leads respondents to select the first acceptable response alternative on a response scale.
Cognitive elaboration theory, by contrast, is based on cognitive processes similar to those that occur in persuasive communication. Hence, one can conceive of the “measurement unit” comprising a question and a response scale as a short persuasive argument that elicits positive or negative cognitive responses (Sudman, Bradburn, & Schwarz, 1996). From this perspective, if recipients develop positive associations with the “message,” then positive attitude change will occur. How-ever, if recipients develop negative associations with the “message,” they will back away from it. Transferred to response scales, this principle implies that a “mea-surement unit” that offers positive response alternatives first (e.g., in a decremental scale) draws respondents toward a positive response, whereas a “measurement unit” that offers negative response alternatives first (e.g., in an incremental scale) draws respondents away from the negative response. Based on this consideration and the postulate that, in visual presentation, it is easier to cognitively elaborate response categories at the beginning of a list than categories appearing later, cognitive elabo-ration theory can predict a primacy effect for decremental scales and a recency effect for incremental scales.
To sum up: Whereas satisficing theory can explain the occurrence of a pri-macy effect, cognitive elaboration theory can explain, in addition, a recency effect for incremental response scales. Therefore, in combination, these two theories enable us to formulate differentiated expectations for effects associated with decre-mental and incredecre-mental response scales.
Studies investigating the effects of response order (Krebs & Hoffmeyer-Zlot-nik, 2010; Krebs, 2012; Krosnick & Alwin, 1987; Krosnick, 1991) have shown that response-order effects are observable for different content areas and different samples. However, effects of response order are chronically small, especially when the response scale is presented horizontally (Höhne & Lenzner, 2015; Menold & Bogner, 2014).
be replicable in a different cultural context with a right-to-left reading direction. Therefore, we investigate the effect of scale direction within the right-to-left and the left-to-right reading direction by comparing responses on decremental and incre-mental scales in an Israeli and a German group of respondents.
Hypotheses
As a global hypothesis, we postulate that response-order effects occur due to scale direction, and that these effects are similarly observable in the right-to-left and the left-to-right reading directions.
We derive our hypotheses on response-order effects from satisficing theory and cognitive elaboration theory. Both theories predict primacy effects for response alternatives that appear first on a scale. However, cognitive elaboration theory pre-dicts that this primacy effect will occur primarily on decremental scales. There-fore, we expect higher proportions of responses at the beginning of decremental response scales than at the beginning of incremental response scales (hypothesis 1).
According to satisficing theory, one would expect a primacy effect also in the case of an incremental response scale. However, based on persuasive-com-munication reasoning, cognitive elaboration theory predicts that a recency effect for incremental scales is more likely than a primacy effect, because the negative response alternatives, although presented early on the response scale, elicit nega-tive cogninega-tive associations and are therefore less likely to receive endorsement. Taking into account (a) “positivity bias” (Tourangeau, Rips, & Raisinski, 2000), which describes respondents’ preference for positive answers, and (b) satisficing theory, which implies that respondents engage in “weak satisficing” by looking for the first acceptable response alternative on a response scale, piling of responses on incremental scales is likely to occur on the middle to positive response alterna-tives. Therefore, compared to decremental response scales, in the case of incremen-tal scales we expect higher proportions of responses near the middle of the scale (hypothesis 2).
Methods
Survey Questions
To study response-order effects in different reading directions, we adapted 12 items from the Cross Cultural Survey for Work and Gender Attitudes 1991-2010 (Frieze, 2010) and the German General Social Survey (ALLBUS) 2006. This approach has the advantage of using repeatedly tested questions. Four of these questions refer to extrinsic job motivation, four to intrinsic job motivation, and four to achievement motivation.
Extrinsic job motivation refers to the importance of anticipated job character-istics (e.g., income and career prospects) that are not primarily under an individu-al’s control. Intrinsic job motivation refers to job commitment (e.g., autonomy and responsibility). Achievement motivation refers to “competitiveness,” and implies a preference for interpersonal challenges. Whereas intrinsic job motivation and achievement motivation describe attitudes toward a job or toward possible competi-tors, extrinsic job motivation describes requirements that job characteristics should meet (Krebs, Berger, & Ferligoj, 2000; Spence & Helmreich, 1983).
The decision to use motivational questions for this study is based on the authors’ experience of (nearly) identical results: Achievement motivation, intrinsic job motivation, and extrinsic job motivation proved to be stable across different student cohorts and over time. The motivational questions in the questionnaire were followed by several questions on political and societal issues (which are not the subject of this paper).
All questions were presented in grids1 with a unipolar 7-point response scale with numeric values between the verbal endpoints (see Appendix for the questions used). Achievement motivation was measured on a scale similar to an agree/dis-agree response scale, whereas (extrinsic and intrinsic) job motivation was assessed on an importance scale. Accordingly, the verbal endpoints on the decremental scales were (a) applies to me completely (=1) and does not apply to me at all (=7)
and (b) very important (=1) and not important at all (= 7).2 On the incremental scales, the endpoints were labeled inversely. Response scales were presented hori-zontally next to the items and either on the right side (German) or on the left side (Hebrew), depending on the reading direction. Whereas the Cross Cultural Survey for Work and Gender Attitudes 1991–2010 (Frieze, 2010) used 5-point scales, ALL-BUS 2006 used 7-point scales. As we were using student samples, and as high-educated respondents can handle more differentiated scales, we decided to employ 7-point scales.
Data Collection
The study took place in spring and early summer 2008 at the Justus-Liebig-Univer-sity in Giessen, Germany and Ben-Gurion UniverJustus-Liebig-Univer-sity of the Negev, in Beer-Sheva, Israel. It was designed as a split-ballot experiment. Respondents were students from the pedagogical or public health department, who were not familiar with social sci-ence methodology. Questionnaires were distributed and completed during lectures. To ensure randomization of split versions (decremental vs. incremental scale), ques-tionnaires were sorted systematically before distribution. All students in the lecture hall were invited to participate, and received and completed the questionnaire. Stu-dents were informed that they were participating in a study on the quality of survey questions; confidentiality was assured.
Items and item sequence were identical in the two split versions. Only the direction of response scales in the splits varied. The questionnaire took about 10 minutes to complete, and questionnaires were collected immediately after comple-tion.
In all, we obtained 175 completed questionnaires in Israel and 250 in Ger-many. In Germany, the questionnaire with the decremental scales was completed by 115 respondents (78% female), and the questionnaire with the incremental scales was completed by 105 respondents (75% female); 30 respondents did not answer the gender question. In Israel, the questionnaire with the decremental scales was completed by 62 persons (68% female); 113 persons (74% female) completed the questionnaire with the incremental scales.
Data Analyses
Because we were interested in response-order effects associated with decremen-tal and incremendecremen-tal scales in the left-to-right (German group) and the right-to-left (Israeli group) reading directions, we conducted the analyses for each group separately. Comparing results from response scales with different directions is not possible without assessing the measurement equivalence of the two scales. To ensure measurement equivalence, we followed four steps of hierarchical modeling (Revilla, 2013): First, a confirmatory factor analysis (CFA) model was specified separately for the decremental and the incremental scales in the German and the Israeli group. Second, the CFA was conducted simultaneously to test for configural invariance of the decremental and the incremental scales within each group. In the third and fourth steps, respectively, metric invariance was tested by restricting the factor loadings to equality, and scalar invariance was tested by additionally restrict-ing the intercepts to equality. A meanrestrict-ingful comparison of latent means is possible only if scalar invariance holds. Because all indicators were measured on a 7-point scale, we assumed continuous scale level. For all analyses, we used Mplus version 6.12 (Muthén & Muthén, 1998-2010) and applied the MLM discrepancy function, thereby allowing for non-normality of distributions (Byrne, 2012).
However, before comparing the latent means of achievement motivation, intrinsic job motivation, and extrinsic job motivation, we inspected the empirical distribution parameters and the proportions of positive and negative responses on the decremental and incremental scales.
Results
To ensure unequivocal statistical analyses, all values were coded from 1 (positive) to 7 (negative). First, we inspected the parameters of the empirical distributions for all indicators. Then we tested for measurement equivalence between decremental and incremental scales within the right-to-left and the left-to-right reading direc-tions. Next, we compared proportions of the empirical referents (unweighted sum scores) of achievement motivation, intrinsic and extrinsic job motivation within each reading direction. And finally, we compared the latent means of the three motivational constructs.
Descriptive Statistics
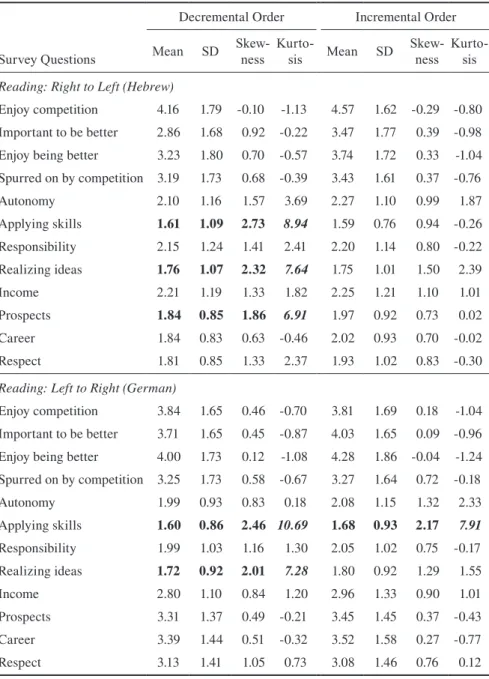
Table 1 Means, standard deviations, skewness, and kurtosis for decremental and incremental scale directions within the right-to-left (Hebrew) and the left-to-right (German) reading directions
Decremental Order Incremental Order
Survey Questions Mean SD Skew-ness Kurto-sis Mean SD Skew-ness Kurto-sis
Reading: Right to Left (Hebrew)
Enjoy competition 4.16 1.79 -0.10 -1.13 4.57 1.62 -0.29 -0.80 Important to be better 2.86 1.68 0.92 -0.22 3.47 1.77 0.39 -0.98 Enjoy being better 3.23 1.80 0.70 -0.57 3.74 1.72 0.33 -1.04 Spurred on by competition 3.19 1.73 0.68 -0.39 3.43 1.61 0.37 -0.76
Autonomy 2.10 1.16 1.57 3.69 2.27 1.10 0.99 1.87
Applying skills 1.61 1.09 2.73 8.94 1.59 0.76 0.94 -0.26 Responsibility 2.15 1.24 1.41 2.41 2.20 1.14 0.80 -0.22 Realizing ideas 1.76 1.07 2.32 7.64 1.75 1.01 1.50 2.39
Income 2.21 1.19 1.33 1.82 2.25 1.21 1.10 1.01
Prospects 1.84 0.85 1.86 6.91 1.97 0.92 0.73 0.02
Career 1.84 0.83 0.63 -0.46 2.02 0.93 0.70 -0.02
Respect 1.81 0.85 1.33 2.37 1.93 1.02 0.83 -0.30
Reading: Left to Right (German)
Enjoy competition 3.84 1.65 0.46 -0.70 3.81 1.69 0.18 -1.04 Important to be better 3.71 1.65 0.45 -0.87 4.03 1.65 0.09 -0.96 Enjoy being better 4.00 1.73 0.12 -1.08 4.28 1.86 -0.04 -1.24 Spurred on by competition 3.25 1.73 0.58 -0.67 3.27 1.64 0.72 -0.18
Autonomy 1.99 0.93 0.83 0.18 2.08 1.15 1.32 2.33
Applying skills 1.60 0.86 2.46 10.69 1.68 0.93 2.17 7.91
Responsibility 1.99 1.03 1.16 1.30 2.05 1.02 0.75 -0.17 Realizing ideas 1.72 0.92 2.01 7.28 1.80 0.92 1.29 1.55
Income 2.80 1.10 0.84 1.20 2.96 1.33 0.90 1.01
Prospects 3.31 1.37 0.49 -0.21 3.45 1.45 0.37 -0.43
Career 3.39 1.44 0.51 -0.32 3.52 1.58 0.27 -0.77
Respect 3.13 1.41 1.05 0.73 3.08 1.46 0.76 0.12
ideas). These extremes occurred in both groups, their exclusion would have con-siderably minimized the number of indicators for intrinsic job motivation, and the MLM discrepancy function took non-normality into account. Therefore, to ensure comparability, all variables were retained in the analyses for both groups.
Inspecting the item means in Table 1 more closely reveals higher values on the incremental scales than on the decremental scales. According to the coding from 1 (positive) to 7 (negative), this indicates that responses in both reading directions are slightly but systematically more negative on the incremental scales. This similarity of distributions corresponds to our global hypothesis that direction effects are the same in the right-to-left (Hebrew) and left-to-right (German) reading directions.
Although comparing proportions (as described in hypotheses 1 and 2) would belong in the present section, we prefer first to ensure measurement equivalence of the decremental and incremental scales within each reading direction, and to post-pone comparisons between scale directions.
Measurement Equivalence
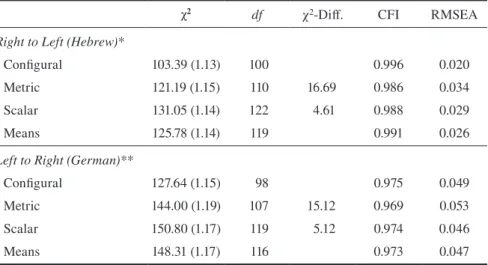
group. Table 2 shows the results. According to Byrne (2012) and Revilla (2013), the decision of invariance can be based on the difference in CFI and RMSEA values between the configural, metric, and scalar invariance models. With respect to this criterion, a change in CFIs greater than 0.01 accompanied by a change in RMSEA greater than 0.015 would be indicative of non-equivalence. As can be seen from Table 2, differences in the CFI and RMSEA values between the configural, met-ric, and scalar invariance models meet this criterion: The largest difference for the CFIs is 0.01 and for the RMSEAs is 0.014 Additionally, chi-square differences are not significant. Therefore, because scalar invariance for the decremental and incre-mental scales is supported by the data within the German and the Israeli groups, measurement invariance can be accepted, and comparison of latent means based on scale directions is possible. The last row of Table 2 refers to the global fit statistics for the model comparing latent means described in section Comparison of Latent Means.
First, however, we compare proportions of negative and positive answers in the two scale directions.
Table 2 Testing measurement equivalence of decremental and incremental res-ponse order in the right-to-left (Hebrew) and the left-to-right (German) reading directions for the model containing three latent variables with four indicators each
χ2 df χ2-Diff. CFI RMSEA
Right to Left (Hebrew)*
Configural 103.39 (1.13) 100 0.996 0.020
Metric 121.19 (1.15) 110 16.69 0.986 0.034
Scalar 131.05 (1.14) 122 4.61 0.988 0.029
Means 125.78 (1.14) 119 0.991 0.026
Left to Right (German)**
Configural 127.64 (1.15) 98 0.975 0.049
Metric 144.00 (1.19) 107 15.12 0.969 0.053
Scalar 150.80 (1.17) 119 5.12 0.974 0.046
Means 148.31 (1.17) 116 0.973 0.047
Comparison of Proportions
For the comparison of proportions, we calculated unweighted sum scores for achievement motivation, intrinsic job motivation and extrinsic job motivation. These sum scores (divided by the number of items constituting the sum) are grouped into three blocks referring to positive (response categories 1 and 2), middle (response categories 3, 4, and 5), and negative answers (response categories 6 and 7). For easier reading, the ratios of response proportions in these three blocks on decremental versus incremental scales are computed; they give an impression of how respondents reacted to different scale directions. Distributions of responses on decremental and incremental scales are very similar within the left-to-right (Ger-man) and the right-to-left (Hebrew) reading directions as revealed by the results of a chi-square test. Hypotheses 1 and 2 were tested by means of Fisher’s exact test. Results are presented in Table 3, and all values are coded in the 1 (positive) and 7 (negative) direction.
Table 3 Proportions of positive, middle, and negative responses for achieve-ment motivation, intrinsic job motivation and extrinsic job motivati-on (unweighted sum scores) motivati-on decremental and incremental scales within the right-to-left (Hebrew) and the left-to-right (German) rea-ding directions
Reading Right to Left
(Hebrew) Reading Left to Right (German)
decre-mental mental incre-ratio decr.:
incr.
decre-mental mental incre-ratio decr.:
incr.
Achievement % % % % % %
Applies to me completely 3 5
29:15 2 3 17:15
2 26 10 15 12
3 21 26
63:69 33 19 69:75
4 31 27 19 32
5 11 16 17 24
6 5 12
8:17 9 8 15:11
Does not apply to me at all 3 5 6 3
χ2(6)=10.62, n.s. χ2(6)=13.38, p=0.04
Intrinsic
Very important 31 29
81:76 34 30 85:78
2 50 47 49 48
3 13 19
18:25 15 16 18:21
4 5 4 2 5
5 0 2 1 0
6 0 0
2:0 0 0 1:1
Not important at all 2 0 1 1
χ2(5)=3.98, n.s. χ2(5)=3.61; n.s.
Extrinsic
Very important 32 28
79:78 4 3 27:22
2 47 50 23 19
3 16 25
21:33 33 36 69:74
4 5 7 29 28
5 0 1 7 10
6 0 0
0:0 4 3 5:5
Not important at all 0 0 1 2
χ2(4)=2.50, n.s. χ2(6)=2.13, n.s.
n 62 113 130 120
proportions show a systematic tendency in the postulated direction they tend to support both hypothesis 1 (primacy effect on decremental scales), and hypothesis 2 (recency effect on incremental scales). The most important of these observations is that the postulated differences between scale directions are the same in the Hebrew and the German reading directions, although they are somewhat more pronounced in the former than in the latter.
Comparison of Latent Means
Based on cognitive elaboration theory, we expected differences in means between the incremental and the decremental scales. According to the coding of values, we postulated higher means (i.e., more negative responses) for the incremental scales (hypothesis 3). As already mentioned, the comparison between means of the latent variables achievement motivation, intrinsic job motivation, and extrinsic job moti-vation assessed by different scale directions was conducted within the German and the Israeli groups. The fact that we used partially different models in the German and the Israeli groups is of minor relevance here because the models for testing the effect of scale direction are equivalent within each group. Measurement equiva-lence within each group was supported by the data, and differences in latent means express the response-order effect due to decremental and incremental scale tion within the right-to-left (Hebrew) and the left-to-right (German) reading direc-tions.
For the comparison of latent means, we used the incremental scale as a ref-erence group. Table 4 shows that, with one exception, latent means do not differ significantly between scale directions, and that this result holds for the right-to-left (Hebrew) and the right-to-left-to-right (German) reading directions. The exception is achievement motivation, where a significant difference between scale directions occurs in the case of the Israeli group. The negative signs for all comparisons reveal the same pattern as that already observed for the proportions: Compared to incre-mental scales, decreincre-mental scales elicited more positive responses. Once again, results are in the postulated direction, but they are mostly not significant. However, because these results are in line with the literature according to which response-order effects on horizontal rating scales are chronically small, we interpret these systematically occurring differences as support for hypothesis 3.
Summary and Discussion
response-order effects elicited by scale direction within the right-to-left (Hebrew) and the left-to-right (German) reading directions reveal first and foremost the existence of response-order effects within both reading directions. These effects are of compa-rable size.
However, the postulated response-order effects are significant only for achieve-ment motivation, which refers to individual self-descriptions and is measured using a question format that is structurally equivalent to an agree/disagree scale. Empirical evidence reveals that these scales are especially susceptible to response-order effects (Liu, Lee, & Conrad, 2015). By contrast, extrinsic and intrinsic job motivation were assessed on a scale that measured the importance ascribed to job characteristics. Because the latter method (known as item-specific question for-mat) implies a more direct manner of question asking (Höhne & Krebs, 2017), it is less susceptible to response-order effects (Saris, Revilla, Krosnick, & Schaeffer, 2010). Hence, the results of the present study add to these findings by revealing that response-order effects that occur in different question formats in the left-to-right (German) reading direction occur similarly in the right-to-left (Hebrew) reading direction.
Table 4 Latent mean differences between incremental and decremental re-sponse scales within the right-to-left (Hebrew) and the left-to-right (German) reading directions
Est. S.E. C.R. p-value
Reading: Right to Left (Hebrew)*
Achievement motivation -0.413 0.174 -2.383 0.017
Job motivation (intrinsic) -0.021 0.106 -0.193 0.847 Job motivation (extrinsic) -0.167 0.157 -1.061 0.289
Reading: Left to Right (German)**
Achievement motivation -0.163 0.110 -1.484 0.138
Job motivation (intrinsic) -0.081 0.099 -0.818 0.413 Job motivation (extrinsic) -0.106 0.127 -0.813 0.406
Notes: * Model with one cross-loading. ** Model with two residual covariances.
The differing results with regard to response-order effects for achievement motivation and (extrinsic and intrinsic) job motivation may be due to the specific content of the motivational dimensions. This is especially true for extrinsic job motivation, where indicators address commonly desirable job characteristics such as income and career prospects. Empirical evidence for the apparent immunity of extrinsic job motivation to response-order effects was found by Krebs and Hoff-meyer-Zlotnik (2010). Their interpretation is strongly related to the “hierarchy of importance” described by Toepoel and Dillman (2011), whereby question content takes precedence over scale direction and question format. This implies that a ques-tion’s content might not be susceptible to response-order effects, irrespective of scale direction and question format. However, this is merely an attempt at an expla-nation, and it lacks empirical evidence. Furthermore, according to empirical find-ings regarding intrinsic job motivation, this hierarchy does not apply. Therefore, to learn more about the relation between question content and question format and/or scale direction, we hope that future research will investigate the hierarchical order between question content and different question design strategies. This is especially desirable because the results of the present study reveal that the postulated “hierar-chy of importance” seems to exist in the same manner for the left-to-right (German) and the right-to-left (Hebrew) reading directions.
A further promising result of this study is that measurement equivalence was established for decremental and incremental response scales in both reading direc-tions. This finding contributes to knowledge about scale construction in cross-cul-tural comparison. Especially with respect to this circumstance, further research with different question content would be desirable and necessary.
This study has two limitations. First, our results are based on students’ responses, and we therefore have a relatively unique sample. However, this does not fundamentally limit the validity of the empirical findings. The students partici-pated voluntarily and without incentives. Regarding respondents’ educational level, the hypotheses were tested under strict conditions. In a general population study with respondents of different ages and educational levels, one could expect that the observed differences between decremental and incremental scales would be more pronounced.
& Lenzner, 2015). Therefore, the investigation of the size of response-order effects in vertical scales in different reading directions would be an appealing topic for further research.
Irrespective of these limitations, this study contributes to existing research and theory by corroborating empirical findings and theoretical reasoning. The sim-ilarity of response-order effects in the right-to-left (Hebrew) and the left-to-right (German) reading directions points to the importance of scale direction effects across cultural contexts. The results imply that response-order effects postulated for the left-to-right reading direction are replicated in the right-to-left (Hebrew) read-ing direction. Considerread-ing the differentiation between lack of generalizability (stu-dent sample) and failure of replication, our study contributes to this methodological aspect of cross-cultural survey research by showing that response-order effects can be replicated in a different (right-to-left) reading direction.
References
Alwin, D. F. (1997). Feeling thermometers versus 7-point scales: Which are better? Sociolo-gical Methods and Research, 25, 381-341.
Alwin, D. F. (2007). Margins of Error. A Study of Reliability in Survey Measurement. Ho-boken, NJ: Wiley & Sons.
Bishop, G. and Smith, A. (2001). Response-order effects and the early Gallup split-ballots.
Public Opinion Quarterly, 65(4), 479-505.
Bruner II, G.C. (2013). Marketing Scales Handbook: The Top 20 Multi-Item Measures Uses in Consumer Research. Fort Worth, Texas: GCBII Productions.
Byrne, B.M. (2012). Structural Equation Modeling with Mplus. Basic Concepts, Applica-tions and Programming. New York, NY: Routledge.
Fowler, F. (1995). Improving Survey Questions. Design and Evaluation. Thousand Oaks; CA: Sage.
Fowler, F. Jr., & Cosenza, C. (2008). Writing Effective Questions. In: de Leeuw, E. D.; Hox, J. J. and Dillman, D. A. (Eds.), International Handbook of Survey Methodology, 136-160. New York: Lawrence Erlbaum Associates.
Frieze, I. H. (2010 ) Cross Cultural Survey of Work and Gender Attitudes1991-2010. Re-trieved from https://sites.google.com/site/friezewebsite/cross-cultural-survey-of-work-and-gender-attitudes
Höhne, J.K., & Lenzner, T. (2015). Investigating response order effects in web surveys using eye tracking. Psihologia, 48(4), 361-377.
Höhne, J. K., & Krebs, D. (2017). Scale direction effects in agree/disagree and item-specific questions: A comparison of question formats. International Journal of Social Research Methodology. Published online on May 8, 2017. doi: 10.1080/13645579.2017.1325566 Kieruj, N. D., & Moors, G. (2010). Variations in Response Style Behavior By Response
Krebs, D., Berger, M., & Ferligoj, A. (2000). Approaching achievement motivation. Compa-ring factor analysis and cluster analysis. New Approaches in Statistical Applications: Metodoloski Zvezki, 16, 147–171.
Krebs, D., & Hoffmeyer-Zlotnik, J. H. (2010). Positive first or negative first? Effects of the order of answering categories on response behavior. Methodology: European Journal of Research Methods for the Behavioral and Social Sciences, 6, 118–127.
Krebs, D. (2012). The impact of response format on attitude measurement. In S. Salzborn, E. Davidov, & J. Reinecke (Eds.), Methods, theories, and empirical applications in the social sciences. Festschrift for Peter Schmidt (pp. 105–113). Wiesbaden: Springer VS. Krosnick, J. A. (1991). Response strategies for coping with the cognitive demands of attitude
measurement in surveys. Applied Cognitive Psychology, 5, 213–236.
Krosnick, J. A. (1999). Survey research. American Review of Psychology, 50, 537–567. Krosnick, J. A., & Alwin, D. F. (1987). An evaluation of a cognitive theory of
response-order effects in survey measurement. Public Opinion Quarterly, 51, 201–219.
Krosnick, J.A., & Fabrigar, L. R. (1997). Designing rating scales for effective measurement in surveys. In L. Lyberg, P. Biemer, M. Collins, E. de Leeuw, C. Dippo, N. Schwarz, & D. Trewin, (Eds.), Survey measurement and process quality (141–164). New York: Wiley.
Krosnick, J. A.; Narayan, S., & Smith, W. R. (1996). Satisficing in surveys: Initial evidence. In M. T. Braverman and J. K. Slater (Eds.), Advances in Survey Research (29–44). San Francisco: Jossey-Bass.
Krosnick, J. A., & Presser, S. (2010). Question and questionnaire design. In: P. V. Marsden and J. D. Wright (Eds.). Handbook of survey research, 2nd ed. (263–312.). Bingley: Emerald Group Publishing Limited.
Likert, R. (1932). A technique for the measurement of attitudes. Archives of Psychology, 140, 5–53.
Liu, M., Lee, S., & Conrad, F.G. (2015). Comparing extreme response styles between agree-disagree and item-specific scales. Public Opinion Quarterly, 79, 952–975.
Malhotra, N. (2008). Completion Time and Response Order Effects in Web Surveys. Public Opinion Quarterly, 72, 914–934.
Mathews, C.O. (1929). The effect of the order of printed response words on an interest ques-tionnaire. Journal of Educational Psychology, 30, 128–134.
Miller, G.A. (1956). The magical number seven, plus or minus two: Some limits on our ca-pacity for processing information. The Psychological Review.63, 81–97.
Menold, N., & Bogner, K. (2014). Gestaltung von Ratingskalen in Fragebögen. SDM Survey Guidelines. GESIS. Mannheim.
Muthén, L. K., & Muthén, B. O. (1998–2010). Mplus user’s guide. 6th ed. Los Angeles, CA: Muthén and Muthén.
Preston, C. C., & Colman, A. M. (2000). Optimal number of response categories in rating scales: Reliability, validity, discriminating power, and respondent preferences. Acta Psychologica, 104,1–15.
Rayner, K. (1998). Eye movements in reading and information processing: 20 years of re-search. Psychological Bulletin, 124, 372–422.
Revilla, M. A. 2013. Measurement invariance and quality of composite scores in a face-to-face and a web survey. Survey Research Methods, 7(1), 17–28.
Robinson, J. P., Shaver, P. R., & Wrightsman L. S. (Eds.). (1999). Measures of political atti-tudes. Vol. 2 of Measures of social psychological attitudes series. San Diego, London: Academic Press.
Saris, W. E., & Gallhofer, I. N. (2014). Design, evaluation, and analysis of questionnaires for survey research. Hoboken, NJ: Wiley & Sons.
Saris, W.E.; Revilla, M.; Krosnick, J.A., & Schaeffer, E.M. (2010). Comparing questions with agree/disagree response options to questions with item-specific response options.
Survey Research Methods, 4 (1), 51–79.
Schwarz, N.; Hippler, H. J., & Noelle-Neumann, E. (1992). A cognitive model of response-order effects in survey measurement. In N. Schwarz and S. Sudman (Eds.), Context effects in social and psychological measurement. (187–201). New York: Springer. Schwarz, N.; Knäuper, B.; Hippler, H. J., Noelle-Neumann, E., & Clark, L. (1991). Rating
scales: Numeric values may change the meaning of scale labels. Public Opinion Quar-terly, 55(4), (570–582).
Simon, H. A. (1959).Theories of decision making in economics and behavioural science.
American Economic Review, 49(3), 253–283.
Spence, J.T., & Helmreich, R.L. (1983). Achievement-related motives and behavior. In J.T. Spence (Ed.), Achievement and Achievement Motives: Psychological and Sociological Approaches (pp. 10–74). San Francisco, CA: Freeman.
Sudman, S., Bradburn, N. M., & Schwarz, N. (1996). Thinking about answers. The appli-cation of cognitive processes to survey methodology. San Francisco, CA: Jossey-Bass Publishers.
Toepoel, V., & Dillman, D.A. (2011). Words, numbers, and visual heuristics in web surveys: Is there a hierarchy of importance? Social Science Computer Review, 29 (2), 193-207. First published on May 18, 2010. doi: 10.1177/0894439310370070
Toepoel, V., Das, M., & van Soest, A. (2009). Design of web questionnaires: The effect of layout in rating scales. Journal of Official Statistics, 25, 509–528.
Tourangeau, R., Rips, L. J., & Rasinski, K. (2000). The psychology of survey response.
Cambridge, UK: Cambridge University Press.
Weijters, B. Cabooter, E., & Schillewaert, N. (2010). The effect of rating scale format on response styles: The number of response categories and response category labels. Uni-versity of Gent, Fakulteit Economie En Bedrijfskunde, Working Paper, January 2010. Weng, L.-J. (2004). Impact of the number of response categories and anchor labels on
coef-ficient alpha and test-retest reliability. Educational and Psychological Measurement, 64, 956–972.
Appendix
English translation of the German questions (decremental scale direction).
I enjoy being in competition with other people. (Achievement)
It is important to me to perform better than others on a task. (Achievement) No matter what the activity is, I enjoy being better than others. Achievement) I try harder when I am in competition with other people. (Achievement) Applies to me completely – Does not apply to me at all
How important to you is a job ...
... where you can decide for yourself how the work should be done? (Intrinsic) ... that allows you to use your skills and talents? (Intrinsic)
... where you have responsibility for specific tasks? (Intrinsic)
... that allows you to realize your own ideas? (Intrinsic) ... with a high income? (Extrinsic)
... with good promotion prospects? (Extrinsic) ... with clear career prospects? (Extrinsic)