2019 William & Mary Faculty Survey
Report
An Initiative of the
2019 William & Mary Faculty Survey
March 2020 page 2
TABLE OF CONTENTS
I.
EXECUTIVE SUMMARY ... 3
II.
RESPONSE RATES ... 8
III.
GENERAL SATISFACTION ... 9
IV.
FACULTY RETENTION ... 27
V.
FACULTY EVALUATION ... 29
VI.
RESEARCH & GRANT SUPPORT ... 32
VII. UNIVERSITY GOVERNANCE & ADMINISTRATION ... 34
VIII.
GOALS & MISSION OF THE UNIVERSITY ... 35
IX.
DISCRIMINATION & UNIVERSITY CLIMATE ... 36
X.
BUDGET PRIORITIES ... 42
2019 William & Mary Faculty Survey
March 2020 page 3
I.
EXECUTIVE SUMMARY
Background
The William & Mary Faculty Survey is an on-going initiative of the Faculty Assembly conducted approximately
every three years to assess faculty attitudes, perceptions, and opinions on a wide range of issues. The 2019
version of the survey was developed by the Faculty Affairs Committee of the Faculty Assembly. For questions or
clarification about the analyses contained herein, contact Cathy Forestell at [email protected].
Survey Approach and Overall Response
In 2015, a working group of the Faculty Assembly reduced the length of the faculty survey to increase response
rates and to provide a more succinct and timely report to the faculty. Questions for the 2015 survey were selected
based on their ability to provide 1) timely information about current issues, new policies, or initiatives on campus;
2) unique information that could not be obtained elsewhere; and 3) longitudinal information that, in combination
with information from previous surveys, might help to detect trends in how perceptions and attitudes have
changed over time. Although some additional questions that pertain to satisfaction with the administration, the
degree to which the institution was serving its mission and goals, and campus climate were added to the 2019
survey, many of the questions have been maintained from the 2015 survey. The 2019 survey included a range of
questions that touched on the following themes:
•
Job Satisfaction
– Assessed the degree to which faculty are satisfied with their positions at W&M. The
survey also asked faculty about their satisfaction with 21 aspects of their position that related to teaching,
research, and well-being.
•
Faculty Retention
– Asked whether faculty have considered leaving W&M and if so why.
•
Faculty Evaluation
–Assessed whether faculty felt that they are fairly evaluated during the merit process
and the degree to which performance standards were clear for tenure and promotion.
•
Research & Grant Support
– Asked what type of
grant support faculty have received and their level
of satisfaction with the services provided by various offices across campus that support applications
for and management of these grants.
•
University Governance & Administration
– Assessed faculty satisfaction with the central
administration (i.e., President, VPs, Provost, BOV etc.) over the past academic year.
•
Goals & Mission of the University
– Assessed the degree to which faculty feel that William & Mary is
achieving it mission and goals.
•
Discrimination & University Climate
– Asked about whether faculty have witnessed or experienced
discrimination and how often they assist students who have experienced discrimination or sexual assault?
•
Budget Priorities
– Faculty rated nineteen budget items and indicated which they thought were 1
st, 2
nd, or
3
rdhighest priority.
•
Faculty Comments –
Faculty were invited to elaborate on their responses to items in this survey and to
raise additional issues that were not included in the survey.
The 2019 survey had strong participation with 65% of all faculty responding; a 22% increase from the 2015
survey. Below we provide an overview of findings for each section of the survey.
2019 William & Mary Faculty Survey
March 2020 page 4
Job Satisfaction
Overall, 79% of respondents indicated that they were satisfied with their position at W&M, which was
similar to 2015 (74%), but higher than 2013 (66%). Of note, there appears to be a substantial drop in
rates of dissatisfied faculty members (i.e., 7% drop in TE faculty over 10 years and 20% drop in NTE
faculty over 6 years). While satisfaction was similar across academic rank, across schools and units
there was more variability. The highest satisfaction was reported at VIMS (86%) and the lowest
satisfaction was reported at the Business School (68%). Across schools and academic units, faculty
indicated strong satisfaction for
support for teaching at W&M
,
teaching load
,
wellbeing of the campus
community
, and
faculty collegiality and engagement
. Faculty were also satisfied with their
overall
benefits
, but unsurprisingly, not with the lack of
tuition benefits for dependents
. With the exception of
faculty at VIMS and the Business School, TE and NTE faculty were more dissatisfied than satisfied with
faculty
salaries overall
at W&M. It is important to distinguish this question from
satisfaction with
personal salary,
where responses were mixed.
Faculty Retention
More than 20% of the faculty are actively looking elsewhere for a job and almost half have considered
leaving W&M in the past three years. This is lower than in 2015 when 69% of faculty indicated that they
had considered leaving W&M. The top four reasons for considering leaving W&M were:
dissatisfaction
with salary
(72%),
dissatisfaction with the research support
(38%), and lack of
tuition benefits for
dependents
(28%). In addition, when prompted, 34% of faculty identified the following additional
reasons for why they considered leaving: 1) the lack of leadership from various levels of administration;
2) increased expectations and workload; 3) lack of belonging, equity, and inclusion 4) lack of
institutional support for professional development and growth.
Tuition remission is an ongoing theme throughout this survey as well as a survey conducted by the
Faculty Assembly in the 2017-18 academic year, in which faculty spontaneously raised this issue.
Previous research conducted by working groups on campus have shown that about 80% of our peer
institutions provide some form of tuition remission to faculty. A previous report conducted by the
Faculty Compensation Board, concluded that we are disadvantaged relative to the vast majority of our
peer institutions and have an opportunity to creatively retain our most at-risk faculty and staff along
while attracting new employees that may not consider W&M financially viable. Rough estimations
suggested that full tuition remission would cost approximately $300,000 per year. Today, with our
current tuition rate, this estimation would be approximately $500,000.
Faculty Evaluation
Across A&S, the School of Business, and the School of Education, less than half of the faculty felt that
they were fairly evaluated during the merit process, whereas 25-30% did not. Results were mixed at the
Law School, with 30% indicated that they were fairly evaluated and 30% indicating they were not fairly
evaluated. At VIMS more than two thirds of faculty indicated that they were fairly evaluated during the
merit process. Fewer continuing NTE (39%) than TE (51%) faculty members and fewer women (46%)
than men (57%) perceived that they were fairly evaluated for merit.
2019 William & Mary Faculty Survey
March 2020 page 5
Faculty generally indicated that standards were clear for the tenure and promotion processes. Of note,
73% of Associate professors, who have been through the process recently, indicated that these standards
were clear. The only exception was the School of Business, where only 27% of faculty indicated that the
standards for promotion were clear and 42% indicated that this process was unclear. Similarly, few
continuing NTE faculty (29%) indicated that the performance standards for promotion were clear.
Another aspect of faculty evaluation, student evaluation of teaching, is currently undergoing review by
the Faculty Affairs Subcommittee of the Faculty Assembly. A report outlining their findings and
recommendations should be available in Spring 2020.
Research and Grant Support
Of the 463 faculty who responded to these questions, 272 indicated that they received at least one
external grant and 261 indicated that they had previously received an internal grant over the past three
years. With the exception of VIMS, where approximately half of the faculty indicated they were
satisfied with the support received for
identifying
external grants, satisfaction was low across schools
and academic areas – ranging from 6% satisfied in the School of Education to 33% satisfied in A&S
Area III (Natural Sciences and Mathematics).
Moreover, few faculty were satisfied with the support they received for
applying
for external grants.
With the exception of A&S Area III (48% satisfied), satisfied faculty ranged from 3% in the School of
Business to 32% at VIMS. There are a number of factors that could contribute to these low satisfaction
rates – we believe that it would be in the best interest of the institution to identify and rectify ongoing
issues with this process, given the revenue that external grants provide.
Faculty who had received external grants in the past three years indicated their satisfaction with the
support they received in managing their grants. Again, few faculty appear to be satisfied with the
support they received from the Office of Sponsored Projects (range: 3 - 22% satisfied, with the
exception of A&S Area III where 48% were satisfied), Human Resources (range: 3 - 16% satisfied),
Accounts Payable (range: 9 - 15% satisfied, with the exception of VIMS where 46% were satisfied).
University Governance and Administration
These questions asked about faculty satisfaction with the central administration (i.e., President, VPs,
Provost, BOV etc.) over the past academic year. Responses were fairly consistent compared to responses
in 2015; in both surveys about half of faculty indicated that they were satisfied with the administration,
overall. Of note, compared to the 2015 survey, more NTE faculty indicated that they were satisfied with
the
level of communication with faculty
(24% satisfied in 2015, 48% satisfied in 2019). However, fewer
faculty were satisfied with the
commitment to improving faculty salaries
in 2019 relative to 2015
(overall: 40% satisfied in 2015, 19% satisfied in 2019).
Goals & Mission of the University
Faculty generally agreed that W&M is pursuing its goals and mission, overall. TE faculty were most
satisfied with the institution’s success in
attracting outstanding students
(82%),
attracting faculty who
2019 William & Mary Faculty Survey
March 2020 page 6
value teaching
(78%), and
providing a challenging Liberal Arts & Sciences curriculum that encourages
depth, breadth, and curiosity
(65%). There was less agreement that the professional schools and
graduate programs were
offering high quality programs that were preparing students for intellectual,
professional, and public leadership
(range 41 - 45%). However, this may have been due to the lack of
knowledge about professional programs from the perspective of A&S; approximately 30% of A&S
faculty indicated that they were “Not Sure” about these questions.
Discrimination & University Climate
Over a third of faculty indicated that they witnessed discrimination based on race, gender, or ideology at
least sometimes at William & Mary. Approximately a quarter of minority (i.e., non-White) respondents
indicated that they witnessed discrimination based on race at W&M, and approximately a quarter of
women indicated that they witnessed discrimination based on gender. While about 60% of faculty
indicated they had assisted a student who had experienced discrimination, few indicated that they had
reported incidents of discrimination or counseled a student who had experienced sexual assault.
Overall, more than 75% of faculty members at William & Mary indicated that they never or seldom
experienced discrimination. However, fewer minority (i.e., non-White) respondents indicated that they
never or seldom experienced discrimination (64%). The design of the questions included in this survey
make it difficult to provide further interpretation of these findings. In future surveys, the Faculty
Assembly should further probe the issue of discrimination at William & Mary to identify ongoing issues
within our community.
Budget Priorities
Approximately 45% of faculty indicated that
increasing the number of TE lines
was one of the top three
budget priorities. This was followed by
providing need-based aid to undergraduates
(33%), and
internal
funding for research support
(25%). Of note, 20% of faculty identified
graduate and professional
student stipends
and 18% identified
facilities (building maintenance and renovation)
as budget
priorities.
Faculty Comments
Ninety faculty contributed comments at the end of the survey. Comments centered around six themes:
1.
Diversity and inclusion/campus climate
2.
University governance and administration
3.
Educational quality
4.
Research and grant support
5.
Graduate student support
6.
Faculty salary and support
Interpreting Tables and Figures in this Report
For all questions that assessed faculty satisfaction throughout the 2019 survey, response options were: "Very
Satisfied," "Satisfied," "Neither Satisfied nor Dissatisfied", “Dissatisfied”, and "Very Dissatisfied."
In general, for
the tables and figures, faculty who indicated that they were either “Very Satisfied” or “Satisfied” were combined
to form the category of “Satisfied”, while those who indicated that they were either “Very Dissatisfied” or
2019 William & Mary Faculty Survey
March 2020 page 7
“Dissatisfied” were combined to form the category of “Dissatisfied”. Similarly, for questions that assessed faculty
agreement, those who indicated that they “Strongly Agree” were combined with those who indicate that they
“Agree”, and those who “Strongly Disagree” were combined with those who “Disagree”.
Therefore, it is important to remember that graphs and tables that show low percentages of “Satisfied” and
“Dissatisfied” faculty suggest that many faculty are undecided or do not feel strongly about the issue. One
example of this is the question about level of satisfaction about
Job support for spouses/partners of faculty
members
(Figure 7, on page 13). In general, 50-60% of faculty indicated that they were “Neither Satisfied nor
Dissatisfied” with the level of support for spouses/partners. The same reasoning applies to tables and figures that
assess faculty agreement with various issues.
In tables and figures throughout the survey, responses from faculty in Arts & Sciences are divided into academic
areas: A&S I (Humanities), A&S II (Social Sciences), and A&S III (Natural Sciences and Mathematics). Refer to
the A&S bylaws (Article 1, Section 3)
here
to see which departments are included in each of these academic
areas.
2019 William & Mary Faculty Survey
March 2020 page 8
II.
RESPONSE RATES
0 F1
The 2019 survey was made available to approximately 884 full-time and part-time instructional faculty members
on September 9
th, 2019 and remained open to faculty until October 28
th. A total of 469 William & Mary faculty
(166 females, 199 males, two non-binary, and 102 unspecified gender) responded. Of those who indicated their
race (
N
= 343), 303 were White, 13 were Asian, 11 were Black, nine were Hispanic, and seven were mixed race or
other. Of the 462 respondents who indicated their faculty status (i.e., whether they were tenured/tenure eligible or
non-tenure-eligible), 321 were tenured or tenure-eligible (TE) faculty, and 141 were non-tenure-eligible (NTE)
faculty
1F2
. Table 1 presents the percentage of each unit’s faculty who responded to the survey in 2019 relative to
previous years. Although the response rate for this survey (65%) increased relative to 2015 (43%), there is decline
in response relative to earlier surveys which boasted response rates of about 73%. Tables 2 and 3 show the
breakdown of respondents by rank for TE and NTE faculty. As in 2015, the percentages of respondents by
academic rank reflect the percentages of TE and NTE faculty at W&M in each rank.
Table 1: Response Rate for each Academic Area or School, 2006 - 2019
Academic Area 2019 2015 2013 2009 2006
A&S Humanities 75% 48% 80% 85% 85%
A&S Social Sciences 50% 41% 70% 55% 70%
A&S Natural Sciences 62% 52% 89% 90% 86%
School of Business 44% 38% 70% 65% 81%
School of Education 69% 50% 87% 75% 76%
School of Law 79% 45% 38% 52% 39%
School of Marine Science/ VIMS 77% 29% 42% 49% 54%
Total Mean Response Rate 65% 43% 74% 72% 73%
Table 2: TE Share of Responses by Academic Rank
2019 2015
Academic Rank Percentage n Percentage n
Assistant Professor 17% 56 19% 49
Associate Professor 30% 94 36% 92
Full Professor 53% 168 45% 114
Total 100% 318 100% 255
Note: three tenured professors did not indicate their rank.
Table 3: NTE Share of Responses by Academic Rank
2019 2015
Appointment Category Percentage n Percentage n
Continuing 42% 59 49% 30
Specified Term 58% 80 51% 31
100% 139 100% 61
Note: two NTE professors did not indicate their NTE status.
1 Because not every individual answered every question, the total number of respondents varies between questions.
2 In this report the term “NTE” encompasses all types of instructional faculty who do not occupy a tenure line. “TE” encompasses all faculty who are eligible to apply for tenure, whether or not they have yet achieved tenure.
2019 William & Mary Faculty Survey
March 2020 page 9
III.
GENERAL SATISFACTION
The survey asked faculty how satisfied they are overall with their position at William & Mary and how satisfied
they were with 21 selected aspects of employment. Response options were: "Very Satisfied," "Satisfied," "Neither
Satisfied nor Dissatisfied", “Dissatisfied”, and "Very Dissatisfied."
A.
OVERALL JOB SATISFACTION
a.
Job satisfaction compared to previous surveys
Note: percentages do not add up to 100% for 2015 and 2019 because “neither satisfied nor dissatisfied was included as an option for these years.
b.
Overall Job Satisfaction by Academic Rank
Table 5: Overall Satisfaction by Academic Rank for TE and NTE faculty members
On the whole, how satisfied are you with your position at William & Mary?
Academic Rank Very Satisfied Satisfied Neither Satisfied
nor Dissatisfied Dissatisfied Very Dissatisfied
Assistant Professor 32% 48% 9% 9% 2%
Associate Professor 23% 49% 16% 7% 4%
Full Professor 27% 55% 9% 6% 2%
TE Total 27% 52% 11% 7% 3%
Continuing 19% 59% 7% 8% 3%
Specified Term 31% 45% 9% 10% 5%
NTE Total 26% 51% 8% 9% 4%
Notes: - One TE and three NTE faculty members did not answer this question. - Percentages may not add to 100% due to rounding.
Table 4: Job Satisfaction Levels Over Time for TE and NTE faculty members
On the whole, how satisfied are you with your position at the College?
Year Satisfied Dissatisfied
2019 TE 79% 10%
2015 TE 74% 14%
2013 TE 66% 34%
2009 TE 83% 17%
2019 NTE 77% 13%
2015 NTE 77% 15%
2019 William & Mary Faculty Survey
March 2020 page 10
c.
Overall Job Satisfaction of Faculty by Academic Area or School
Table 6: Overall Satisfaction by Academic Area or School in 2019
On the whole, how satisfied are you with your position at the College?
Academic Area Very
Satisfied Satisfied
Neither Satisfied
nor Dissatisfied Dissatisfied
Very Dissatisfied
Arts and Sciences Area I (Humanities) 25% 48% 11% 8% 7%
Arts and Sciences Area II (Social Sciences) 30% 52% 10% 6% 2%
Arts and Sciences Area III
(Natural Sciences and Mathematics) 26% 52% 10% 10% 2%
Mason School of Business 21% 47% 18% 6% 6%
School of Education 32% 56% 6% 3% 3%
Law School 19% 60% 11% 8% 0%
School of Marine Science/VIMS 35% 51% 5% 8% 0%
Total 26% 51% 10% 8% 4%
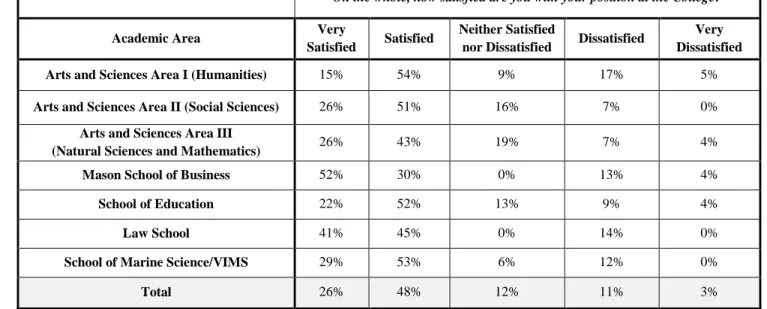
Table 7: Overall Satisfaction by Academic Area or School in 2015
On the whole, how satisfied are you with your position at the College?
Academic Area Very
Satisfied Satisfied
Neither Satisfied
nor Dissatisfied Dissatisfied
Very Dissatisfied
Arts and Sciences Area I (Humanities) 15% 54% 9% 17% 5%
Arts and Sciences Area II (Social Sciences) 26% 51% 16% 7% 0%
Arts and Sciences Area III
(Natural Sciences and Mathematics) 26% 43% 19% 7% 4%
Mason School of Business 52% 30% 0% 13% 4%
School of Education 22% 52% 13% 9% 4%
Law School 41% 45% 0% 14% 0%
School of Marine Science/VIMS 29% 53% 6% 12% 0%
Total 26% 48% 12% 11% 3%
B.
JOB SATISFACTION— 21 SELECTED ASPECTS OF EMPLOYMENT
To explore job satisfaction levels in detail, the survey asked faculty how satisfied they were in general with 21
specific aspects of their work at the W&M. Due to the small number of NTEs within each school, their data are
combined with TE data in all analyses in this section, except for those related to salary.
2019 William & Mary Faculty Survey
March 2020 page 11
a.
Level of support for internal summer research grants for faculty
Figure 1: How satisfied are you with the level of support for internal summer research grants at W&M?
b.
Travel support for research presentations at conferences
Figure 2: How satisfied are you with travel support for research presentations at W&M?
29
30
31
42
30
40
5
29
31
13
21
21
11
19
0
25
50
75
100
A&S I A&S II A&S III BUS.
EDU.
LAW
VIMS
P
er
cen
tag
e
Satisfied
Dissatisfied
43
34
22
41
32
57
27
35
39
22
15
44
8
35
0
25
50
75
100
A&S I A&S II A&S III BUS.
EDU.
LAW
VIMS
P
er
cen
tag
e
2019 William & Mary Faculty Survey
March 2020 page 12
c.
Overall research support
Figure 3: How satisfied are you with overall research support at W&M?
d.
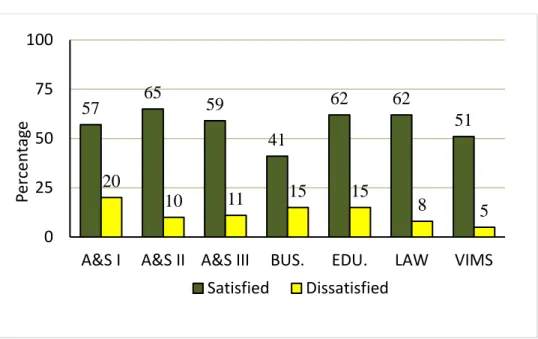
Support for teaching (faculty development)
Figure 4: How satisfied are you with the level of support for teaching (faculty development) at W&M?
39
39
30
42
27
46
54
31
27
29
24
41
11
19
0
25
50
75
100
A&S I A&S II A&S III BUS.
EDU.
LAW
VIMS
Pe
rc
enta
ge
Satisfied
Dissatisfied
57
65
59
41
62
62
51
20
10
11
15
15
8
5
0
25
50
75
100
A&S I A&S II A&S III BUS.
EDU.
LAW
VIMS
Pe
rc
enta
ge
2019 William & Mary Faculty Survey
March 2020 page 13
e.
Availability of classroom space appropriate for teaching needs
Figure 5: How satisfied are you with the availability of classroom space at W&M?
f.
Support provided by secretarial/office staff
Figure 6: How satisfied are you with the level of support provided by secretarial/office staff at W&M?
46
51
60
68
85
73
76
37
27
15
6
3
14
8
0
25
50
75
100
A&S I A&S II A&S III BUS.
EDU.
LAW
VIMS
P
er
cen
tag
e
Satisfied
Dissatisfied
66
72
73
65
58
57
57
18
9
11
6
12
17
32
0
25
50
75
100
A&S I A&S II A&S III BUS.
EDU.
LAW
VIMS
P
er
cen
tag
e
2019 William & Mary Faculty Survey
March 2020 page 14
g.
Job support for spouses/partners of faculty members
Figure 7: How satisfied are you with the level of support for spouses/partners of faculty members at W&M?
h.
Support for faculty who are caregivers
Figure 8: How satisfied are you with the level of support for faculty who are caregivers at W&M?
14
16
13
9
12
5
27
26
27
35
18
30
27
11
0
25
50
75
100
A&S I A&S II A&S III BUS.
EDU.
LAW
VIMS
P
er
cen
tag
e
Satisfied
Dissatisfied
23
33
17
18
50
32
38
17
19
13
15
3
3
5
0
25
50
75
100
A&S I A&S II A&S III BUS.
EDU.
LAW
VIMS
P
er
cen
tag
e
2019 William & Mary Faculty Survey
March 2020 page 15
i.
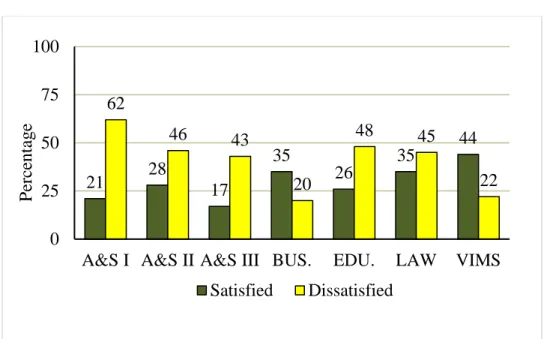
Faculty salaries in general (TE faculty)
Figure 9: How satisfied are you with the level of support for faculty salaries at W&M?
j.
Faculty salaries in general (NTE faculty)
Figure 10: How satisfied are you with the level of support for faculty salaries at W&M?
21
28
17
35
26
35
44
62
46
43
20
48
45
22
0
25
50
75
100
A&S I A&S II A&S III BUS.
EDU.
LAW
VIMS
P
er
cen
tag
e
Satisfied
Dissatisfied
27
26
49
37
0
25
50
75
100
Continuing
Specified-Term
P
er
cen
tag
e
2019 William & Mary Faculty Survey
March 2020 page 16
k.
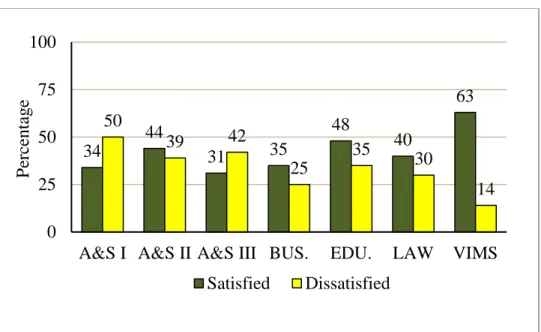
Personal salary (TE faculty)
Figure 11: How satisfied are you with the level of support for your salary at W&M?
l.
Personal salary (NTE Faculty)
Figure 12: How satisfied are you with the level of support for your salary at W&M?
34
44
31
35
48
40
63
50
39
42
25
35
30
14
0
25
50
75
100
A&S I A&S II A&S III BUS.
EDU.
LAW
VIMS
P
er
cen
tag
e
Satisfied
Dissatisfied
30
22
53
51
0
25
50
75
100
Continuing
Specified-Term
P
er
cen
tag
e
2019 William & Mary Faculty Survey
March 2020 page 17
m.
Overall benefits
Figure 13: How satisfied are you with the level of support for overall benefits at W&M?
n.
Tuition benefits for dependents
Figure 14: How satisfied are you with the level of support for tuition benefits for dependents at W&M?
61
66
65
62
71
62
87
18
8
14
9
9
19
3
0
25
50
75
100
A&S I A&S II A&S III BUS.
EDU.
LAW
VIMS
P
er
cen
tag
e
Satisfied
Dissatisfied
4
3
2
6
9
3
11
45
56
54
50
59
59
57
0
25
50
75
100
A&S I A&S II A&S III BUS.
EDU.
LAW
VIMS
P
er
cen
tag
e
2019 William & Mary Faculty Survey
March 2020 page 18
o. Ability to manage workload, stress, and burnout
Figure 15: How satisfied are you with your ability to manage workload, stress, and burnout at W&M?
p. Expectations for balancing and integrating teaching and scholarship
Figure 16: How satisfied are you with expectations for balancingand integrating teaching and scholarship at W&M?
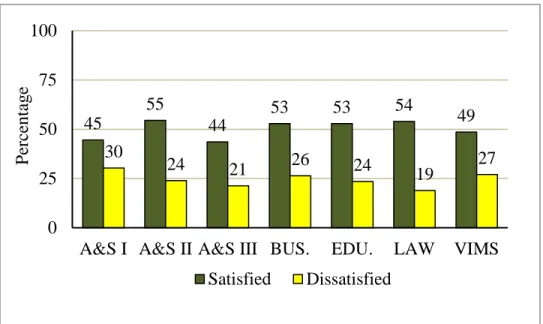
45
55
44
53
53
54
49
30
24
21
26
24
19
27
0
25
50
75
100
A&S I A&S II A&S III BUS.
EDU.
LAW
VIMS
P
er
cen
tag
e
Satisfied
Dissatisfied
46
57
56
41
53
57
65
22
16
14
29
18
14
3
0
25
50
75
100
A&S I A&S II A&S III BUS.
EDU.
LAW
VIMS
P
er
cen
tag
e
2019 William & Mary Faculty Survey
March 2020 page 19
q. NTE inclusion (TE faculty)
Figure 17: How satisfied are you with NTE inclusion at W&M?
r. NTE inclusion (NTE faculty)
Figure 18: How satisfied are you with NTE inclusion at W&M?
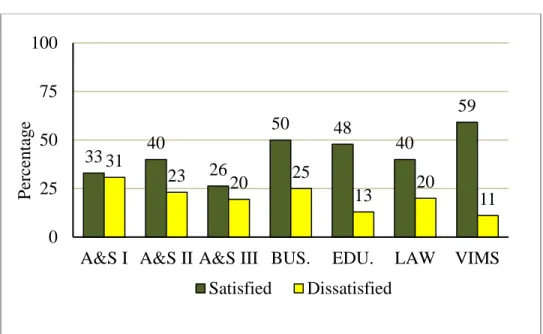
33
40
26
50
48
40
59
31
23
20
25
13
20
11
0
25
50
75
100
A&S I A&S II A&S III BUS.
EDU.
LAW
VIMS
P
er
cen
tag
e
Satisfied
Dissatisfied
39
39
39
29
0
25
50
75
100
Continuing
Specified-Term
P
er
cen
tag
e
2019 William & Mary Faculty Survey
March 2020 page 20
s.
Faculty retention
Figure 19: How satisfied are you with faculty retention at W&M?
t. Well-being of campus community
Figure 20: How satisfied are you with the well-being of the campus community at W&M?
32
40
30
44
35
27
49
36
25
24
26
21
14
14
0
25
50
75
100
A&S I A&S II A&S III BUS.
EDU.
LAW
VIMS
P
er
cen
tag
e
Satisfied
Dissatisfied
64
49
56
62
56
51
73
13
13
8
15
15
14
8
0
25
50
75
100
A&S I A&S II A&S III BUS.
EDU.
LAW
VIMS
P
er
cen
tag
e
2019 William & Mary Faculty Survey
March 2020 page 21
u.
Faculty collegiality and engagement
Figure 21: How satisfied are you with faculty collegiality and engagement at W&M?
v. Diversity & inclusion
Figure 22: How satisfied are you with diversity & inclusion at W&M?
68
75
69
53
56
59
68
16
16
10
24
27
24
11
0
25
50
75
100
A&S I A&S II A&S III BUS.
EDU.
LAW
VIMS
P
er
cen
tag
e
Satisfied
Dissatisfied
37
35
34
65
53
35
51
32
33
17
18
32
32
19
0
25
50
75
100
A&S I A&S II A&S III BUS.
EDU.
LAW
VIMS
P
er
cen
tag
e
2019 William & Mary Faculty Survey
March 2020 page 22
w. Teaching Load
Figure 23: How satisfied are you with the teaching load at W&M?
x. NTE Ratio
Figure 24: How satisfied are you with the NTE ratio at W&M?
77
86
71
56
85
73
76
11
6
6
26
6
5
0
0
25
50
75
100
A&S I A&S II A&S III BUS.
EDU.
LAW
VIMS
P
er
cen
tag
e
Satisfied
Dissatisfied
14
27
34
44
53
24
43
53
28
23
21
6
30
11
0
25
50
75
100
A&S I A&S II A&S III BUS.
EDU.
LAW
VIMS
P
er
cen
tag
e
2019 William & Mary Faculty Survey
March 2020 page 23
C.
OVERALL JOB SATISFACTION BASED ON GENDER AND ACADEMIC RANK
In Table 8, we assessed satisfaction as a function of gender (
169 women, 199 men). Because of the small
number of faculty who identified as non-binary (n = 2), they were not included this analyses. In Table 9, TE
and NTE faculty are categorized as a function of their academic rank.
Responses from 2019 were compared to
those from 2015. Twelve new questions were added to this section of the 2019 survey, therefore 2015
comparisons are not available for these questions. Moreover, NTE responses were not categorized as a function of
employment status in 2015.
a.
Job satisfaction: Responses grouped by gender
Table 8: Job Satisfaction Grouped by Gender
Percentage of faculty satisfied with each of the following aspects of their work:
Women Men
Satisfied Dissatisfied Satisfied Dissatisfied
Level of support of summer grants 28.3% 28.9% 30.6% 16.0%
Travel Support 38.6% 34.3% 34.2% 28.6%
Overall Research Support 35.5% 30.7% 44.3% 22.1%
Teaching Support 60.9% 16.3% 59.8% 9.0%
Availability of Classroom space 53.0% 24.1% 65.8% 18.6%
Secretarial/office support 72.9% 13.2% 69.9% 12.5%
Spouse/partner support 11.4% 29.0% 17.1% 23.7%
Caregiver support 29.5% 16.2% 27.6% 9.0%
Salaries, general 24.7% 56.1% 30.1% 35.7%
Salaries, personal 36.1% 44.0% 40.7% 37.2%
Overall Benefits 72.3% 7.8% 65.8% 14.1%
Tuition Benefits 2.4% 51.8% 6.5% 54.3%
Ability to Manage Workload and
Stress 47.6% 26.5% 53.8% 23.1%
Expectations for Balancing and Integrating Teaching and
Scholarship
50.0% 21.7% 59.3% 10.5%
NTE Inclusion 36.1% 29.5% 41.3% 23.6%
Faculty Retention 32.5% 24.7% 44.7% 23.6%
Well-being of Campus Community 59.6% 13.8% 63.8% 8.5%
Faculty Collegiality 69.9% 15.7% 70.4% 13.1%
Diversity and Inclusion 33.7% 35.5% 43.8% 22.1%
Teaching Load 79.5% 10.8% 78.9% 5.5%
2019 William & Mary Faculty Survey
March 2020 page 24
b. Job satisfaction: Responses grouped by academic rank
Table 9: Job Satisfaction for each Work Category Grouped by Academic Rank
Percentage of faculty satisfied with each of the following aspects of their work:
2019 2015
Academic Rank Satisfied Dissatisfied Satisfied Dissatisfied
Level of support of summer grants
Assistant Professors 48% 23% 39% 39%
Associate Professors 27% 35% 21% 38%
Full Professors 38% 19% 33% 29%
Specified-term NTE 14% 54%
8% 13%
Continuing NTE 10% 70%
Support for Travel
Assistant Professors 41% 20% 31% 47%
Associate Professors 36% 39% 28% 50%
Full Professors 39% 33% 36% 39%
Specified-term NTE 30% 18%
40% 26%
Continuing NTE 34% 31%
Overall Research Support
Assistant Professors 55% 29%
Associate Professors 38% 34%
Full Professors 46% 31%
Specified-term NTE 20% 14%
Continuing NTE 25% 22%
Teaching support (Faculty Development)
Assistant Professors 63% 11% 61% 12%
Associate Professors 62% 14% 55% 13%
Full Professors 63% 10% 63% 8%
Specified-term NTE 53% 13%
48% 14%
Continuing NTE 51% 19%
Availability of Classroom space
Assistant Professors 66% 20% 61% 12%
Associate Professors 50% 29% 33% 50%
Full Professors 63% 20% 53% 24%
Specified-term NTE 56% 21%
69% 14%
2019 William & Mary Faculty Survey
March 2020 page 25
Percentage of faculty satisfied with each of the following aspects of their work:2019 2015
Academic Rank Satisfied Dissatisfied Satisfied Dissatisfied
Secretarial/office support
Assistant Professors 70% 20% 65% 22%
Associate Professors 66% 18% 53% 26%
Full Professors 64% 17% 69% 13%
Specified-term NTE 76% 9%
74% 11%
Continuing NTE 70% 15%
Spouse/partner support
Assistant Professors 13% 36% 12% 29%
Associate Professors 10% 33% 14% 35%
Full Professors 20% 27% 21% 26%
Specified-term NTE 8% 19%
21% 16%
Continuing NTE 17% 17%
Caregiver Support
Assistant Professors 27% 7% 16% 14%
Associate Professors 23% 20% 14% 21%
Full Professors 35% 13% 29% 11%
Specified-term NTE 24% 11%
11% 6%
Continuing NTE 18% 9%
Salaries, generally
Assistant Professors 34% 47% 18% 51%
Associate Professors 43% 48% 21% 49%
Full Professors 29% 45% 24% 50%
Specified-term NTE 26% 38%
29% 34%
Continuing NTE 27% 49%
Salaries, personal
Assistant Professors 34% 45% 26% 53%
Associate Professors 33% 42% 27% 40%
Full Professors 35% 35% 47% 39%
Specified-term NTE 23% 51%
28% 53%
Continuing NTE 31% 53%
Overall Benefits
Assistant Professors 75% 11%
Associate Professors 60% 13%
Full Professors 68% 11%
Specified-term NTE 59% 18%
2019 William & Mary Faculty Survey
March 2020 page 26
Percentage of faculty satisfied with each of the following aspects of their work:2019 2015
Academic Rank Satisfied Dissatisfied Satisfied Dissatisfied
Tuition Benefits
Assistant Professors 0% 55%
Associate Professors 3% 63%
Full Professors 5% 58%
Specified-term NTE 23% 28%
Continuing NTE 36% 51%
Ability to Manage Workload and Stress
Assistant Professors 54% 21%
Associate Professors 38% 32%
Full Professors 51% 24%
Specified-term NTE 58% 20%
Continuing NTE 48% 22%
Expectations for Balancing and Integrating Teaching and Scholarship
Assistant Professors 59% 16%
Associate Professors 59% 21%
Full Professors 66% 16%
Specified-term NTE 29% 13%
Continuing NTE 37% 19%
NTE Inclusion
Assistant Professors 34% 34%
Associate Professors 30% 23%
Full Professors 43% 19%
Specified-term NTE 39% 29%
Continuing NTE 39% 39%
Faculty Retention
Assistant Professors 34% 27%
Associate Professors 29% 40%
Full Professors 41% 24%
Specified-term NTE 33% 16%
Continuing NTE 36% 19%
Well-being of Campus Community
Assistant Professors 61% 4%
Associate Professors 42% 19%
Full Professors 61% 13%
Specified-term NTE 71% 5%
2019 William & Mary Faculty Survey
March 2020 page 27
Percentage of faculty satisfied with each of the following aspects of their work:2019 2015
Academic Rank Satisfied Dissatisfied Satisfied Dissatisfied
Faculty Collegiality
Assistant Professors 71% 9%
Associate Professors 64% 23%
Full Professors 66% 17%
Specified-term NTE 78% 9%
Continuing NTE 63% 17%
Diversity & Inclusion
Assistant Professors 39% 34%
Associate Professors 24% 44%
Full Professors 42% 19%
Specified-term NTE 55% 23%
Continuing NTE 49% 27%
Teaching Load
Assistant Professors 84% 7%
Associate Professors 80% 6%
Full Professors 84% 4%
Specified-term NTE 64% 19%
Continuing NTE 61% 12%
NTE to TE Ratio
Assistant Professors 34% 21%
Associate Professors 22% 45%
Full Professors 29% 33%
Specified-term NTE 28% 20%
2019 William & Mary Faculty Survey
March 2020 page 28
IV.
FACULTY RETENTION
This section of the survey asked faculty whether they are currently in the job market and if they have
contemplated leaving William & Mary over the past three years (Tables 10 and 11) and if so, about their reasons
for such contemplation (Table 14). Table 11 groups NTE faculty into continuing and specified term to determine
whether sentiments were consistent across these groups. Tables 12 and 13 are included for comparison from the
2015 survey.
A.
Faculty Who Have Considered Leaving
Table 10:TE & NTE2F
3 faculty who are Considering Leaving W&M
% TE n % NTE n
I am currently on the job market.
22% 71 29% 40
I have considered leaving WM.
47% 150 55% 77
Table 11:
NTE Faculty who are Considering Leaving W&M %
Continuing
n % Specified
Term
n
I am currently on the job market.
33% 15 32% 25
I have considered leaving WM.
61% 35 52% 41
B.
Faculty Who Have Considered Leaving (2015 Survey)
Table 12:
TE & NTE3F
4 faculty who are Considering Leaving W&M
% TE n % NTE n
I am currently on the job market.
23% 57 39% 23
I have considered leaving WM.
62% 157 69% 42
Table 13:
NTE Faculty who are Considering Leaving W&M %
Continuing
n % Specified
Term
n I am currently on
the job market.
17% 15 60% 25
I have considered leaving WM.
63% 35 74% 41
3 Five TE and four NTE professors did not indicate whether they were on the job market and three TE and three NTE
professors did not indicate whether they had considered leaving W&M in the past three years.
4
2019 William & Mary Faculty Survey
March 2020 page 29
Reasons Why Faculty Consider Leaving W&M
Faculty who indicated that had considered leaving over the past three years were asked to indicate which of the
options listed in Table 14 reflected their reasons for wanting to leave. Faculty could choose multiple answers.
Fifty-two faculty indicated that there were “other reasons” beyond those listed. When asked to elaborate, six
themes emerged; faculty indicated frustrations with 1) the lack of leadership from various levels of
administration; 2) increased expectations and workload; 3) lack of belonging, equity, and inclusion 4) lack of
institutional support for professional development and growth. Additionally, specified term NTEs indicated the
need for a permanent position.
Table 14: Reasons why TE and NTE Faculty Considered Leaving W&M in the Past Three Years
Faculty Retention
Please indicate why you have considered leaving your position at William & Mary. (check all that apply)
TE Continuing NTE Specified-term NTE
% Yes n % Yes n % Yes n
Desire for reduced teaching load 8% 11 14% 5 19% 7
Desire to join a department or school that places more emphasis on my research specialty.
25% 36 9% 3 16% 6
Dissatisfaction with my salary at W&M 72% 105 62% 22 62% 23
Dissatisfaction with the level of collegiality in my
department or school 19%
27 29% 10 14% 5
Dissatisfaction with the research support that I receive 38% 56 20% 7 24% 9
Desire for a tenure-eligible position 0% 0 46% 16 43% 16
Tuition benefits for dependents 28% 41 34% 12 11% 4
Spouse/partner hiring issue 13% 19 17% 6 14% 5
Other reason 34% 49 37% 13 32% 12
Note: percentages are based on the number of faculty who indicated they had considered leaving; people could choose multiple answers.
2019 William & Mary Faculty Survey
March 2020 page 30
V:
FACULTY EVALUATION
This section focused on the extent to which faculty felt that they are fairly evaluated during the merit process in
their department or school, and the degree to which performance standards were clear for tenure and promotion in
their department or school. Response options were: “Strongly Agree”, “Agree”, “Neither Agree nor Disagree”,
“Disagree”, and “Strongly Disagree.” In the graphs that follow, NTE responses are combined with TE data for the
questions about merit evaluation (Figure 25) and clarity of standards for promotion (Figure 17) and only TE data
are shown for clarity of tenure standards (Figure 16). In the tables, faculty are divided by rank (for TE faculty)
and appointment category (for NTE faculty).
A.
Fair Evaluation for Merit
Figure 25: Fair Evaluation during the Merit Process
49
55
46
41
41
30
70
28
24
22
29
32
30
11
0
25
50
75
100
AS1
AS2
AS3
BUS.
EDU.
LAW
VIMS
Pe
rc
enta
ge
2019 William & Mary Faculty Survey
March 2020 page 31
B.
Performance Standards Clear for Tenure (TE only)
Figure 26: Performance Standards Clear for Tenure; TE Faculty Only
C.
Performance Standards Clear for Promotion (TE & Continuing NTE)
Figure 27: Performance Standard Clear for Promotion; TE and Continuing NTE Faculty
75
71
72
50
91
85
74
11
9
11
20
0
10
7
0
25
50
75
100
AS1
AS2
AS3
BUS.
EDU.
LAW
VIMS
Pe
rc
enta
ge
Agree
Disagree
64
62
64
27
82
57
68
15
9
12
42
4
29
11
0
25
50
75
100
AS1
AS2
AS3
BUS.
EDU.
LAW
VIMS
Pe
rc
enta
ge
2019 William & Mary Faculty Survey
March 2020 page 32
D.
Faculty Evaluation: Responses grouped by Academic Rank and Appointment Category
Table 15 shows the degree to which faculty agree that they are fairly evaluated for merit, and performance
standards are clear for tenure and promotion as a function of academic rank. Only the tenured and tenure-eligible
faculty were asked the degree to which they agreed that performance standards are clear for tenure and only
continuing NTEs were included in the analyses that asked about clarity of performance standards for promotion.
Table 15: Faculty Evaluation Grouped by Academic Rank
Fairly Evaluated during Merit
Process
Performance Standards are clear
for Tenure
Performance Standards are clear for Promotion
Academic Rank Agree Disagree Agree Disagree Agree Disagree n
Assistant Professors 50% 16% 57% 12% 54% 12% 56
Associate Professors 51% 24% 73% 14% 64% 14% 94
Full Professors 51% 32% 80% 7% 76% 8% 167
NTE: Continuing 39% 29% N/A N/A 29% 34% 57
NTE: Specified-term 51% 15% N/A N/A N/A N/A 78
E.
Faculty Evaluation: Responses Grouped by Gender
Table 16 shows faculty perceptions of merit evaluations and tenure and promotion standards by women (
n
= 166)
and men (
n
= 199).
Table 16: Faculty Evaluation grouped by Gender
Fairly Evaluated during Merit
Process
Performance Standards are clear
for Tenure
Performance Standards are clear for Promotion
Agree Disagree Agree Disagree Agree Disagree
Women 46% 31% 62% 12% 56% 26%
2019 William & Mary Faculty Survey
March 2020 page 33
VI.
RESEARCH & GRANT SUPPORT
This section of the survey asked faculty about the type of grant support they have received over the past three
years (Table 17) and their level of satisfaction with the services provided by various offices across campus in
identifying potential funding sources and in managing grants (Table 18).
A.
Types of External Research Grants Awarded
Of the 463 faculty members who responded to this question, 272
4F5
indicated that they had received at least
one external grant over the last three years and 261 indicated that they received an internal grant.
Table 17: Research Grants grouped by Academic Area or School
Academic Area
Have you received funding for your work from the following agencies?
Foundation Internal Federal Business/Industry Total
% Yes n % Yes n % Yes n % Yes n n
A&S Humanities 37% 51 61% 85 13% 18 6% 8 139
A&S Social Sciences 46% 40 61% 54 27% 24 10% 9 88
A&S Natural Sciences 46% 43 55% 52 56% 53 19% 18 94
School of Business 38% 13 38% 13 9% 3 21% 7 34
School of Education 47% 16 38% 13 29% 10 12% 4 34
School of Law 30% 11 60% 22 11% 4 14% 5 37
School of Marine Sciences/ VIMS 73% 27 49% 18 97% 36 41% 15 37
Total 203 261 149 66 463
B.
Satisfaction with Support for Managing External Research Grants: Responses Grouped by
Academic Area or School
All respondents were asked whether they were satisfied with the support they received in identifying and applying
for grants. Next the 272 respondents, who indicated that they had received at least one external grant in the past
three years, additionally were asked how satisfied they were with the support they received from the Office of
Sponsored Projects, Human Resources, and Accounts Payable in managing their grants. In Table 18, responses
are divided by academic area or school. Because of the small number of respondents from the School of Business
(
n
= 7), their results are not included for the last three questions.
5 Note that because some faculty indicated that they received grants from more than one external source, this number does not
2019 William & Mary Faculty Survey
March 2020 page 34
Table 18:Satisfaction with Administrative Support for Grants by Academic Area or School
Academic Area or School Satisfied Dissatisfied n
Satisfaction with Support Received for Identifying Grants
A&S Humanities 26% 24% 139
A&S Social Sciences 26% 17% 88
A&S Natural Sciences 33% 13% 94
School of Business 6% 12% 34
School of Education 12% 53% 34
School of Law 30% 8% 37
School of Marine Sciences/ VIMS 46% 32% 37
Satisfaction with Support Received for Applying for Grants
A&S Humanities 22% 22% 139
A&S Social Sciences 27% 18% 88
A&S Natural Sciences 48% 18% 94
School of Business 3% 12% 34
School of Education 18% 53% 34
School of Law 19% 11% 37
School of Marine Sciences/ VIMS 32% 40% 37
Satisfaction with the Office of Sponsored Programs
A&S Humanities 13% 7% 60
A&S Social Sciences 22% 10% 48
A&S Natural Sciences 48% 15% 67
School of Education 15% 35% 22
School of Law 3% 8% 10
School of Marine Sciences/ VIMS 19% 54% 37
Satisfaction with Human Resources
A&S Humanities 7% 11% 53
A&S Social Sciences 3% 16% 35
A&S Natural Sciences 16% 19% 51
School of Education 9% 35% 18
School of Law 3% 5% 10
School of Marine Sciences/ VIMS 14% 57% 35
Satisfaction with Accounts Payable
A&S Humanities 12% 12% 61
A&S Social Sciences 11% 14% 41
A&S Natural Sciences 15% 17% 51
School of Education 9% 26% 21
School of Law 8% 3% 12
2019 William & Mary Faculty Survey
March 2020 page 35
VII.
UNIVERSITY GOVERNANCE & ADMINISTRATION
Table 19 compiles responses to questions regarding faculty satisfaction with the central administration (i.e.,
President, VPs, Provost, BOV etc.) over the past academic year for TE and NTE faculty. Responses from 2019
were compared to those from 2015, which asked about faculty satisfaction over the previous three years. Five
new questions were added to this section of the 2019 survey, therefore 2015 comparisons are not available for
these questions.
Table 19: TE and NTE Faculty Members’ Satisfaction with the Record of Central Administration
How satisfied are you with the record of the central administration in the following
areas:
2019 2015
NTE TE NTE TE
Satisfied Dissatisfied Satisfied Dissatisfied Satisfied Dissatisfied Satisfied Dissatisfied
Representation to External
Constituencies 37% 6% 39% 8% 36% 8% 38% 14%
Developing Partnerships with
R&D Entities 12% 3% 11% 12%
Setting Priorities for Building
Repair & Construction 27% 21% 31% 21% 27% 15% 34% 21%
Establishing Budget Priorities 17% 20% 21% 30% 24% 29% 22% 32%
Commitment to Improving
Faculty Compensation & Salary 17% 37% 21% 41% 29% 33% 51% 26%
Communication with Faculty 48% 15% 42% 21% 24% 29% 40% 34%
Consultation on Policy Decisions 29% 14% 29% 24% 34% 22% 26% 39%
Faculty inclusion in
Administrative Searches 30% 9% 37% 19% 30% 10% 34% 17%
Support for Teaching 42% 12% 55% 9% 62% 12% 60% 16%
Setting Appropriate Goals for
Research 19% 6% 26% 16% 29% 17% 29% 41%
Support for Graduate and
Professional Programs 22% 11% 22% 25% 32% 14% 24% 26%
Support for Faculty Role in
Shared Governance 35% 9% 38% 22% 36% 19% 37% 24%
Securing Increased Private
Giving 26% 5% 39% 12%
Encouraging Broad Viewpoints
about University Priorities 40% 15% 39% 15%
Protecting Free Speech and
Academic Freedom 45% 12% 44% 14%
Accountability for Increasing
W&M’s Research Output 19% 4% 17% 20%
Overall satisfaction with