Hospital Performance Differences
by Ownership
David Foster, PhD, MPH | Louise Zrull | Jean Chenoweth
June 2013
100 TOP HOSPITALS
RESEARCH
Summary
Leaders of hospitals set different missions and goals that are influenced by the needs of the community, the challenges facing the organization, ownership, and other factors. We conducted this study to examine whether ownership is correlated with hospital balanced performance or the individual metrics of the Truven Health 100 Top Hospitals® balanced scorecard.
The performance scores of not-for-profit church-owned and other not-for-profit hospitals suggest that these hospitals are adhering to and achieving the mission of service to the community. The performance scores of for-profit hospitals suggest increased success in serving both the community and shareholders. The results showed that not-for-profit church-owned hospitals have had the greatest success in achieving balanced excellence (highest overall score on the balanced scorecard) in serving their communities. Given the performance across the measures in the scorecard, the church-owned hospitals are still leading other ownership groups in delivering high value to their communities with reliable high quality and efficiency and high patient perception of care at a reasonable cost. These hospitals are also financially stable. For-profit hospital performance shows increased balance between financial and clinical performance, but weakness in other metrics. More specifically, the for-profit hospitals excel in lower expenses and higher profits for shareholders and have made a significant gain in quality. Government hospitals demonstrate the weakest balanced performance, with significantly worse performance on core measures and inpatient expenses.
We also found statistically significant differences in specific performance areas:
§ Not-for-profit church-owned hospitals save more lives, release patients from the hospital sooner, and have better overall patient satisfaction ratings.
§ All not-for-profit hospitals combined (both church-owned and other) have significantly better patient safety, fewer 30-day mortalities, and better overall patient satisfaction ratings.
§ For-profit hospitals significantly outperformed other ownership categories in core measures, expense control, and profit from operations.
HIGHLIGHTS
This paper evaluates whether
hospital ownership is
associated with differing levels
of performance on Truven
Health 100 Top Hospitals®
balanced scorecard measures.
The hospital ownership
groups that were included are:
§
Not-for-profit, Church
§
Not-for-profit, Other
§
For-profit, Corporation
§
Government (non-federal)
The results show that
not-for-profit church-owned hospitals
have had the greatest
success achieving balanced
excellence.
The results demonstrate that religious-based not-for-profit hospitals deliver the more balanced performance and value to the community. This is similar to findings in our 2010 study of ownership.1 The religious hospitals demonstrated significantly better results than for-profit and government hospitals on inpatient and 30-day mortality, patient safety, length of stay, and patient satisfaction (Hospital Consumer Assessment of Healthcare Providers and Systems or HCAHPS). The religious not-for-profits were significantly better than other not-for-profits and government at keeping expenses low, but not as effective as the for-profit sector.
The other not-for-profits were significantly better than for-profit and government on mortality and patient safety and demonstrated the highest score of all groups on 30-day mortality.
The for-profit hospitals showed a significant improvement on core measures performance since 2010. The for-profit hospitals demonstrated significantly better results than other ownership groups on core measures, inpatient expenses, and profits from operations. The for-profits, however, performed significantly worse than peers on HCAHPS.
Government-owned hospital performance was average in many areas, but these hospitals performed significantly worse on core measures and inpatient expenses. The leaders of government hospitals will need to address re-establishment of balanced performance to provide high value to the community.
Methodology
Data Sources
We used the study database for the 100 Top Hospitals, 2013 study. These data are comprised of MedPAR public use files for federal fiscal years 2010 and 2011 for the mortality, complications, and patient safety measures. Other measures, such as length of stay, are based on the most recent single year of MedPAR data, which was 2011. Other measures are derived from the Centers for Medicare & Medicaid Services (CMS) Hospital Compare database or the Medicare Cost Reports filed by hospitals.
Ownership Groups
We determined ownership from the American Hospital Association Hospital Survey Database, 2011, to investigate the following hospital ownership categories (number of hospitals in each group is indicated in parentheses):
§ Not-for-profit, Church (375)
§ Not-for-profit, Other (1,496)
§ For-profit, Corporation (583)
§ Government (non-federal) (459)
1 Foster, D. Differences in Health System Quality Performance by Ownership. Truven Health Analytics. Ann
Performance Calculation
We computed measure-specific means, along with 95-percent confidence intervals, for each of the ownership groups for each of the 100 Top Hospitals measures. We evaluated the following balanced scorecard of measures, as defined in the 100 Top Hospitals study2:
§ Risk-adjusted mortality (in hospital)
§ Risk-adjusted complications
§ Risk-adjusted patient safety
§ Core measures mean percent
§ 30-day risk-adjusted mortality rate for acute myocardial infarction (AMI), heart failure, and pneumonia
§ 30-day risk-adjusted readmission rate for AMI, heart failure, and pneumonia
§ Severity-adjusted average length of stay
§ Case mix- and wage-adjusted inpatient expense per discharge
§ Adjusted operating profit margin
§ HCAHPS score (patient rating of overall hospital performance)
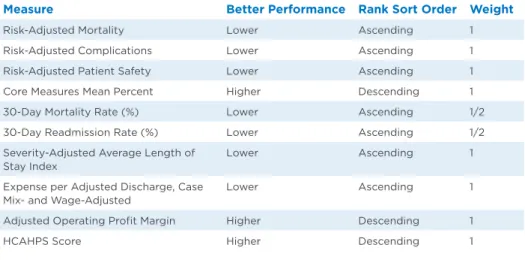
We weighted the rankings for each measure across the various ownership categories as described in the 100 Top Hospitals study2, and calculated a summed rank as an overall, composite measure reflecting the overall performance of each ownership category on all of the measures (Table 1).
Table 1: Performance Measure Ranking Sort Order and Weights
Measure Better Performance Rank Sort Order Weight
Risk-Adjusted Mortality Lower Ascending 1 Risk-Adjusted Complications Lower Ascending 1 Risk-Adjusted Patient Safety Lower Ascending 1 Core Measures Mean Percent Higher Descending 1 30-Day Mortality Rate (%) Lower Ascending 1/2 30-Day Readmission Rate (%) Lower Ascending 1/2 Severity-Adjusted Average Length of
Stay Index
Lower Ascending 1 Expense per Adjusted Discharge, Case
Mix- and Wage-Adjusted
Lower Ascending 1 Adjusted Operating Profit Margin Higher Descending 1
HCAHPS Score Higher Descending 1
Results
Overall Performance
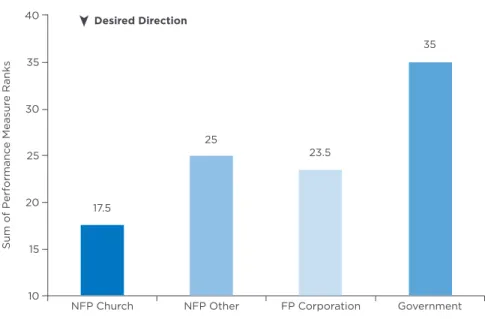
In overall performance, the not-for-profit church hospitals score the best of all of the ownership categories, while government hospitals score the worst. Other not-for-profit and not-for-profit hospitals performed about equally and in the middle of the worst- and best-performing groups. See Figure 1.
Figure 1: Overall Performance Comparisons by Ownership
Note: Performance based on sum of all ranks, where lower is better.
Measure-Specific Findings
Not-for-profit church-owned hospitals performed significantly better than all other ownership categories in the following measures:
§ Risk-adjusted mortality, in-hospital (Figure 2)
§ Length of stay (Figure 3)
§ HCAHPS score (Figure 4)
Figure 2: Risk-Adjusted Mortality (In-Hospital) by Ownership 40
35
30
25
20
15
10
17.5
NFP Church NFP Other FP Corporation Government
Sum of P
erf
ormanc
e Measur
e Ranks
25
23.5
35
0.10 0.00 -0.10 -0.20 -0.30 -0.40
-0.50 -0.47
NFP Church NFP Other FP Corporation Government
S
tandar
d De
via
tion Units
-0.30
-0.12
-0.04
➤
Figure 3: Length of Stay by Ownership
Significantly shorter LOS Desired Direction
Figure 4: HCAHPS Score by Ownership
Significantly higher HCAHPS scores Desired Direction
Significantly lower HCAHPS scores 5.20
5.15 5.10 5.05 5.00 4.95 4.90 4.85 4.80
4.94
NFP Church NFP Other FP Corporation Government
D
ays
5.11
5.08
5.17
➤
262 260 258 256 254 252 250 248
261.2
NFP Church NFP Other FP Corporation Government
Sc
or
e
259.6
253.1
258.4
All not-for-profit hospitals combined (both church-owned and other) performed significantly better than for-profit hospitals in the following measures:
§ HCAHPS score (Figure 4)
§ Risk-adjusted patient safety (Figure 5)
§ 30-day mortality (Figure 6)
Figure 5: Risk-Adjusted Patient Safety Index by Ownership
Significantly better patient safety scores (fewer adverse safety events) Desired Direction
Figure 6: 30-Day Mortality by Ownership
Significantly better 30-day mortality (higher survival rates 30 days after discharge) Desired Direction
0.60
0.40
0.20
0.00
-0.20
-0.40
-0.16
NFP Church NFP Other FP Corporation Government
S
tandar
d De
via
tion Units
-0.17
0.32
-0.18
➤
➤
13.2 13.1 13.0 12.9 12.8 12.7 12.6 12.5 12.4 12.3 12.2 12.1
12.8%
NFP Church NFP Other FP Corporation Government
P
er
cent
12.5%
13.0%
All for-profit hospitals, as a group, performed significantly better on the following three metrics, but significantly worse on HCAHPS (Figure 4):
§ Core measures (Figure 7)
§ Expense (Figure 8)
§ Operating profit margin (Figure 9)
For government hospitals, as a group, performance was significantly weaker than other ownership groups on two measures:
§ Core measures (Figure 7)
§ Expense (Figure 8)
Figure 7: Core Measures Mean Percent by Ownership
Significantly better core measure scores Desired Direction
Significantly worse core measure scores
Figure 8: Case Mix- and Wage-Adjusted Inpatient Expense per Discharge by Ownership
Significantly better (lower) inpatient expenses Desired Direction
Significantly worse (higher) inpatient expenses 97.5
97.0 96.5 96.0 95.5 95.0 94.5 94.0 93.5
96.5%
NFP Church NFP Other FP Corporation Government
P
er
cent
96.2%
97.3%
95.0%
➤
6,800 6,600 6,400 6,200 6,000 5,800 5,600 5,400
$6,170
NFP Church NFP Other FP Corporation Government
Dollars
$6,429
$5,811
$6,633
Figure 9: Operating Profit Margin by Ownership
Significantly better profits from operations Desired Direction
Figure 10: Risk-Adjusted Patient Complications by Ownership
➤ Desired Direction
0.30 0.25 0.20 0.15 0.10 0.05 0.00 -0.05 -0.10 -0.15 -0.20
0.05
NFP Church NFP Other FP Corporation Government
S
tandar
d De
via
tion Units
0.25
-0.13
0.04
➤
12.0
10.0
8.0
6.0
4.0
2.0
0.0
4.9%
NFP Church NFP Other FP Corporation Government
P
er
cent
4.9%
11.2%
2.8%
ABOUT TRUVEN HEALTH ANALYTICS
Truven Health Analytics delivers unbiased information, analytic tools, benchmarks, and services to the healthcare industry. Hospitals, government agencies, employers, health plans, clinicians, pharmaceutical, and medical device companies have relied on us for more than 30 years. We combine our deep clinical, financial, and healthcare management expertise with innovative technology platforms and information assets to make healthcare better by collaborating with our customers to uncover and realize opportunities for improving quality, efficiency, and outcomes. With more than 2,000 employees globally, we have major offices