The Ctrack Vehicle Tracking Survey 2011 was
conducted amongst 250 fleet influencers and
decision makers within the UK who are
responsible for car, van, truck or mixed fleet
operations.
The survey is designed to provide insight into
the uptake of vehicle tracking amongst
UK-based businesses, how the technology is
being used, what benefits are being
achieved and what barriers are preventing
more companies adopting a solution.
EXECUTIVE SUMMARY
Key findings include:
l Vehicle tracking is becoming a critical operational tool for many fleets, especially van and commercial
vehicle operators, with more than 70% of those utilising the technology having used it for more than four years.
l Fleet operators are achieving measurable cost efficiencies with significant reductions in fuel usage (8.6%), overtime claims (15.3%) and communications overheads (13.3%).
l The reputation of the vehicle tracking industry is generally good according to 70% of respondents, but some concerns remain around the financial viability of providers, overselling and the reliability of the industry.
l There is still a proportion of fleet operators not currently using vehicle tracking that are unconvinced about the potential benefits, but more than half of those yet to adopt the technology believe it can provide return on investment.
l Fuel costs and pressures to reduce operational overheads are currently the key challenges for a large number of fleet operators, with many using vehicle tracking to help overcome these issues.
Key findings in the report included:
There is considerably greater use of vehicle tracking for vans,and to a lesser extent heavy goods vehicles, than cars according to the respondents utilising the technology. In fact, four fifths of respondents tracked vans compared to just a third for cars, perhaps reflecting a more established and proven business case for van operators. Elsewhere, there still remains a low level of uptake for unpowered assets such as trailers and plant. (Fig 1)
The findings suggest that vehicle tracking has become embedded within many companies’ fleet operations, with over 70% having used the technology for more than four years and almost 5% for over 10 years. Just under 5% of fleets have adopted vehicle tracking in the past 12 months representing continued year-on-year growth in uptake. Meanwhile, the advances in the functionality of web-based tools, combined with the affordability of this type of system when compared to server-based solutions, has meant that they now account for more than half of all active tracking systems. A further 25% of tracking solutions now use a combination of server-and web-based systems, often to achieve added flexibility and support multi-user requirements. (Fig 2)
It seems that fleet operators are increasingly combining their tracking solutions with in-vehicle tools to maximise the operational performance of the system. In
particular, integrated satellite navigation is now used in 53% of all tracking systems to support improved routing, reduced mileage and enhanced workflow. Elsewhere, Driver Identification (24%), handheld PDAs or terminals (7%) and panic alarms (7%) are also being utilised to a lesser extent.
In addition, many companies are integrating vehicle tracking with other back office management systems in order to streamline their operations and automate internal processes. (Fig 3)
37%
3%
33%
4%
9%
37% 13%
11%
Fleet
Supply chain
Workflow
Contract
Fuel
Routing & scheduling
Personnel/HR
Accounting
34%
82% 53%
4%
7%
2%
Car
Van
Commercial vehicle
Trailers
Plant
Other
1
The adopters
Figure 3
Integration with back office
management systems
(% of VT users)Figure 2
Tracking system types in use
(% of VT users)
Figure 1
Tracked assets and vehicles in the UK
(% of VT users)Web-based (access via the Internet with no software) 55.4%
Server-based (access via software on internal IT system)
19.6%
Mix of both
In terms of the primary purpose for using vehicle tracking, productivity (36%), cost reduction (16%), asset management (15%) and customer service (14%) are the most common reasons, although security, health and safety and legislative compliance also featured in the responses. However, fleets are now achieving a wide range of business and operational benefits that are delivering real return on investment. (Fig 4)
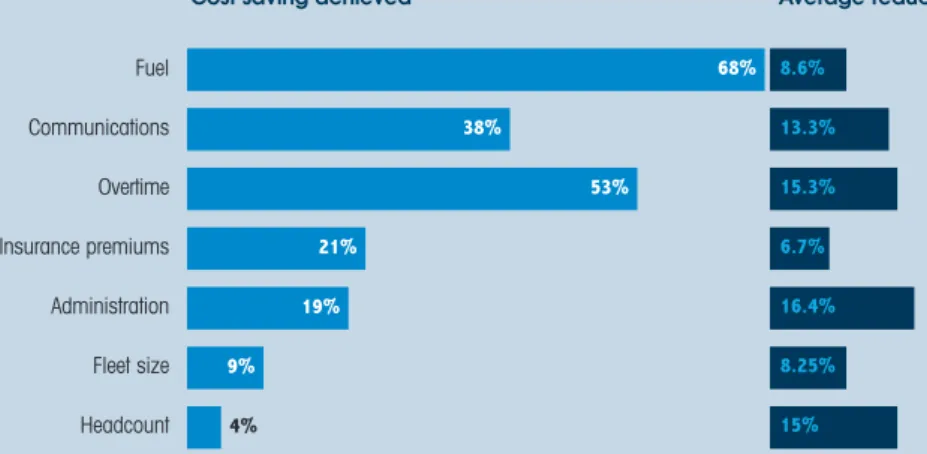
Of the respondents that stated that their fleet operations had achieved reduced costs, a wide range of savings are consistently being achieved. For example, more than two-thirds have lowered fuel costs by an average of 8.6%, whilst over half have reduced overtime claims by an average of 15.3%. (Fig 5)
2
Vehicle tracking in action
1%
9% 12%
33% 13%
No value added to the business
Meeting tender requirements
Reduced environmental impact
Improved duty of care
Reduced accidents
47%
Added understanding of driver behaviour
46%
Increased security
43%
Proof of delivery or completion of work
17%
Greater business insight
42%
Improved customer service
43%
Enhanced workflow management
59%
Increased productivity
70%
Reduced costs
Figure 4
Business and operational benefits
(% of VT users)68% 38%
53% 21%
19% 9%
4%
Fuel
Communications
Overtime
Insurance premiums
Administration
Fleet size
Headcount
8.6% 13.3% 15.3% 6.7% 16.4% 8.25% 15%
Figure 5
Operational savings
(VT users that have reduced costs)In the main, businesses are satisfied with their vehicle tracking partner, with 83% saying they are happy with the service and technology provided by their current supplier. In fact, more than three quarters of those using vehicle tracking have only used a single provider to date. (Fig 6)
However, more than one in five fleet operators have used multiple providers with some having switched as many as five times. Of those that have used more than one tracking company, 60% have changed in the past two years, whilst a further 32.5% have switched in the last three to five years. There are a mix of reasons for businesses changing their tracking partners, with the most common being linked to poor service delivery (37.5%). Other reasons included cost (15%), functionality (15%), supplier went out of business (15%) and technology (12.5%).
Meanwhile, when asked about the reputation of the vehicle tracking industry, 70% of all respondents thought it was good. Despite this seemingly positive perception, more than 40% of those not using tracking technology disagreed and believed the sector overall had a poor image. The main reasons for this was the financial viability of providers (34%), reliability (25%), overselling (21%) and credibility of technology (18%). (Fig 7)
3
Vehicle tracking industry
74% 26% 57% 43%
70% 30%
VT user
Non-VT user
Overall
Figure 6
Number of tracking partners used
(% of VT users)
Figure 7
Reputation of vehicle tracking industry
(%) Good Bad1 77.7%
2–3
18.5%
4–5
3.3%
>5
28% 10%
17% 28% 15%
No benefits
Meeting tender requirements
Reduced environmental impact
Improved duty of care
Reduced accidents
39%
Added understanding of driver behaviour
35%
Increased security
33%
Proof of delivery or completion of work
20%
Greater business insight
26%
Improved customer service
25%
Enhanced workflow management
35%
Increased productivity
39%
Reduced costs
Figure 9
Potential benefits of vehicle tracking
(%) The respondents outlined a range of reasons that werepreventing them from adopting vehicle tracking with almost 30% claiming it did not meet business or operational needs. Other reasons include lack of budget (18.8%), too expensive (8.7%), need for more information (8.7%) and employee concerns (5.8%).
Despite reluctance amongst some fleet operators, 57% believed that vehicle tracking did offer return on investment and 86% were familiar with the benefits the technology can achieve. When asked how vehicle tracking could help their fleets, the respondents gave a range of benefits, with
reduced costs, increased productivity, enhanced security and added understanding of driver behaviour coming out top. (Fig 9)
Amongst those respondents not using vehicle tracking within their fleet operation, 64% had previously considered using the technology and 51% believed that it could benefit their business. This split in the perceived value of vehicle tracking is further underlined by the expected timescale for the
adoption of the technology. Almost 45% of these respondents thought they would implement a tracking solution within two years, whilst just under 50% had no plans to do so in the next five years. (Fig 8)
4
The non-adopters
23.1% 21.8%
5.9%
21.7% 27.5%
<1 year
1–2 years
3–5 years
>5 years
Never
5
Related fleet issues
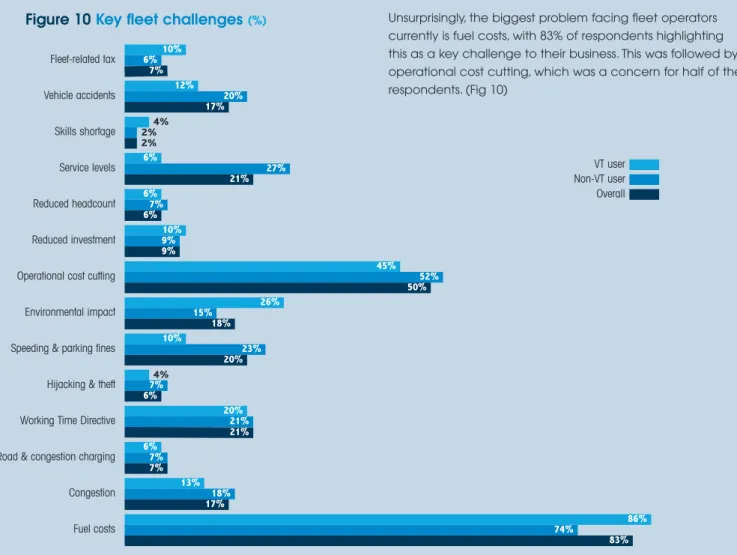
Unsurprisingly, the biggest problem facing fleet operators currently is fuel costs, with 83% of respondents highlighting this as a key challenge to their business. This was followed by operational cost cutting, which was a concern for half of the respondents. (Fig 10)
The difficult economic climate has had a mixed impact on fleet operations with more than half believing it has had a negative impact. In particular, only 15% had seen their fleet budget increase during 2011, with the remainder
experiencing a reduction or staying the same. However, 46%
of respondents overall thought telematics could help them overcome the challenges caused by the downturn, although this percentage dropped dramatically amongst those not currently using vehicle tracking to just 26%. (Fig 11)
Figure 10
Key fleet challenges
(%)10% 6% 7% Fleet-related tax 12% 20% 17% Vehicle accidents 4% 2% 2% Skills shortage 6% 27% 21% Service levels 6% 7% 6% Reduced headcount 10% 9% 9% Reduced investment 45% 52% 50%
Operational cost cutting
26% 15% 18% Environmental impact 10% 23% 20%
Speeding & parking fines
4% 7% 6%
Hijacking & theft
20% 21% 21%
Working Time Directive
6% 7% 7%
Road & congestion charging
Non-VT user Overall VT user 13% 18% 17% Congestion 86% 74% 83% Fuel costs Yes No Increased Decreased Stayed the same
Do you think your telematics systems could help you to overcome the fleet challenges created by the financial crisis and economic downturn?
50% 50% 28% 72% 46% 54% VT user Non-VT user Overall
What has happened to your fleet budget in 2011?
25% 23% 52%
26% 29% 45%
25% 25% 50%
VT user
Non-VT user
Overall
Has the financial crisis and economic downturn had a negative impact on your fleet operation?
53% 47% 54% 46% 53% 47% VT user Non-VT user Overall
Figure 11
6
Breakdown of respondents
Logistics & road transport Service management Utilities Facilities management Local
authorities Construction Manufacturing
Figure 12
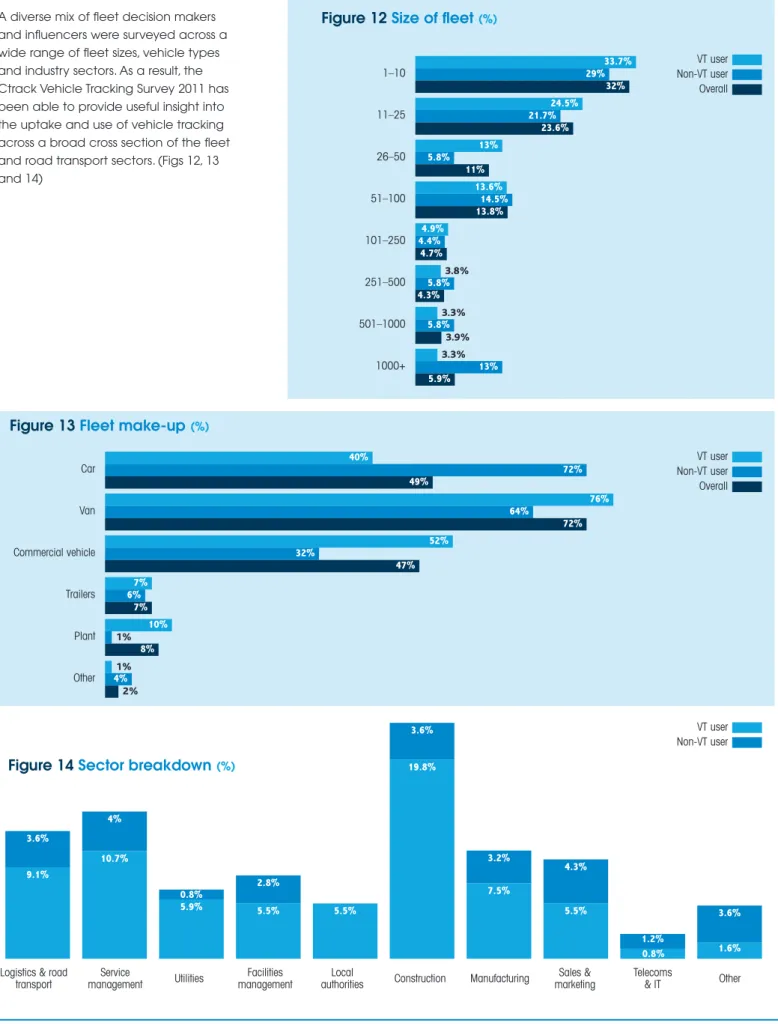
Size of fleet
(%)33.7% 29% 32% 1–10 24.5% 21.7% 23.6% 11–25 13% 5.8% 11% 26–50 13.6% 14.5% 13.8% 51–100 4.9% 4.4% 4.7% 101–250 3.8% 5.8% 4.3% 251–500 3.3% 5.8% 3.9% 501–1000 3.3% 13% 5.9% 1000+ 40% 72% 49% Car 76% 64% 72% Van 52% 32% 47% Commercial vehicle 7% 6% 7% Trailers 10% 1% 8% Plant 1% 4% 2% Other
Figure 13
Fleet make-up
(%)Figure 14
Sector breakdown
(%)Non-VT user Overall VT user Non-VT user Overall VT user Non-VT user VT user 9.1% 3.6% 10.7% 4% 5.9% 5.5% 2.8% 5.5% 19.8% 3.6% 7.5% 3.2% 5.5% 4.3% 1.2% 1.6% 3.6% Sales & marketing Telecoms
& IT Other
A diverse mix of fleet decision makers and influencers were surveyed across a wide range of fleet sizes, vehicle types and industry sectors. As a result, the Ctrack Vehicle Tracking Survey 2011 has been able to provide useful insight into the uptake and use of vehicle tracking across a broad cross section of the fleet and road transport sectors. (Figs 12, 13 and 14)
0.8% 0.8%