SAP Corporate Performance Monitor (CPM) is an application that integrates the information coming from all different SAP modules into a well-known managerial system, the Balanced Scorecard (BSC). According to Arthur Schneiderman, a Balanced Scorecard is:
“A systematic approach for marshalling an organization's limited resources around a manageable set of activities that will assure achievement of its stock-holders’ collective aspirations”
Using the foundations developed at Analog Devices (ADI) and with the improvements created by Norton and Kaplan (1996), SAP combines this knowledge into a powerful tool that links the theoretical and practical imple-mentation of a Balanced Scorecard with SAP CPM. This chapter explores the basic functionalities available in CPM.
SAP CPM can be used as a standalone application without interacting with other system platforms or it can be integrated with data and information from different SAP modules. The capabilities and potential of SAP CPM allows interactions with other platforms such as: Business Intelligence (BI), Finance (FI), Controlling (CO), Materials Management (MM), Supply Chain Management (SCM), Supplier Relationship Management (SRM), Human Resource Intelligence (HRI) and others. SAP BW is the main communication interface that allows for the sharing of and access to the information coming from the different modules. This can be displayed in the different graphical environments.
Companies are complex systems; therefore, managers can lose focus on the basic strategy of the company and fail to create value for its customers, share-holder, and its employees. Similarly, having an integrated computer system that controls and supports management to simplify the collection of infor-mation of key processes is a very valuable tool.
3.1
The Balanced Scorecard Model using SAP CPM
SAP technologies must perform and adjust to new and demanding internal and external challenges in different industrial sectors, and the modules not only must be integrated to deliver information but also strategically man-aged to achieve a common purpose. These pressures affect the performance, planning, processes, and the way companies achieve its strategic objectives. SAP CPM supports these concerns, providing a powerful way to translate the strategy into action, achieve focus, improve resource allocation, control risks, and balance all those requirements with a flexible and adaptable tool. SAP has two different types of implementation approaches: managerial and systems.
3.1.1
Managerial Approach
This approach addresses the basic functionalities or generic needs that the system must address to create value to the organization and return tangible results to management.
Ultimately, every SAP project has allocated resources, time frames, require-ments, and managers that want results at the end. This is the purpose of the initial Blueprint and the Project Management meetings, to make sure that those expectations are achieved and maintained.
Both the Managerial and Systems approaches are required in SAP CPM to configure the system and it also guarantees that the different SAP projects deliver real benefits to the company. SAP CPM supports high-level decision making to provide tools to reduce the pressures coming from outside and inside the company. The use of the BSC helps to provide the required strate-gic focus and control.
The constant requirements of governmental agencies, such the Sarbanes-Oxley Act, are an important part of corporate responsibility that has been added to the equation. The latest financial scandals have affected many employees and shareholders, and have influenced the way companies do business around the world.
How do you, as a manager, see the forest for the trees? How should you ensure that there is continuous improvement in your products and pro-cesses? How do you balance this improvement while maintaining profitabil-ity in your global operations, with satisfied employees and customers and with stakeholder confidence in long-term earnings?
SAP R/3 and all its components guarantee that information flow inside and outside the corporation runs smoothly and that there are no holes that com-promise financial reports, budgets and strategic planning. SAP CPM addresses these needs with the integration of the SAP platform with Strategic and Performance Management with multiple tools to support the process of translating strategy into action.
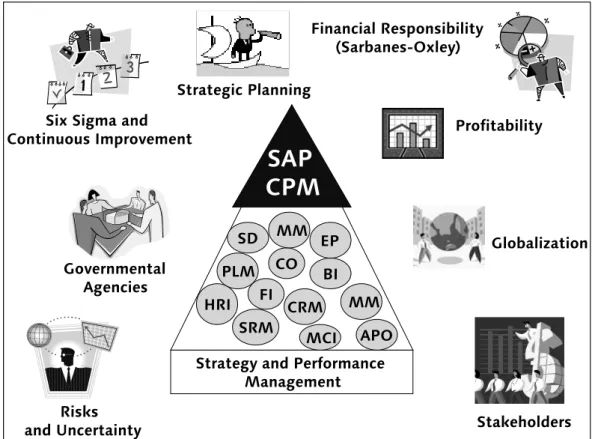
Some of the pressures that a company is exposed are analyzed in Figure 3.1. In Figure 3.1, SAP is at the center of the organization providing information to fulfill all external and internal pressures to satisfy different entities inside and outside the company.
In this way, SAP CPM gives the direction to where all the SAP architecture has to be directed based on the managerial insights coming from top-level management. All the factors shown in Figure 3.1 are general and can be con-sidered as the main elements that drive the performance of any multina-tional corporation.
The SAP platform is continually exposed to all these factors shown in Figure 3.1, and they affect the new requirements and satisfaction of Management with the resources allocated, information, and data generated from the
dif-Figure 3.1 SAP CPM Managerial Approach Model
Financial Responsibility (Sarbanes-Oxley)
Strategy and Performance Management Six Sigma and
Continuous Improvement Profitability
Stakeholders Risks and Uncertainty Strategic Planning Globalization CRM FI BI SRM HRI EP APO CO MM SD PLM MM
SAP
CPM
MCI Governmental Agenciesferent SAP systems in the long run. Strategy and Performance Measurement direct the development of the SAP platforms inside the organization, and all its factors continuously influence the new requirements.
SAP CPM requires not only technical but also managerial expertise and a broad knowledge of the company’s core processes to deliver value and sup-port the strategic processes. All these efforts are driven by a coordinated and organized Strategic and Performance Measurement System using the Bal-anced Scorecard.
3.1.2
Systems Approach
This approach is related to the traditional flow of information of any mana-gerial software application and focuses on how information is extracted, transformed, and shared with other users and systems inside the SAP Archi-tecture.
Let us look at the Systems Approach that was referred to in Section 3.1. This approach reveals the tools available to managers to achieve strategic results as long as corporations have implemented an efficient and realistic process that translates the strategy into action inside with the appropriate leadership, resources, and technology levels.
Figure 3.2 SAP CPM Systems Approach
Strategi
c Resu
lts Strategic
Focus CorporateResults Successful Products and Processes Increase Shareholder Value Strategi
c SAP Platfo
rm Satisfied Customers Productive Workforce Strategy Management Performance Measurement HR Integration HR Integration Strategy Builder
SAP CPM
Financial ResponsibilityThe strategic structure of the SAP CPM platform allows any organization to achieve the results in the upper section of Figure 3.2, as long as the imple-mentation was been correctly coordinated and supported by top manage-ment. The Balanced Scorecard process is a mature and high-level managerial tool that can support the long-term and short-term goals of any organization. Remember that the SAP CPM functionalities and the BSC by itself do not guarantee the millions of dollars in cost reductions that every manager expects with almost no resources!
The underlying strategic process behind SAP CPM determines how an orga-nization creates, controls and achieves strategies, objectives, and measures that manage its core competencies. However, tools by themselves do not generate the strategic results displayed in Figure 3.2, only the way that a company utilizes these tools to improve the strategic feedback and continu-ous improvement is how results are generated.
Some of the key tools that are explored within the present textbook are shown in Figure 3.2 such as the Value Tree, Strategy Maps using the Strategy Builder, Measure Builder to identify and establish relationships of specific performance drivers that affect the organization at different levels, and the Balanced Scorecard and Management Cockpit to present information and provide a feedback system to monitor and determine the key processes in the organization rapidly.
Note that SAP CPM will support the decision-making processes with a struc-tured and well-defined platform to deliver strategic information with clear assigned responsibilities and during specifics time frames.
In the next section, we will review in more detail the Strategy and Perfor-mance Measurement modules that integrate SAP CPM, and they are the core components to either implement the Balanced Scorecard or the Management Cockpit.
3.2
SAP CPM Components
Figure 3.3 provides the first look at the different components of SAP CPM including the menus and objects for the Strategy Management and Perfor-mance Measurement modules to be studied in this book. These two modules are reviewed in more detail in the following sections, and provide a com-plete overview of the different components that integrate the SAP CPM application.
Let us now take a closer look at these two modules.
3.2.1
Strategy Management and Its Components
This module specifically creates the Balanced Scorecard structures. These are highly structured and organized strategic frameworks that translate strategy into action and are based on the concepts developed by Norton and Kapplan (1996).
The Strategy Management module is where the BSC elements are created and displayed as shown in Figure 3.4. It consists of 10 objects or submenus that allow you to access different configuration and presentation screens to create a Balanced Scorecard framework. However, depending on your role in the implementation and the level of authorization granted by your system administrator, it is possible that not all the objects displayed in Figure 3.4 are available to you.
Each of these objects deliver a specific functionality to improve the strategic visualization and clarification of the different processes involved in the con-struction of a Balanced Scorecard. However, only the most important objects are discussed in this book since some of them provide capabilities that go beyond the scope of this material.
The Strategy Management module of SAP CPM is exclusively for Scorecard monitoring and construction, and allows the user to interact with other SAP components such as: Human Resource (HR), Business Information Ware-house(BW), Controlling (CO), and Financials(FI). Specifically, the Strategy Management menu, or submenu since it is part of SEM, is the area where Perspectives, Strategies, Objectives, Measures, and Initiatives for one or many Scorecards are built.
The Balanced Scorecard Launchpad and the Balanced Scorecard Wizard pro-vide a web-oriented application to create and display the same functional-ities as the Graphical User Interface (GUI) environment. This book focuses on use of the GUI functionalities rather than reviewing the SAP Web Appli-cation Server (WAS), since both provide similar capabilities. Figure 3.5 gives a brief overview of the contents of the Balanced Scorecard Wizard.
MyBalanced Scorecard
MyBalanced Scorecard is essentially an object that defines a default view. This object accesses the SAP CPM presentation mode inside the GUI
environ-Figure 3.4 Strategy Management Menu Components
ment, and allows the user to predefine a default view of a Scorecard. This functionality allows establishing a link or a shortcut to a particular Scorecard, so every time the user clicks on MyBalanced Scorecard object the selected Scorecard view is displayed automatically without the need of performing any type of navigation or additional steps.
This functionality is quite useful for a user who would simply like to display the Scorecard that he or she is involved to improve or maintain. In compar-ison, the object Balanced Scorecard provides a similar environment to MyBalanced Scorecard, but does not display the default view and additional navigation steps are required.
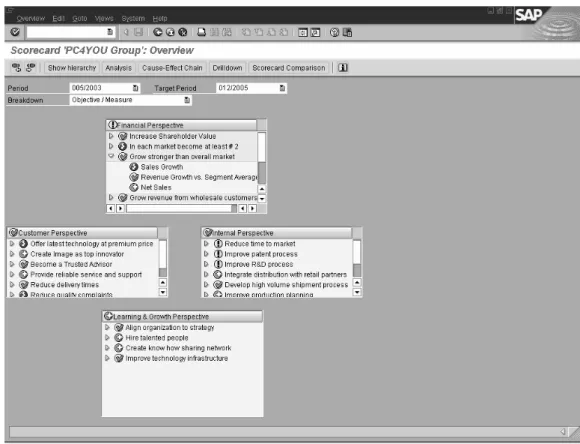
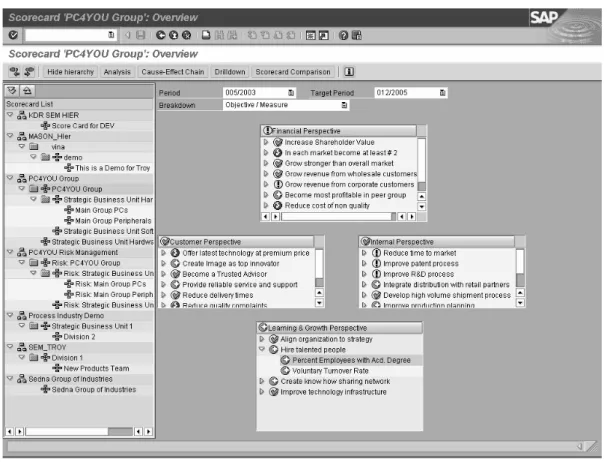
Review the functionalities of this application by double-clicking on MyBal-anced Scorecard in the Strategy Management menu, and select the PC4YouGroup from the SAP IDES platform, as displayed in Figure 3.6.
As seen in Figure 3.6, the screen presented can be used to display informa-tion related to strategies, goals, measures, graphic status of budget and quar-terly reported measures, and much more. Feel free to navigate and get famil-iar with the environment. For example, if you have an IDES platform available, follow these steps:
Figure 3.6 MyBalanced Scorecard View for Demo Scorecard PC4YOU Group
Perspective
Objective
1. Select the Learning andGrowthPerspective. 2. Choose the Objective HireTalentedPeople.
3. Select the measure PercentEmployeeswithAcd.Degree and double-click on it.
4. See the clock displayed at the bottom left corner of the screen in Figure 3.6 indicating that the BWTransaction Data is being read.
5. Review the information contained inside the measure
After double clicking on the measure a similar window as shown in Figure 3.7 is displayed, as long as the configuration was performed correctly. Notice the different components that define a measure such as the chart, the data at the bottom of the chart, period buttons to limit the data display for a specific time frame, and additional drop-down menus to navigate with different chart displays.
Review other examples available in your SAP CPM system that have similar characteristics to this Scorecard. If you do not have access to the SAP IDES demo platform, simply reviewing the screen of Figure 3.7 should be suffi-ciently clear, as you will be creating something similar in Chapter 4.
Figure 3.7 Reviewing the Information of a Measure
1
2
3 4
Now suppose the display settings for the chart available in Figure 3.7 have to be displayed in another chart type such as Bar or Columns chart that was cre-ated for this particular measure and it is available to be selected by the user. For this let us say that we want to see another chart previously configured in our measure in the PC4YOUGROUP Scorecard. Follow these steps to review and display any additional charts available for a measure:
1. Go to the Graphic List seen in Step 1, Figure 3.7.
2. Select the second chart available in the measure seen in Step 2.
3. The new chart should be displayed on your screen, and depending on the type selected or configured, the complete data set displayed in Step 3 is also graphed.
4. Review the new chart, if any, on your screen, Step 4.
Figure 3.7 showed how the information displayed in a Measure can be cus-tomized to meet more advanced graphic requirements and provide a clear overview of the measure, its status, score, and values during a selected time frame. It is also possible to attach BW Reports, Planning Layouts, Value Driver Trees, and Measure Trees depending on the function of the measure and its interaction with other structures.
The functionalities for each of the above menus are described in more detail in the sub-sections that follow.
Views
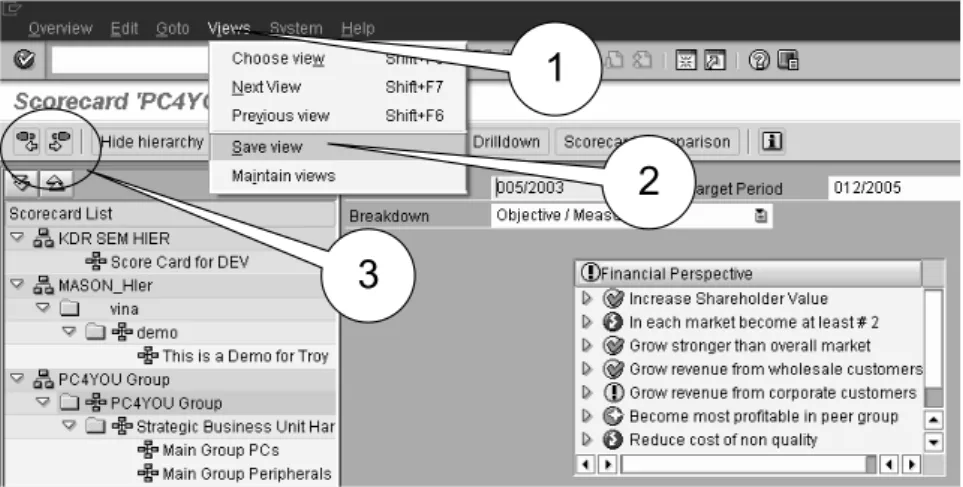
These buttons allow you to move within the available views with two options: previous and next. To save a view, simply click on the Views menu on the SAP window as shown in Figure 3.8, and select SaveView. Follow the options and save the view as DisplayViewforPresentation. Now go back to the Views menu, and select Choose View to see any previously saved views and the one we just created. To navigate between views, simply use the icons or go to Views in the SAP menu:
1. Click on Choose View Step 1.
2. Select DisplayViewfor Presentation Step 2.
Note
It is important to recognize the different menu options within any complete Score-card. These menus are displayed on the top of Figure 3.7. Take your time to navi-gate and understand the differences and functionalities for each of them.
3. Click the check mark icon to display it, as shown in Figure 3.8 Step 3. 4. Review the created view and note that the left-hand side columns that
display the Scorecard list are hidden, as shown in Figure 3.9.
To retrieve this information again, simply click on the Show Hierarchy but-ton, shown on the top of the Balanced Scorecard structure as shown in Fig-ure 3.9.
Finally use the Maintain Views option from the View menu to explore the settings of the view and/or modify its order, rename, and delete the view.
Figure 3.8 Using the Views Menu
Figure 3.9 Saved View Display View for Presentation
1
2 3
Overview
Click on the Show Hierarchy button to reset the Scorecard to its standard display view as shown in Figure 3.10. In other words, this view can be con-sidered as the home menu of this screen.
Analysis
This button allows the user to access the window shown in Figure 3.11. With this option, the information stored in the value fields such as Trend, Assess-ment, Score, From, To, and others, that can be analyzed based on their status using colors.
These graphic indicators become quite useful when many measures and val-ues have to be analyzed and compared. For example, the trend indicator linked to a value field is displayed based on the variation in time within a predefined range. It can quickly provide information to the user if the values are increasing, decreasing, or constant.
Cause-Effect Chain
This menu performs exactly what its name stands for, Cause-EffectAnalysis over a Scorecard structure. In comparison with the previous menu, Figure 3.12 provides a detailed view of the relationships between Perspectives, Objectives, TriggeringObjectives, and their Status.
Cause-Effect Chain is a high level analysis of the different Scorecard struc-tures. Detailed coverage of this analysis is outside the scope of this book.
Figure 3.11 Analysis Menu in the Balanced Scorecard Menu
Figure 3.12 Cause-Effect Chain Window
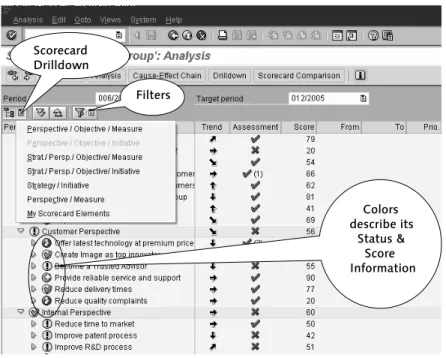
Scorecard Drilldown
Colors describe its
Status & Score Information Filters
Drilldown
This menu provides the drilldown functionality applied to the Scorecard ele-ments. As shown in Figure 3.13, the drilldown menu has different options to display the information contained in a Scorecard.
If the object does not have a previously defined Scorecard structure associ-ated with it, an error message appears. This drilldown functionality is basi-cally navigation between different levels of the Scorecard. For example, the drilldown between Scorecard A and Scorecard B is only possible as long as they are linked with a hierarchy.
In another example, if there are two measures A and B, the drilldown func-tionality does not provide a link between measures only between structures. To display such type of information the MeasureTree or ValueDriver Tree can deliver these requirements.
For now, choose the PC4YOU Group Scorecard to perform Drilldown Anal-ysis. Select Percentage of Employee with Accounting Degree and perform the drilldown based on strategies as shown in Figure 3.14.
Figure 3.13 Drilldown Options for Scorecard Elements
Figure 3.14 Drilldown Example for PC4YOU Group
Drilldown based on Strategies
Scorecard Comparison
This menu produces exactly what the name implies: it compares different Scorecards. When performing this functionality, the different elements and value fields from one Scorecard are displayed and can be compared with those of another one. It is quite useful for creating Scorecards and for bench-marking purposes, derived Scorecards, or simply identifying differences between two or more Scorecard structures.
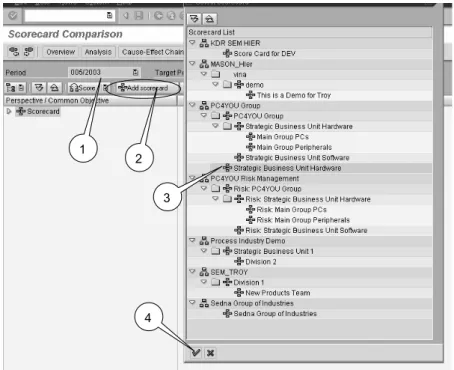
Let us review the IDES Scorecard PC4YOU Group. We’ll add a comparison between this structure and Strategic Business Unit Hardware, a structure at a lower level, as shown in Figure 3.15. The additional Scorecard is added as a column next to our current PC4YOU Group Scorecard as shown in Figure 3.15, and the displayed information can be controlled by using a drilldown operation as shown in Step 1 in the same figure. This drilldown operation allows navigation within any Scorecards related to a higher-level Scorecard, depending on the level of aggregation.
In addition, the Period shown in Step 2 in Figure 3.15 controls the time frames displayed for both Scorecards, and allows the user to restrict the information for a particular time period. However, this comparison can be performed only as long as the Scorecards to be analyzed have the same fiscal year variant information, which is set up at the Scorecard level in the settings options.
Figure 3.15 shows a typical screen for the Scorecard Comparison, and reviews how the Status Indicators (color items) reflect the value based on predefined criteria inside each of the Scorecards. Also, this information accu-rately reflects the status and values of the data values extracted from each DataSource for each Measure. For a Scorecard Comparison you need to per-form the following steps seen in Figure 3.16.
Figure 3.15 Scorecard Comparison for PC4YOU Group and Strategic Business Unit Hardware
1
1. Click on the Scorecard Comparison menu available in the MyBalanced Scorecard or the Balanced Scorecard menus in Strategy Management. 2. Select the time period to compare as shown in Step 1.
3. Click on the Add Scorecard icon as shown in Step 2. 4. Choose the Scorecard to compare as shown in Step 3.
5. Click on the Check icon to accept the selection as shown in Step 4. Perform the same procedure to add any Scorecard to the screen, and com-pare it with another one. Other icons available on this screen are simplified in Figure 3.17. In addition, the Status/Score button changes the displayed values based on the specific criteria to display either the Status or the value of the Score associated with each element of the Scorecard.
Figure 3.16 Working with the Scorecard Comparison
Figure 3.17 Additional Menus Available with Scorecard Comparison
1
2 3
4
Expand Collapse Switch between Status and Score Display Options
Review the information presented in Figure 3.17 to complete the analysis of the Scorecard Comparison screen. Display options provide a type of drill-down to display the contents of each Scorecard with different information. Also, the expand and collapse buttons allow the user to perform exactly that, in order to simplify the data display.
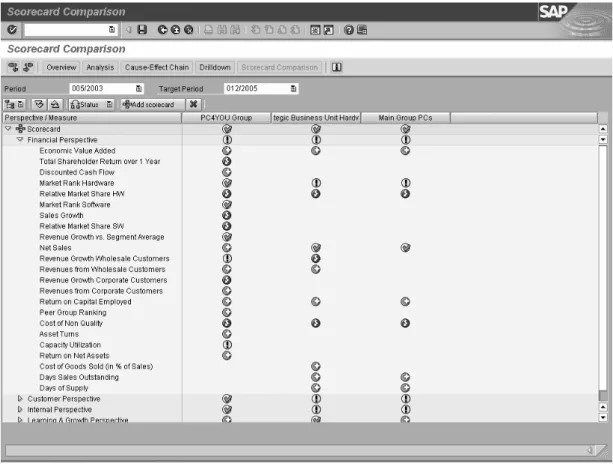
The status/score icon simply changes the display of the data values from one to the other. For example, Figures 3.18 and 3.19 provide the same informa-tion with either status or score data. The Score values simply show the results that caused the Status (graphic indicator) to appear with the desig-nated color.
The final result of the ScorecardComparison procedure is displayed in Fig-ure 3.20, evaluating the results of three different Scorecard StructFig-ures: PC4YOUGroup, StrategicBusinessUnitHardware, and MainGroup PCs.
Figure 3.18 Displaying Status Information
Figure 3.19 Displaying Score Information
Note
For each Scorecard the detail is shown based on the Display option Perspec-tive/Measure, presenting each Perspective and the number of measures associ-ated to each Scorecard underneath to Perform the comparison based on Status. Not all Scorecards have the same Measure, but information is shown indepen-dently for each Measure as seen in Figure 3.20.
Status
Now that the important aspects of the MyBalanced Scorecard menu have been covered, let’s examine this important question. Why is there a MyBal-anced Scorecard and a BalMyBal-anced Scorecard option in the Strategy Manage-ment menu? The answer is simple: The MyBalanced Scorecard menu allows you to select one of the created views and make it a default.
With this default view in place, every time you click on MyBalanced Score-card, in the Strategy Management menu, the displayed information main-tains the standard view. This functionality is quite useful especially in the Production Environment when a manager simply needs to quickly navigate and review the status of specific parts of the Scorecard and nothing else. To create the default view associated with MyBalanced Scorecard perform the steps which are displayed in Figure 3.21:
1. Go to Views as shown in Figure 3.21, Step 1. 2. Select SaveView, Step 2.
3. Now, having a default view does not mean that the other views are unavailable. Use the previous and next icons shown in Step 3 in Figure 3.21 to move between Views, or simply go to the Views menu, and select
Choose View to specifically access a View’s name. Use the MaintainView option in the Views menu to manage and delete any unwanted informa-tion.
4. The screen displayed in Figure 3.22 is displayed, so you can save the cur-rent screen as a View, and to give it a name.
5. Select the check box as shown in Figure 3.22 to assign the view as the Per-sonal DefaultView for MyBalanced Scorecard. (The next time you access MyBalanced Scorecard, this default is displayed.)
6. Save the View, and try it out to see the results.
With these elements we conclude our discussion about Views. Remember, views are default screenshots or shortcuts to selected screens inside the Bal-anced Scorecard presentation environment. You can create, customize, mod-ify, delete, or rename any of the Views generated in this section.
Balanced Scorecard
In comparison with MyBalanced Scorecard, this menu has the same options, with one difference: there is no Default View.
Figure 3.21 Creating a Personal View
Figure 3.22 Default View
1
2
3
Strategy Templates
CPM provides a list of available templates that can be used as a reference to develop similar Scorecards, or as reference for finding measures and their definition to integrate them with new Scorecards. To access the Strategy Templates simply select the object with the same name as shown in Figure 3.23 from the Strategy Management menu.
Figure 3.23 Setting up a Default View
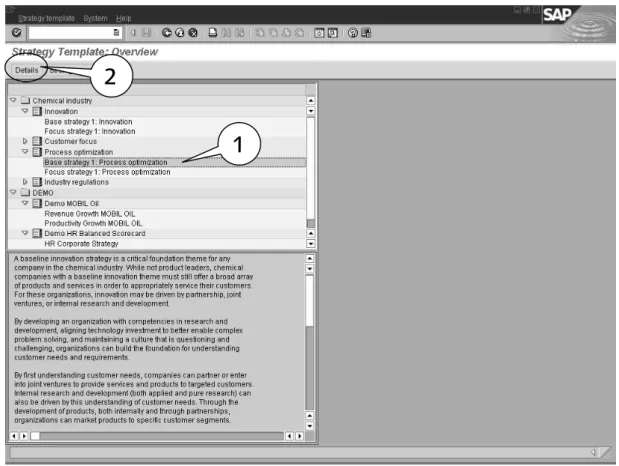
After double clicking on the Strategy Templates object shown in Figure 3.23, a list of Business Content or predefined SAP material is available with infor-mation for different industrial sectors to guide and support any implementa-tion. For example, identify the following information inside the Strategy Template: Chemical Industry 폷 Innovation 폷 Base Strategy 1 Innovation. Then click on Details on the upper part of the screen as shown in steps 1 and 2 in Figure 3.24
After accessing the Details menu in Figure 3.24 there is an extensive expla-nation of Strategy 1. Use the Business Content to support any similar proc-esses inside your company, or add this information into your Scorecard structures and modify it.
Review with more detail the measures associated with the selected strategy in Figure 3.24 and note that the Measure can be executed by clicking on the icon shown in Figure 3.25 to access the information related to the measure coming directly from the MeasureBuilder, to be reviewed in Chapter 4.
Figure 3.24 Reviewing SAP Business Content
Figure 3.25 Reviewing and Executing Default Measures
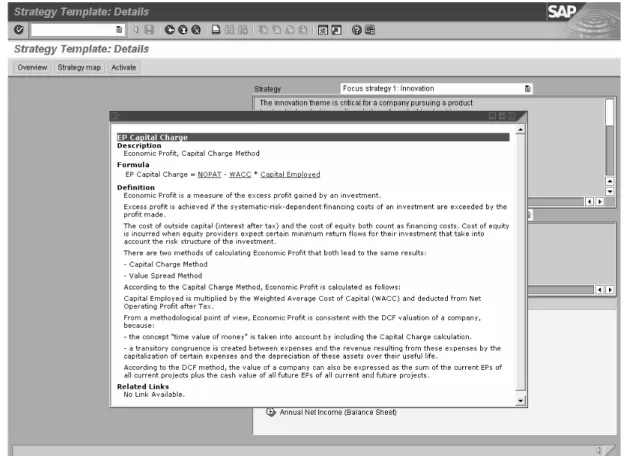
If the Measure, Economic Profit, Capital Charge Method, can be used as a reference for the implementation of SAP CPM in your project, review its def-initions by double-clicking on its name. The screen displayed in Figure 3.26 shows the contents of the Measure when double-clicking on its name and describes how the Measure is calculated based on other Measures.
1
2
Execute Button
Figure 3.26 Accessing Measure Definitions
Now, let us execute the selected Measure by clicking on the clock icon as seen in Figure 3.25, and review the information presented in Figure 3.27. Notice that the Measure is contained in a SAPMeasureCatalog delivered as part of the SAP Business Content. A Measure Catalog describes and groups the different measures with a common classification, and works similarly as a Scorecard Hierarchy. The Measure Catalog can be considered to be the center of SAP CPM, and without a good definition of measures and catalogs, there is no data. It is impossible for SAP CPM to function without Measure Catalogs and this topic is extensively discussed and reviewed in Chapter 4.
Figure 3.27 Reviewing SAP Business Content Catalog
1: SAP Measure Catalog
2: Measure
3: Measure Configuration
Now, let us suppose that the EconomicProfit Measure contained in the SAP Business Content Catalog has to be transferred to a real Scorecard. In this case, go back to the original Strategy Templates window and perform the following steps:
1. Select the Strategy that contains the measure of interest. In this case, the measure EconomicProfit is included inStrategy 1 (Figure 3.28, Step 1).
2. Click on the Activate button located at the top of the window as shown in Step 2 in Figure 3.28.
3. The window in Figure 3.29 prompts you to select or create a Target Score-card that will receive the information contained in the Measure for a given LayoutPeriod.
4. If you know which Scorecard to assign the Measure to, simply select the icon shown in Figure 3.29 to find the required object. Otherwise, the Measure appears to be unassigned in the Measure Builder and you can return later on to correct it.
Figure 3.28 Activating a Strategy in the SAP Business Content
Figure 3.29 Identifying the Target Scorecard for SAP Business Content
1
2
Select a Scorecard
5. Select the Scorecard PC4YOUGROUP, as an example and determine the Layout Period when the measure is used in time. Remember this date period because you will need to use it later on to find it in the new Score-card.
6. Click on the Check Mark icon shown in Figure 3.29 to access the screen displayed in Figure 3.30.
7. Select the Measures to be included in the selected Scorecard as shown in Figure 3.30.
8. Click on the Activate button located on the top of the screen in Figure 3.30, to transfer the measure to the selected Scorecard PC4YOUGROUP. 9. Confirm the selections on the screen.
10. The screen called Selection for Activation appears and selects all the checkboxes available. Click on the Execute icon, represented by the clock with a check mark, and move to the next step.
11. The system prompts you for the definition of a CustomizingRequest to move the objects from SAP Business Content into the new location in a real Balanced Scorecard structure as shown in Figure 3.31.
Figure 3.30 Adding SAP Business Content to your Scorecard
Figure 3.31 Creating a Customizating Request
Activate your Measure
Select your Measure here
1: Create 2: Accept the Customizing Request
12. Click on the create icon or the icon on the left-side of the OwnRequest button, to generate the request and click on the check mark icon to con-tinue.
13. The system prompts you with the screen shown in Figure 3.32 to notify you that Activation Completed.
14. Return to Strategy Management 폷 Balanced Scorecard.
15. Review that the Measure was transferred successfully in the chosen Scorecard and linked to the correct Scorecard as shown in Figure 3.33.
16. Ensure the Period layout selected in Figure 3.33 includes the created time frame when choosing the Scorecard.
Finally, with all these steps you will have successfully transferred SAP Busi-ness Content delivered with SAP CPM in the Strategy Templates to be part of any of your selected Scorecards. Now, the big challenge lies in reviewing if your data, structures, and architectures have been constructed correctly and without errors that compromise the performance of your different objects.
Figure 3.32 Activation Completed Prompt
Figure 3.33 Adding SAP Business Content to a Scorecard
Transferred SAP Measure
For this, SAP CPM delivers the Balanced Scorecard Monitor in the Strategy Management module as the main component to perform validations and revisions over your complete Scorecard components and the data being extracted from SAP BW.
The Balanced Scorecard Monitor
This functionality performs a complete check over the different Scorecard elements, including the extracted BW data, Assessment 폷 Status, and sup-ported by different Alerts. This section of the StrategyManagement menu is more oriented towards project managers and developers that keep track and/or perform maintenance or implementation of Scorecards. Some of the functions performed by the BalancedScorecardMonitor can be summarized as follows:
왘 Checking if different users have set the Status for their Scorecard elements
correctly.
왘 Reviewing if the Assessments have been entered for the Scorecard ele-ments.
왘 Checking if the Score values fall above or below the specified limits.
왘 Listing Scorecard elements with a manually set status.
왘 Automatic email to the person responsible of the Scorecard element.
왘 Automatic insertion of tasks in the task list.
왘 Scheduling BW data to be entered into the buffer as a background job.
This information provides a general overview of the processes available with the Balanced Scorecard Monitor. Access the Balanced Scorecard Monitor in the Strategy Management menu, and double-click on it. Review the Balanced Scorecard Monitor on your own, and use the information presented in the Management Cockpit Monitor in Section 3.2.2. However, I recommend applying this functionality until the project is considerably advanced, to monitor the data coming from SAP BW for the appropriate time periods. Also, it is possible to identify any missing information by using the Assess-ment 폷Status button.
Risk Catalogs
Risk Catalogs perform a similar job as the Measure Builder, discussed in Chapter 4, but are specifically created for the Risk Management module. The Risk Catalog is the place where risk measures are created, managed, and inte-grated into the Scorecard.
The indicators contained in the Risk Catalog provide additional capabilities to quantify and evaluate internal or external risks that might affect a Score-card or business unit such as: Economic, Political, Operational, and Strategic Risks. Figure 3.34 gives a general view of the structure of the Risk Catalog, and shows how data is organized using this component of the Risk Manage-ment module that is later explained in Chapter 7.
The Value Driver Tree
The Value Driver Tree is a tool available in SAP CPM to create and monitor measure relationships as shown in Figure 3.35. The Measure Catalog, Busi-ness Planning and Simulation (BPS) and BusiBusi-ness Warehouse (BW) provide the platforms to create, extract, and display information in the Value Driver Tree.
The Value Driver Tree provides a similar functionality to that given by the Balanced Scorecard Launchpad, since it also runs in the Web Application Server (WAS) environment. However, this application can also be accessed in the StrategyManagement 폷ValueDriverTreeDesign menu using the GUI Environment.
The Value Driver Tree is a sophisticated tool available in SAP CPM, and must only be used for advanced implementations of the module when complex cause-effect relationships of the measures need to be identified and quanti-fied.
Design
The design screen is where everything happens, meaning this is where each of the Scorecard elements are created, configured, and assigned to different objects. From a SAP CPM stand point, the Design screen shown in Figure 3.36 is the center of the Balanced Scorecard configuration and provides a quick overview of the main components involved in the creation of a Bal-anced Scorecard object. However, for purposes of this book only the major components of SAP CPM are reviewed. I will leave it up to you to further explore it later.
Our discussion of the Strategy Management module provides a general over-view of the elements that we will reover-view in more detail in other chapters. Also, this part of SAP CPM controls the configuration of Scorecard structures following the theories created by Norton and Kaplan (1996). However, SAP CPM provides an additional component called the Performance Measure-ment module that creates structures similar to those of the Balanced Score-card but with more flexibility.
3.2.2
Performance Measurement and its Components
This component uses the Management Cockpit functionalities to support managerial reviews and displays information with more flexibility for strate-gic feedback and control. In comparison with the Strategy Management module, this module does not follow the Balanced Scorecard concepts but shares many objects that can be reused in this module.
Like the Strategy Management module, the Performance Measurement menu provides additional features to create more flexible structures using the Management Cockpit. The Performance Measurement module provides the Management Cockpit Web Version that runs on the web, as part of the Web Application Server (WAS) as does the Strategy Management module. The information created in the Performance Measurement and Strategy Management modules is independent of each other. Therefore, the same structures created in one cannot be displayed in the other. Both, however, share different components such as the Measure Builder, Risk Catalogs, Time and CPMVariables, and others.
The main difference between the Management Cockpit and the Balanced Scorecard (BSC) is the level of flexibility. While the BSC needs different architecture the same is not true for the Management Cockpit, as it is more structured and maintains the traditional approaches developed by Norton and Kaplan (1996).
Conversely, the Management Cockpit allows the creation of structures with better presentation capabilities than the Balanced Scorecard does, with a higher level of flexibility but limited to three levels of aggregation: Walls, LogicalViews, and Frames. The Performance Measurement module provides five objects or submenus. These are:
왘 Management Cockpit Web Version
왘 Management Cockpit 왘 Measures & Benchmarks
왘 Management Cockpit Monitor
왘 Design
Let us now look at these in more detail.
Management Cockpit Web Version
This application provides the same functionality as the Balanced Scorecard Launchpad, a web environment to build and present different structures. In the same way, since this capability is available in both environments, GUI and WAS, this application can be easily explored by the reader and review its differences.
Management Cockpit
The Management Cockpit is the GUI presentation environment that shows the information of the activated and ready-for-presentation Cockpits. Figure 3.37 presents a general overview of the Management Cockpit presentation environment, and notice on the left-hand side of the screen the Cockpit List. The CockpitList displays the different CockpitHierarchies previously created in the Design component of the ManagementCockpit menu. The Cockpit List displays those cockpits that have been activated and are ready for presenta-tion. For example, let us select the PC4YOUCockpit if you are using the IDES platform and double-click on its name or any available cockpit in your system.
The GUI Cockpit Presentation Environment screen as seen in Figure 3.38 is displayed Use this environment for any presentation meetings to review and analyze the information extracted from the Measure Catalog that contains data, documents, links, and charts.
Figure 3.38 displays Walls, Logical Views, and the Frames, which are the Charts, Links, and/or Documentation, inside the Logical Views. This infor-mation is discussed in detail in Chapter 6.
Figure 3.37 Management Cockpit
Figure 3.38 The Management Cockpit in Presentation Mode
The Cockpit List
Measure & Benchmarks
The Measure & Bencharks is another name by which to access the Measure Builder, the main component to create and define measures inside SAP CPM and add them to the Balanced Scorecard or Cockpit. The user can access the contents of Measure & Benchmarks in two ways:
왘 Via the Performance Measurement menu in the option Measures and Benchmarks as shown in Step 1 of Figure 3.39.
왘 Via the Performance Measurement 폷 Design 폷 MeasureDefinition 폷 Mea-sures as shown in Step 2 in Figure 3.39.
Both procedures access the same object: MeasureBuilder. There is no differ-ence between accessing the Measure Builder in the Strategy Management 폷 Design or in the Performance Measurement 폷 Design menu, because it is simply the same object but with different names.
As shown in Figure 3.40, The Measure Builder is the core component of SAP CPM. Without a correct configuration of the Measure Catalogs, BEx Queries, and DataSources there is simply no data.
Using the Measure Builder, Measures can be arranged in category groups, depending on its family, perspective, or any other classification criteria. On the right hand side of Figure 3.40 is the DataSource tab that identifies the data sources and BEx Queries coming from SAP BW respectively associated with a Measure. For a more extensive analysis of the Measure Builder, please read Chapter 4.
Figure 3.39 Accessing the Measure Builder
Main Menu (Option 1) Design Menu (Option 2)
1
The Management Cockpit Monitor
Like the Balanced Scorecard Monitor, previously discussed in Section 3.2.1, the Management Cockpit Monitor also controls whether the information has been correctly uploaded for each component of the cockpit, and using differ-ent color indicators to display the errors or problems in the structures. Fig-ure 3.41 displays the general steps required to add a Cockpit to the Cockpit Monitor, which are similar to the ones required by the Balanced Scorecard Monitor.
To analyze a cockpit in the Cockpit Monitor follow these steps based on Fig-ures 3.41 and 3.42:
1. Select the ChooseCockpit button as shown in Step 1, Figure 3.41.
2. Select the cockpit from the available Management Cockpits as shown in Step 2, Figure 3.41.
3. Click on the check mark icon to add the Cockpit to the CockpitMonitor to complete Step 3, Figure 3.41.
4. Select the CheckBWDataAvailability button to review the data extraction processes from SAP BW as shown in Step 4.
Figure 3.40 Components of the Measure Builder
Measures
Data Sources
5. Click on the execute icon (clock icon with a check mark). 6. Review the output of Step 4, Cockpit Monitor in Figure 3.42.
Figure 3.41 Analyzing a Cockpit in the Cockpit Monitor
Figure 3.42 Final Output for the BW Data Availability Check (No Errors Found)
1 4
2
Identify any possible errors or problems in the cockpit components for the selected period. Figure 3.42 displays that there are no errors in the system and thus every single component must have a green indicator next to its name. Otherwise, any errors in the structures for a particular time period are displayed as shown in Figure 3.43.
Based on Figure 3.43, the Cockpit Monitor identified that there was a prob-lem with the measure Net Sales Monthly for the Period 006/2005. By dou-ble-clicking on the Measure Net Sales Monthly and reviewing the screen dis-played in Figure 3.43, the system prompts a message box that describes the problem as No Value. In other words, there are no values for the SAP BW data extracted for the selected measure in this particular period.
Design
The Design menu in the PerformanceMeasurement 폷Management Cockpit is as important as the one in the StrategyManagementmodule and is shown in Figure 3.44. This is where the actual cockpits elements are created, config-ured, integrated, and released for presentation.
The most important part of the structure is the object Management Cockpit Design 폷 ManagementCockpit which is the initial area for cockpit creation and definition. Figure 3.44 shows the initial screen of Performance Mea-surement 폷Design. The major components of this are reviewed in Chapter 6.
Figure 3.43 Final Output for BW Data Availability Check (Errors Identified)
1. Measure 2. Problem!
3. Error = Empty Value Range for Selected Time Period
With this complete review of the major components of the two modules of SAP CPM, Strategy Management and Performance Measurement, it is possi-ble to extract additional information from other SAP systems such as FI, CO, BW, and perform additional operations. These elements are briefly discussed in the following sections to provide a general overview of additional consid-erations that might impact the implementation of SAP CPM.
3.3
Integration of CPM with other SAP components
SAP BW is another important part of SAP CPM since it allows you to share Workbooks, Queries, Web Reports, and URLs directly extracted from Info-Cubes. See how SAP BW integrates with CPM in the following sub-sections.
3.3.1
Integration with SAP BW
As shown in Figure 3.45 the DataSource tab allows accessing of the Data-Sources from SAP BW, using the Measure Catalog as the interface. In this way, specific key figures, BEx Reports, Restricted Measures, and Structures that were created in SAP BW, can be selected and transferred into SAP CPM
and linked to a specific measure. Now the importance of the Measure Cata-log is much clearer, because it allows SAP CPM to interact with the rest of the SAP platforms, including the R/3 system, using SAP BW as the source of all data transactions.
3.3.2
Integration with SAP HR
Before assigning objects from Strategy Management or Performance Mea-surement Systems, such as a Scorecard, a Management Cockpit, or a Value Driver Tree to an organizational structure, you need to integrate the HR data from the SAP HR into the SAP CPM system.
Individuals assigned as owners of a Strategy, an Objective, a Measure, or an Initiative, can copy personnel data from the HR System and transfer the per-sonal score of an employee as the result of an assessment to the HR System (as of release 4.5B).
Therefore, an organizational structure, including organizational units, posi-tions and jobs, is distributed from the HR System into SAP CPM System using ALE. In addition, a role is created in your SAP CPM system in place of an employee, which is used to manage the personal data of an employee, such as the business address or personnel number. For additional informa-tion please review the online documentainforma-tion available at help.sap.com related to the HR system.
3.3.3
Integration with SAP Financials: FI/CO, BPS, and BIC
From the different components that integrate mySAP ERP Financials you can integrate them with SAP CPM using SAP BW as the interface. Many data extractors are available to export data coming from those modules, and transfer it into a SAP BW Cube.
An example is the linking of information directly from R/3 using a Data-Source extracted using CO-PA, CCA, or generic R/3 extraction. The most common is CO-PA to transfer information coming from the FI/CO applica-tion to perform profitability analysis. Also, SAP BPS and BIC provide allow you to interact with BW.
However, the update routines or the frequency that the core data is run is a major issue, especially with financial information that is time sensitive, so make sure to consider these elements before integrating information from MyFinancials in SAP CPM.
3.4
Drilldown Applications in the Management Cockpit
The concept of drilldown in the Management Cockpit differs from that of the Balanced Scorecard. Figure 3.46 reviews the previous drilldown performed in a Balanced Scorecard application using the Drilldown for button to access the different options.
1. Select the Drilldown button, as shown in Step 1 of Figure 3.46. 2. Select the criteria to be displayed as seen in Step 2.
Figure 3.46 Drilldown in the Balanced Scorecard System
1
For the ManagementCockpit the drilldown process has two options:
왘 Perform a regular navigation inside the different Cockpit structures by
expanding and collapsing the different Walls, LogicalViews, and Frames as shown in Figure 3.47.
왘 Set up a dynamic drilldown process based on selected characteristics that can be changed during presentation time at the Frame level.
The structure presented in Figure 3.47 should be familiar since it is the de-sign view of any Management Cockpit. The structure presented in Figure 3.48 enhances the navigation capabilities based on a set of characteristics that the user is allowed to modify at the Frame level during Presentation Mode. To configure the Dynamic Cockpit Drilldown Settings illustrated in Figure 3.48 follow these steps:
1. Go to PerformanceMeasurement 폷Design 폷Management Cockpit.
2. Select any of the activated cockpits ready for presentation (Step 1 in Figure 3.48).
3. Choose the Drilldown Settings button shown in Step 2, Figure 3.48.
4. In Step 3 the Drilldown Settings window is displayed.
5. The available characteristics are displayed and can be added to the Frame. 6. Click on the characteristics to perform the drilldown during presentation
time at the Frame Level.
7. Choose the characteristics available from the left hand side and move them to the right hand side as shown in Step 4 in Figure 3.48.
8. Identify if the drilldown settings are applicable to only one single cockpit or to all the available cockpits as shown in Step 5 in Figure 3.48.
9. Save your changes.
10. Go to PerformanceMeasurement 폷Management Cockpit.
11. Select the cockpit for which the Drilldown Settings were configured. 12. See the changes in the example shown in Figure 3.49. There is now an
additional icon on the right-hand side of your screen called Parameters. 13. Select Parameters and see that there is a new window next to the Frame
in presentation time, as displayed in Figure 3.49.
14. Now the Frame can be changed based on new values for the five selected CostCenters using the cockpit Drilldown Setting that were con-figured in Figure 3.48.
Figure 3.48 Dynamic Drilldown Structure of the Management Cockpit
2
1
3
5
3.5
Summary
This chapter was a quick overview of the capabilities of SAP CPM. In later chapters I will discuss how to create and implement the Balanced Scorecard and the Management Cockpit Structures in more detail.
For now, let us assume that various managers, as well as, an implementation team have successfully completed a blueprint that describes the overall scope and contents of your SAP CPM project. Otherwise, I hope that someone in the team has a clear vision of what has to be achieved and can see the requirements as an architect, ready to build a great cathedral. Remember, SAP CPM is not about software but about strategy, focus, communication, planning, feedback, and an elegant design that puts the pieces together.
Figure 3.49 Frame with Drilldown Settings
Cost Center Cost Center Cost Center Cost Center
Pro… 01D0P HR Corpo
Step 1: Click here
Step 2: Drilldown
A
ABAP 249, 373 ABC Analysis 375 Account Model 29 Accounts Payable 369 Activity Based Costing 22 Actual Data 187
Administration 98 ADP 375
Approximation 375 Architecture 30, 371 ASCII 34
Assessment 232 Assessment/Status 62 Association 375 Attributes Tab 86, 98
B
Balance Sheet 178
Balanced Scorecard 37, 65, 79, 81, 85, 110, 353
Balanced Scorecard elements 42 Balanced Scorecard Launchpad 43, 66,
271
Balanced Scorecard Monitor 62, 250 Balanced Scorecard process 21
Balanced Scorecard Wizard 43, 265, 267 Balanced Scorecard, Management
Cock-pit 103
Benchmark 87, 101 Benchmark data 101, 102 Benchmarking 98
BEx 28
BEx Analyzer 95 BEx Queries 68, 275 BEx Query 290
BEx Query Analyzer 96
BEx Reports 29, 35, 72, 97, 182, 200, 263
BIC 73 Blueprint 38 BPS 73
BPS layout 263 BSC 21
Business Content 83, 105, 111 Business Explorer 82
Business Intelligence 37
Business Planning and Simulation 35 BW 188, 371
BW Buffer 85 BW Data 62, 70 BW Key Figure 95, 96 BW Report 46, 193 BW Transaction Data 45
C
Cause-Effect Analysis 22, 49 Cause-Effect Chain 49
Cause-Effect Relationships 64 CCA 73
Change Measure 82, 86, 92 Chart Editor 157, 196, 199 Charts 164
Chemical Industry 56 Cluster 375
Cockpit 81, 110
Cockpit Hierarchy 67, 157 Cockpit List 67
Cockpit Monitor 69 Cockpit Structures 159 Cockpit Transport 177 Content Release 98 Control 274 Control Point 369 Controlling 37 CO-PA 73
Corporate Governance 363, 368 Corporate Performance Monitor 37 Corporate Scorecard 162
COSO 363, 365
Cost Center Reports 178 CPM Platform 371 CSV 34
Customer Relationship Management 83 Customizing Request 60
D
Data Mining 22, 375
Data Source 86, 95, 97, 98, 110, 157, 164, 192
Definition Tab 86 Design 66, 71, 87
Design/Management Cockpit 74 Desired Change of the Measure 98 Details Button 85
Development to Testing 178 Document Files 184
Document Frames 183 Drilldown 74
Drilldown Analysis 50 Drilldown Menu 50 Drilldown Process 74 Drilldown Settings 76 Dynamic Simulation 23
E
Economic Profit 59 Element Assignment 105 E-mail Notification 62
Enterprise Portal 291, 353, 375 Environmental 229
EVA Index 92 Excel Spreadsheet 28
F
Fact Table 31, 32 Filter Button 86 Finance 37
Financial Compliance Process Manage-ment 368
Financial Group 87
Financial Indicators 22, 27, 80 Financials 83
Five Forces 24
Formula-Name 90, 92
G
Generic R/3 Extraction 73 Graphic Element 196 Graphic Indicators 48
Graphical User Interface 43, 66 Graphics 164
H
Hide Measure Catalog 86 Hierarchy 159
Human Resource Intelligence 37, 83
I
IDES Platform 44, 67, 372 Implementation 371 Industry Tab 86 Info Objects 95 Info Providers 95, 97
InfoCube 28, 29, 30, 31, 33, 82, 85, 96, 97, 101, 186, 189, 192, 193, 372 InfoCube Design 29
InfoCubes 72, 95, 97, 98 InfoObject 85, 99, 101, 184 Initiatives 26, 43
Innovation Base Strategy 56 Interfaces 34
Internal Control 363 Internal Error 85 Invoice Status 369 IT Platform 370
K
Key Figure Structures 97 Key Figures 29, 85, 95, 97
Key Performance Indicators 79, 154, 227
L
Lagging Indicator 80, 81
Learning and Growth Perspective 45 Line Chart 187
Localize Measure 86 Logical Views 66, 154, 163 Long-term Planning 27
M
Maintain Views 47
Management Cockpit 34, 65, 66, 74, 81, 85, 111, 153, 192, 216, 225, 290, 353, 371, 372
Management Cockpit Applications 85 Management Cockpit Menu 67
Management Cockpit Monitor 66, 214 Management Cockpit Structures 77 Management Cockpit Web Version 66 Managerial Approach 38
Market Risks 230 Marketing Analysis 198 Materials Management 37 Measure 81, 90, 97, 114, 193
Measure Builder 33, 69, 79, 81, 96, 97, 101, 106, 110, 115, 166, 225, 228, 264 Measure Catalog 58, 67, 72, 81, 82, 87,
89, 93, 95, 98, 101, 106, 109, 111, 264, 280, 283
Measure Definition 87 Measure Group 87, 89 Measure Hierarchy 87
Measure Tree 46, 50, 263, 290
Measures 26, 43, 79, 81, 159, 228, 261, 372
Measures and Benchmarks 66, 68 MM 34
Monitor 274
MS Windows Explorer 84 MySAP ERP Financials 73
N
Net Sales 251 No Value 70 Non-financial 80
O
Objectives 26, 43, 49, 79, 81, 261, 263, 264, 267
Operand 90
Operating Expenses 193 Operating Profit 193 Operational Data Store 97 Operative Risks 230
Organizational Objective 261
P
Parameters 76 PC4YOU Cockpit 67
PC4YOU Group Scorecard 50 PC4YOUGROUP 60
Percent Employees with Acd. Degree 45 Performance Commitment 269
Performance Indicators 80
Performance Measurement 34, 65, 74, 111
Performance Measurement Menu 68 Performance Measurement Module 66 Performance Measurement System 72 Performance
Measurement/Manage-ment Cockpit 71, 76 Period 109
Period Layout 61 Periodization 159
Perspectives 22, 25, 43, 49, 263, 372 Plan Data 187
Planning Layouts 46 Predefined Range 48 Presentation Mode 223 Product Category 188 Production 178
Project Management 38 Provider Measure 103, 105
Q
Quality Function Deployment 24 Queries 98, 180
R
Radar Chart 207
Remote Function Call 186 Restricted Key Figures 32, 95, 97 Restricted Measures 72
RFC Destination 193 Risk Activities 235, 251 Risk Analysis 232 Risk Assignments 234 Risk Catalog 233 Risk Control 232 Risk Handling 232 Risk Identification 232 Risk Indicators 227
Risk Management 81, 85, 110, 225, 227 Risk Management Module 372
Risk Management Monitor 249 Risk Setting 233
Risk Value Fields 235
S
Sales Growth 92, 95, 105 SAP Basis 177
SAP Business Content 58, 60, 83, 103 SAP BW 27, 34, 72, 85, 95, 97, 115, 184,
233, 249, 252, 262 SAP BW Reports 98 SAP Catalog 85 SAP CPM 39, 72 SAP GUI 291, 353 SAP HR 72
SAP Measure Catalog 105, 111, 114 SAP Platform 39
SAP R/3 39, 73, 365
Sarbanes-Oxley Act 38, 229, 363, 373 Scheduling BW Data 62
Scorecard 33, 81
Scorecard Comparison 51 Scorecard Hierarchy 58 Scorecard Structure 109 Search Button 85
Securities and Exchange Commission 363
Selection Criteria 168, 187 SEM 3.2 105
SEM 6.0 107, 108, 157 Simulation VDT 263 Six Sigma 198 Stairway-Lego 29, 32 Status 49
Status Indicators 51
Strategic and Performance Measurement System 40
Strategic Business Unit 154 Strategic Effects 231 Strategic Feedback 23 Strategic Risks 230
Strategy 23, 26, 43, 79, 81, 261, 263 Strategy and Performance Measurement
40
Strategy and Vision 25
Strategy Management 34, 62, 65, 72, 87, 111, 158, 216, 372
Strategy Management Module 65, 71, 155
Strategy Management/Design/Score-cards 85
Strategy Map 261, 263, 266, 271, 272, 274, 291
Structure 97
Supplier Relationship Management 37 Supply Chain Management 37, 83 System Performance 29
Systems Approach 40
T
Tachometer Chart 185 Target System 180, 234, 251 Target-Based Activities 154 Technical Name 86, 176 Time Variables 159 Top-level Support 27 Transactional InfoCubes 35 Transport 176
Transport Organizer 179 Transport Process 178 Transport Request 178 Triggering Objectives 49
U
Units 98 URL 95, 182 URL tab 86, 93
V
Value Driver Tree 46, 50, 64, 81, 85, 95, 98, 103, 110, 261, 263, 274, 373 Value Fields 33, 98
Value Type 98, 188 Variable 230
VDT 274, 280, 291, 373 View menu 47
W
Walls 66
Web Application Server 43, 216, 262, 264, 375
Web Applications 164 Web Dynpro 375 Web Environment 66 Web Reports 180