Possibilities for electricity exchange
between Norway and Germany
About ZERO
Zero Emission Resource Organization is an environmental organization dedicated to reducing climate change by demonstrating and gaining acceptance for zero emission energy solutions. We believe a zero emission solution exists for all energy use. Our mission is to work consistently for these solutions.
Questions about this report can be directed to: ZERO – Zero Emission Resoruce Organisation Maridalsveien 10
0178 Oslo NORWAY www.zero.no zero@zero.no Author: Marie Lindberg Contributors: Tina Bangsund Olsen Marte Bakken Einar Wilhelmsen
Layout: Hans Andreas Starheim
Cover: The old machine hall at Vamma power station i eatern Norway, opened in 1915. (Photo: Hafslund)
Executive Summary
This report presents different possibilities, expectations, scenarios and political objectives for de-velopment of renewable electricity, electricity storage and balancing potential in Germany, and the possibilities for meeting some of these needs through Norwegian hydro power. ZERO has car-ried out comprehensive literature studies of Norwegian and German studies, as well as several in-terviews with German actors in order to get an overview of the situation. The overall picture is that the expectations on German side are not coherent with the current development on Norwegian side.
The chapters describing the situation in Germany makes it evident that there is no agreement among different actors about how and when a 100 percent renewable electricity system can be achieved, and what role Norway is going to play in such a scenario.
There is a remarkable need of storage capacity in order to achieve the current renewable targets until 2050, and Germany’s potential for electricity storage is already limited. In Norway, the overall political signals towards exports of green electricity have been positive, but when it comes to ac-tual plans and action the picture is quite different.
The Norwegian figures of possibilities for balancing power vary greatly, and have a number of prerequisites. Norway as a “green battery for Europe” is not only a matter of political will, but also of technical, economic and environmental considerations, as well as acceptance in the population. The studies regarding different forms of balancing power potential in Norway state that much more research is needed before we can have a clear view of the total effects and possibilities of a large-scale power export system.
In general, an interesting finding is that there is a different approach to the question of future energy policy in Germany and Norway. Germany has set up long term targets and visions for their energy sector until 2050. In Norway such a long-term planning is not an issue for debate. The Norwegian electricity policy reaches only until 2020, which is the time period for the green cer-tificate system. In Germany, which has an electricity sector heavily dominated by fossil fuels, they have set up ambitious targets for renewable energy deployment for the next four decades.
Despite the uncertainties regarding the availability of Norwegian balancing power and storage potential, the establishment of interconnectors between Norway and Germany seems to be one of the most realistic alternatives for storage and balancing of intermittent renewable electric-ity production for Germany. With hydro reservoirs of 84 TWh, Norway holds about 50 percent of Europe’s hydro power storage capacity. To be able to exploit some of these TWhs for the purpose of facilitating increased renewable electricity shares would be a sustainable alternative to the con-struction of additional flexible gas and coal power plants in Germany.
Contents
Executive Summary
3
Introduction
6
Background: Norway as the green battery of Europe
7
Current situation
7
The “green battery” discussion
7
Case study Germany: Large emissions and ambitious climate policy
8
Climate effect of interconnectors
9
Germany: A fossil based power system
10
Electricity mix and production structure
10
Electricity grids
12
Imports and storage capacity
12
Political targets for energy production
13
Renewable targets
14
Nuclear power
15
Grid targets
16
Storage targets
17
Expectations and conditions for a renewable Germany towards 2050
18
The electricity studies
18
Germany’s future share of renewable electricity
19
Imports of electricity
24
Energy storage
25
Electricity grids
27
Results from interviews and meetings in Germany
29
The interviews
29
Renewable energy deployment
30
Imports 32
Storage 32
Grids 33
Norwegian possibilities and challenges
35
Energy situation
35
Hydropower resources in Norway
36
Renewable energy policy
37
Climate policy
39
Possibilities for hydroelectric balance power and storage
39
Power grid development in Norway
42
Current plans and conditions for foreign cable connections from Norway
45
The green battery debate in Norway
47
Discussion – Norwegian versus German findings
51
Differences in national energy debates
52
The green battery discussion in Norway
53
Tables
Table 1: Electricity grid in Germany 2008
12
Table 2: The share of renewable energy of the final electricity production
20
Table 3: Electricity production capacity by sources in GW, scenario I A
20
Table 4: The scenario 1.a and 2.1.a: Total production in TWh and installed capacity
21
Table 5: Net Electricity production in the innovation scenario without CCS
22
Table 6: Installed capacity in the innovation scenario without CCS 2005- 2050, in GW 23
Table 7: Electricity production in Germany 2020 – 2050, in Twh
23
Table 8: German import rates in the Energy Scenarios, scenario IA
24
Table 9: Net imports in Germany, 2008 - 2050 in TWh (Blueprint Germany)
25
Table 10: Electricity consumption in storage units 2005 – 2050, in TWh
27
Table 11: Institutions which we have talked to during the project
29
Table 12: Planned foreign cable connection projects 2010
45
Table 13: Planned foreign cable connection projects 2011
45
Figures
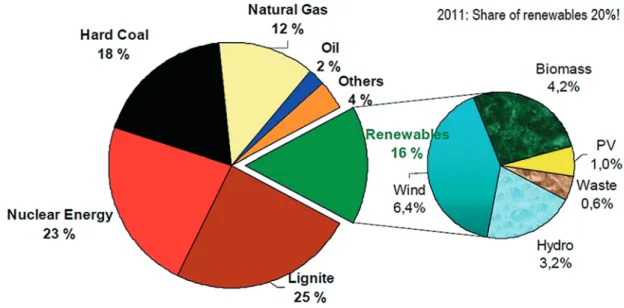
Figure 1: Electricity production in Germany 2010, in percentage
10
Figure 2: Primary energy consumption in Germany 2010, source: BMWi (2012)
13
Figure 3: German capacity load in typical March, by source
25
Figure 4: Electricity production in Norway by source 2010
36
Figure 5: Hydropower potential pr. 01.01.2011
36
Introduction
Zero Emission Resource Organisation (ZERO) is an environmental foundation contributing to lim-iting human made climate change. ZERO will contribute to limlim-iting the threat posed by climate change by promoting carbon-free energy solutions. In our view, emission-free alternatives exist for all energy use, and ZERO works continuously for their realization.
ZERO sees the need to enter the discussion of establishing more power exchange at an early stage, in order to secure that such cables have a positive climate effect. The construction of interconnec-tors will have several consequences for the power markets, but also for the energy mix and even-tually for greenhouse gas emissions.
ZERO has carried out a project in order to find out more about the situation for oversee cables in Norway and Germany. ZERO wanted to analyse what Germany needs and expects when it comes to import of Norwegian electricity and capacity in the future. This is especially relevant as Germany has decided to expand the share of renewable energy in their electricity mix up to 2050. At the same time, we wanted to make an overview of the green-battery discussion in Norway, technical as well as political.
There have been several research questions:
• What are the different expectations and challenges for the establishment of interconnectors in Germany?
• What does different actors and studies say about Germany’s future electricity mix look like and what are assumed needs for balancing power and storage capacity?
• What does existing studies and analyses say about availability of storage capacity and balancing power in the Norwegian power system?
As the discussion about storage capacities, regulative power and the idea of a green battery is quite new in both countries, there are not many actors that have published calculations and fig-ures for expectations and potential regarding these issues. This project has therefore been to anal-yse and sum up the main tendencies in the discussion in both countries, not to give an exhaustive description of all involved actors and their positions.
Background:
Norway as the green battery of Europe
The discussion about Norway as a green battery for Europe emerged in the second half of the past decade. It has resulted in many research projects and initiatives, which aim at studying the potential of expanding the electricity exchange between Norway and the neighboring North Sea countries. By establishing high capacity interconnectors in addi-tion to the existing cables between Norway and Denmark, the Netherlands and Sweden, it is possible to make use of the flexible hydro power based electricity system in Norway for the purpose of balancing the rapidly increasing intermittent production of renewable energy in the North-European countries. Increasing shares of renewable energy sources in North European countries means new challenges for power systems and power mar-kets. New ways of controlling and operating the grids will be required. It is likely that there will be increased interaction in the European power grid as production becomes more non-regulative.CURRENT SITUATION
Norway has for a long time been connected with electricity cables to Sweden and Denmark. Historically, interconnectors were built in order to combine thermal power production in Denmark and to some extent Sweden with flexible hydropower in Norway. This way Norway could run on surplus thermal power at night, while serving neighbors with hydropower at peaks during daytime.
Today several interconnectors exist between Norway and Denmark (1 GW), the Netherlands (0.7 GW) and Sweden (3.5 GW) From Denmark to Sweden, transmission capacity comprises more than 2 GW. These cables serve several purposes:
• Cables have helped allow the high share of wind power in the Danish system, providing flexible CO2-free power when the wind is not blowing.
• Cables enable Danish wind power producers to export excess of wind power to Norwegian consumers,
• Cables help to secure Norwegian energy supply in periods with low water levels in the hydro magazines.
• Cables allow for export of hydropower at times when dams are full, thus preventing “spill” of water. This situation will occur in periods with lots of precipitation, when “run of river” power production is running at full load and covering all national demand.
• Cables will by its very nature reduce large fluctuations in power prices in Norway.
THE “GREEN BATTERY” DISCUSSION
The rapid installation of wind and solar power in northern Europe increases the need for back-up power. Because of Norway’s unique topography with many lakes and mountains, Norway has huge hydro power and storage resources. The capacity of the existing interconnectors is never-theless very limited compared to the amounts that will be required to enable large scale power exchange across the North Sea, which is required if Norway is to become Europe’s green battery.
The term “green battery” derives from the idea that the hydro reservoirs in Norway could serve as one of the major solutions for back-up capacity when there is lack of renewable electricity in the other North Sea countries. The Norwegian hydro reservoirs can be used to produce and store elec-tricity. The green battery can hence be “loaded” in periods with excess renewable production in the neighbor countries. In this case, electricity is imported to Norway and used to pump up water from lower to higher levels in the hydropower system. The purpose of the battery is thus both to store excess electricity and to deliver balancing power on command.
The green battery could be established in several different ways. One idea is to build several in-terconnectors which would integrate the electricity markets in North-European countries and Norway. The cables would in such a case be connected to the Norwegian electricity grid in South-Norway and lead to a general balancing of the electricity markets in the different countries. Another idea is that certain cables from Europe are connected directly to specific power stations in Norway. The cables are placed along the coast and connected directly to the power stations through the fjords and up to the power station with a land line. The Norwegian power stations could be upgraded with pump technology which enables storage of excess production from abroad, and with enhanced production capacity in order to deliver huge amount of capacity in short periods with no or low production in neighbor countries. In such a case, the cables would not necessarily influence the Norwegian power system and market.
There are several initiatives and projects going on that study the potential for increased transmis-sion capacity from Norway. There have been plans for about 4-5 interconnectors from Norway by 2020 with a capacity of totally 4-5 GW. In August 2011, the Norwegian TSO Statnett published a study which concluded that these plans would not be compatible with the existing capacity in the power grids in southern Norway. At the same time, they modified their previous assumptions for when new interconnectors can be ready: Two interconnectors by 2021, one to Germany and one to UK.
Norway is very interesting as a partner for several northern European countries when it comes to exchange of flexible and regulative power supply and electricity storage. Firstly, Norway is consid-ered a politically stable partner, which is very reliable regarding long-term trade agreements. This is the case for agreements in the oil and gas sector today. Secondly, Norway has a unique energy system with huge hydro power resources, which theoretically can be expanded and upgraded. Finally, hydro power storage of electricity is by far the cheapest alternative compared to other op-tions for electricity storage, like for instance chemical storage, despite large costs connected to the grid construction. This is because the efficiency loss is much lower in a hydro storage system than in a system based on chemical storage.
CASE STUDY GERMANY:
LARGE EMISSIONS AND AMBITIOUS CLIMATE POLICY
We have chosen to take a closer look at the situation concerning future energy production in Germany and the implications this could have for future power exchange between Germany and Norway. This is first of all a result of the fact that Germany has developed an overall plan for their energy situation until 2050, including targets for renewable energy development and emissions reduction. This implies the need to develop a set of policy measures which facilitates the achieve-ment of these goals. Further, there are strong interest groups in the German society, which de-mand even more ambitious targets than the official ones. Irrespectively of what will be the actual targets, it is clear that an ambitious renewable energy policy depends on the availability of storage systems and/or flexible power production in a scale that currently does not exist.
largest emitter of greenhouse gases (GHG) with 960 Mt CO2, is meeting its Kyoto target within the overall European target of 8 percent emission reduction by 2012 compared to 1990. Under the Burden Sharing Agreement Germany has committed itself to cut CO2 emissions by 21 per-cent in the period 2008-2012 compared to 1990 levels. Germany’s self-imposed mid-term goal is even more ambitious: to cut GHG emissions by 40 percent of the 1990 level by 2020. In July 2009, Germany also agreed with G8 leaders on an 80 percent reduction target by 2050 in order to limit global temperature rise to two degrees.
The electricity sector is the major contributor to Germany’s greenhouse gas emissions. In 2009, electricity producers emitted 338.5 million tons CO2 – 43 percent of the total emissions.1 Therefore,
the power sector plays a key role in Germany’s efforts of reducing greenhouse gas emissions.
CLIMATE EFFECT OF INTERCONNECTORS
The issue of climate change has been neglected or underestimated in the Norwegian electricity discourse for a long time because the hydro power is emissions free. There has been almost no focus on the possibility to use the hydro power resources to reduce emissions in neighbor coun-tries, even though this has been the case in the power exchange with Denmark since several years. Some studies (Pöyry 2011)2 have even concluded that the climate effect of interconnectors to
Northern Europe would be negative in a short term perspective, as Norway would then export clean power to the continent during day time, and import coal power at night.
In order to calculate a realistic estimate of the actual “climate effect” – i.e. actual emission reduc-tions – of one or several interconnectors to Germany, one would have to establish certain sce-narios for power production mix and storage alternatives in Norway and Germany. It would also be necessary to calculate this climate effect for different years up to 2050, and not only for 2020. The German Ministry of Environment and Nuclear Safety has estimated how much greenhouse gas emissions that have been avoided so far as a result of renewable energy deployment in Germany3. In 2010, the renewable energy production contributed to the reduction of 75 million
tons CO2 equivalents in the electricity sector, which corresponds to 1.5 times the total Norwegian GHG emissions. This was with only 17 percent renewable power in the German electricity pro-duction. If the availability of several interconnectors between Norway and Germany would enable Germany to increase its share of renewables in the electricity mix, it is obvious that the intercon-nectors would have a significant climate effect. In order to come up with a specific figure, it would therefore be very interesting to look further into such a scenario in a later research project.
1 http://www.umweltbundesamt.de/emissionen/publikationen.htm 2 Pöyry (2011): Challenges for nordic power
Deployment of the Norned cable. Norned, a 580 kilometre connec-tion between Feda in Norway and Eemshaven in the Netherlands, is the longest HVDC submarine power cable in the world. (Photo: ABB)
Germany: A fossil based power system
At the heart of Germany’s energy policy, just as in many other European countries, is the need to create a frame for the development of a future energy sector that will meet the emerging challenges of energy security, competitiveness and climate change. What this triangle actually means when set into action is a heavily disputed question among politi-cal parties, NGOs and the energy producers.ELECTRICITY MIX AND PRODUCTION STRUCTURE
In 2010, Germany’s total electricity production was 624 TWh.4 The German electricity sector has
traditionally been characterized by the special dominance of coal, lignite nuclear power. Hard coal and lignite together represented almost 45 percent of the fuel basis for the gross electric-ity production in 2009. Gas accounted for 13 percent; nuclear 22 percent, 16 percent came from renewable energy sources, with the dominant renewable energy source being wind. Whilst the ex-pansion of gas fuelled power generation is currently questionable due to high gas prices, import dependencies and supply insecurities, coal and lignite are believed to play a major role in the me-dium term future energy mix of Germany, since they offer a cost effective source of secure energy due to indigenous resources and large worldwide reserves.
Figure 1: Electricity production in Germany 2010, in percentage5
The German energy production has traditionally been dominated by four large companies, infor-mally also called “the big four”. In 2008, EnBW, EON, RWE and Vattenfall were responsible for 86 percent of net energy production6. With increasing shares of renewables, this structure is slowly
changing, although these companies are also involved in the deployment of renewable energy. Here, the large energy companies are above all involved in the construction of large off-shore wind parks.
In 2011, there were 20 coal or lignite based power plants currently under construction or in de-tailed planning in Germany, due to start up in the period 2011 -2015. These plants will have a
com-4 http://www.bmwi.de/BMWi/Navigation/Energie/Statistik-und-Prognosen/Energiedaten/gesamtausgabe.html 5 www.bmwi.de
bined capacity of 22 GW and emit more than 135 million tons CO2 per year7. Clearly, the extensive
use of coal stands in contrast to Germany’s ambitious climate targets, which is the reason why environmental organizations and groups demand the stop in construction of new plants and also a rapid replacement of these plants with renewable energy. If lignite and coal fired power stations are to remain in the energy mix until 2050, in line with the political targets in the energy concept, the development of power stations with high efficiencies and CCS technologies seem inevitable. At the same time, Germany is a unique country in the renewable context. It has gone through one of the most remarkable developments when it comes to deployment of renewable energy during the last 10 years. From a share of 6.4 percent (37 TWh) of total power production in 2000, the fig-ure rose to 17 percent (103 TWh) in 2010. The installed capacity increased by almost 500 percent from 12 GW to 56 GW in the same period. Of this, wind energy holds the largest share with 27 GW. A major share of the new production is produced in smaller-scale and decentralized facilities. For instance, most of the 17 GW Photovoltaic power installed by 2020 is private owned and installed locally on buildings. According to calculations from the German Environmental Ministry, 118 mil-lion tons CO2 equivalents of greenhouse gas emissions in all sectors were avoided in 2010 due to the renewable energy production8.
The increase in renewable energy actually surpassed the most ambitious scenarios for renew-able energy deployment for the past decade. The explanation for this impressive development is above all the famous “Erneuerbare Energien Gesetz (EEG)” – the renewable energy Act from 2000. Through a feed-in system, the German Government has established favorable support conditions for investing in and operating renewable power stations/units. Feed-in tariffs guarantee investors a specific support per kWh produced for a certain time period. The size of the remuneration and the duration of the support period depend on what technology is used. This makes it possible to ensure a broad technology mix. Germany has promoted renewable energy with feed-in tariffs since 1991. The EEG is designed such that the supply companies are obliged to purchase the RES electricity and then pass the costs through to the consumers. The feed-in tariff for photovoltaic units is the highest of all technologies with an average compensation of 47 ct/kWh in 2010 and a total compensation (i.e. of the total PV electricity production) of 3.9 billion Euros.9 In 2011 the
re-newable fee on the electricity price for private customers rose from 2.047 ct/kWh in 2010 to 3.530 ct/kWh, which led to renewed debate about the burden of the EEG for consumers10. In 2009, the
total amount of the feed-in tariffs paid to the operators of renewable units accounted to 10.8 bil-lion Euros11.
Other aspects that have influenced the renewable energy development in Germany is a com-prehensive promotion of renewables with a lead market focus, external pressure deriving from European and international commitments and finally; a positive cognitive environment towards renewable energy in the society12.
7 Deutsche Umwelthilfe: „Kohlekraftwerksprojekte in Deutschland“, http://www.duh.de/1960.html 8 BMU (2011): Erneuerbare Energien in Zahlen
9 ZERO: Note that the Feed-in tarriffs for photovoltain power has been rapidly reduced to 18-24 ct/kWh. (March 2012) 10 www.erneuerbare-energien.de
11 IFNE (2010): Beschaffungsmehrkosten für Stromlieferanten durch das Erneuerbare-Energien-Gesetz 2009
12 Bechberger and Reiche (2006): Good Environmental Governance for Renewable Energies. The Example of Germany - Lessons for China?
ELECTRICITY GRIDS
In 2008, there were 1,783,209 km of electricity grids in Germany. Of this, 1,164,012 km was low voltage, 507,210 km medium voltage and 111,987 km high voltage.
High voltage medium voltage low voltage Total grid length
111,987 km 507,210 km 1,164,012 km 1,783,209 km
Table 1: Electricity grid in Germany 2008
Correspondingly to the four dominating electricity producers, there are also four main TSOs oper-ating the German grid today. The four large companies used to own the major part of the electric-ity grid, but in line with the decisions in the EU energy directive, they were forced to release the responsibility for the grids during 2008-2010. RWE and EnBW outsourced their grids to subsid-iary companies, Amprion and ENBW transportnetze respectively, whereas Vattenfall and EON sold their grids. The Dutch company TenneT took over the parts of the grids which used to belong to EON, and Vattenfall’s former grid turned into the company 50 Herz Transmission, partly owned by a Belgian and Australian company13.
According to the implementation of the EU directives, the TSOs were obliged to source out all activities from their companies that concerned energy production or energy sales by 2007. One consequence was the establishment of the Bundesnetzagentur (The Federal Network Agency) in 2005. The BNA has the task to control and keep the TSOs under surveillance. It ensures that all citizens and consumer units have access to the electricity grid and also controls the grid fees that are charged by the energy producers. It does not control prices for the end customers, which is the responsibility of the regional state authorities14.
The renewable energy act prescribes that the TSOs are obliged to connect the renewable produc-ing units to the electricity grid prior to other units irrespective of where the electricity is produced. Further, the electricity produced in renewable units has precedence to be fed in to the grid. This means that it periods with low electricity consumption in general and high production of renew-able power, the base load production has to be taken off the grid. It also leads to very low or even negative prices at the energy stock market15.
IMPORTS AND STORAGE CAPACITY
Germany is to a very large degree dependent on energy imports. In 2010, net energy imports ac-counted to over 70 percent. Germany is self-supplied in the renewable energies and lignite based energy production. For the other sources, import dependency is respectively 100 percent for ura-nium, 98 percent for oil, 82 percent for natural gas and 77 percent for hard coal16. This implies that
almost 80 percent of the primary energy consumption is imported, as illustrated in figure 2. The largest oil and gas imports comes from Russia, which delivers 36 percent of the oil and 34 percent of the gas, followed by Norway with respectively 10 percent and 33 percent.
13 Energieszenarien
14 http://www.verivox.de/ratgeber/die-stromnetze-in-deutschland-25551.aspx?p=4
15 http://www.bmwi.de/BMWi/Navigation/Energie/Energietraeger/netze,did=375544.html?view=renderPrint 16 http://www.bmwi.de/BMWi/Navigation/Energie/Statistik-und-Prognosen/Energiedaten/energiegewinnung-ener-gieverbrauch.html
Figure 2: Primary energy consumption in Germany 2010, source: BMWi (2012)17
The renewable energies are currently contributing to increase Germany’s independency of expen-sive energy imports. In 2010, renewable energy production replaced fossil energy imports to the value of 7.4 billion Euros, up from 6 billion in 2009 (BEE, 2010).18
In 2011, Germany became an electricity importer – after several years as a net electricity exporter. Net imports in 2011 accounted to 4 TWh19. The main reason for this was the short term closing of
eight nuclear power stations after the Fukushima accident in March 2011. In 2010, net exports were 14 TWh.
The storage capacity for electricity in Germany as of today is very limited. There exist 30 hydro power pump storage stations with a total capacity of 6.8 GW. When the magazines are fully load-ed, they can run for 4-8 hours and produce a total of 0.04 TWh.20
POLITICAL TARGETS FOR ENERGY PRODUCTION
As one of the core EU member states, Germany on the one hand has to align their policy with the EU’s. On the other hand, they also have a conspicuous influence on EU’s decision. For the time be-ing, the German politician Günther Oettinger is the European Commissioner for Energy.
The European energy and climate package, which was first presented in January 2007 under the German EU-presidency and passed by the European Parliament and Council in December 2008, focuses on three major policy areas: greenhouse gas emissions, renewable energy and energy
ef-17 http://www.bmwi.de/BMWi/Navigation/Energie/Statistik-und-Prognosen/Energiedaten/energiegewinnung-ener-gieverbrauch.html
18 http://www.bee-ev.de/3:662/Meldungen/2011/Erneuerbare-Energien-2011-Energieimporte-in-Hoehe-von-7.4-Mrd-Euro-vermieden.html
19 http://www.finanznachrichten.de/nachrichten-2012-01/22437698-deutschland-2011-erstmals-netto-stromimpor-teur-003.htm [17.02.2012]
20 http://www.focus.de/wissen/wissenschaft/klima/prognosen/tid-21910/zukunft-der-energie-deutschland-hat-wenig-natuerliche-speicherkapazitaet_aid_616276.html
ficiency. Correspondingly the package contains the so-called 20-20-20 for the year 2020: cutting greenhouse gases by at least 20 percent of 1990 levels by 2020, increasing use of renewables to 20 percent of total energy production by 2020 and cutting energy consumption by 20 percent of pro -jected 2020 levels - by improving energy efficiency targets for renewable energy.
These are overall targets for the whole European region. The renewable targets for each member state have been negotiated individually with the respective delegations. The EU has also adopted the emission reduction target of 80-95 percent by 2050, which has been stated by the IPCC as neces -sary to avoid dangerous climate change.
The German climate policy is more ambitious than the EU targets with its 40 percent reduction tar -get by 2020, as the German Government has the vision of being a forerunner country in climate policy. In the Energy Concept from September 2010, the Government has set up long-term scenarios for how both the energy and electricity production structure can and should look like in the future. The targets reach from 2020 until 2050 and are linked both to climate and industry policy.
The climate and renewable policy is partly driven and backed by a strong environmental movement within the country. Illustrative for this is among others the position of the German Green Party, one of the most successful Green Parties in Europe and part of the coalition government with the labor party (SPD) from 2000-2005. In 2010-2011, the Green Party has achieved very good results in sev -eral state elections and has achieved its first Prime Minister in the state of Baden-Württemberg. The environmental movement has above all been decisive in the struggle about shutting down nuclear power plants, which eventually led to the “Atomausstieg” adopted by the Government in 2000. This vote was overruled by the present Government in September 2010, but Chancellor Merkel eventu -ally had to do a turnabout after huge protests following the Fukushima accident as described in the chapter on nuclear power below.
The environmental movement – including environmental organizations, parties, activists, citizens’ initiatives (Bürgerinitiative), journalists and research institutes – has also been important in the struggle for more renewable energy. The question about how much renewable energy that can actu -ally be implemented in Germany and under which conditions is still heavily disputed.
RENEWABLE TARGETS
In September 2010, the German Government launched the “Energy Concept”, a comprehensive document which describes concrete targets for the official energy policy until 2050. According to this concept, GHG emissions shall decrease steadily from 40 percent in 2020 to 80-95 percent in 2050, in line with the recommendations from the IPCC and the G8 declaration (BR 2010)21.
The share of renewable energies in the gross final energy consumption is set to 18 percent in 2020. This is the same target which has been negotiated within the EU and listed in the national allocation plan according to the European Community Directive 2009/28/EG22. After 2020, the
pro-portion of renewable energies of total energy consumption will increase steadily to 30 percent by 2030, 45 percent by 2040 and 60 percent by 2050. For the electricity supply, the renewable share will be much higher. The national allocation plan expects 38.6 percent renewable electricity of the total electricity mix in 202023. In the Energy Concept, the Government aims at reaching 50 percent
21 Bundesregierung 2010: Energiekonzept
22 Bundesregierung (2010): Nationaler Aktionsplan für erneuerbare Energie gemäß der Richtlinie 2009/28/EG zur örderung der Nutzung von Energie aus erneuerbaren Quellen
by 2030, 65 percent by 2040 and 80 percent by 2050 (BR 2010)24. Still, the major share of the
en-vironmental movement is not satisfied with this: They demand 100 percent renewable electricity supply by 2050 – at the latest. The official targets are combined with remarkable efforts within energy efficiency. Compared with 2008, the Government aims at reducing the total electricity consumption by around 10 percent by 2020 and 25 percent by 2050.
When it comes to energy efficiency, the ambition is to reduce the overall primary energy con-sumption with 20 percent by 2020 compared to 2008, and by as much as 50 percent by 2050. This calls for an annual average gain in energy productivity of 2.1 percent, based on final energy consumption. The building renovation rate will need to double from the current figure of less than 1 percent a year to 2 percent of the total building stock. In the transport sector, final energy con-sumption is to fall by about 10 percent by 2020 and by about 4 percent by 2050, the baseline in this case being 2005.
The Energy Concept is partly based on calculations carried out for the study “the energy scenarios” (Energieszenarien), which are elaborated on in more detail in chapter 6. The energy scenarios proj-ect that wind energy will play a key role in elproj-ectricity generation in 2050. This calls for a massive expansion of onshore and offshore wind power capacity. Crucial for this development is the ex-pansion of German and European grids. The energy scenarios expect that Germany will depend on considerable imports of electricity in a European electricity market, but at certain times have considerable exports as well.
To what extent Germany remains a country of electricity production is uncertain and will depend largely on the framework conditions. The Government states that it “will design these [conditions] in such a way that the existing potential for innovation, growth and employment is utilized […] and secure that in a long term perspective there will be a high share of national value creation in the energy sectors at competitive prices” (BR 2010)25.
According to the energy concept, the expansion of renewable energy poses several challenges for the energy supply system as a whole; old conventional sources, renewable sources, grids, storage and the relationship between them requires optimization.
In December 2011, the Bundesnetzagentur published three different scenarios with new official figures for power production until 202226. These scenarios will function as the official targets for
installed capacity differentiated by production source and be the basis for the projections for the required grid construction in Germany until 2022. The required grid construction will be published in the national grid development plan, which is going to be released by the main national TSOs during 2012. The main scenario (Leitszenario B) for installed production capacity, is more ambi-tious when it comes to deployment of renewable energy than the energy scenarios. This will be commented on in the next chapter.
NUCLEAR POWER
With the launching of the Energy Concept in fall 2010, the government also presented its deci-sion to extend of the operating time of the German nuclear power plants. This abruptly set the enactment of 2001 to end all nuclear power production in Germany within 2020 out of effect. The Energy Concept proposed a postponement of the closing date by up to 14 years compared to the
24 Bundesregierung 2010: Energiekonzept 25 Ibid.
26 http://www.bundesnetzagentur.de/cln_1932/SharedDocs/Pressemitteilungen/DE/2011/111207SzenariorahmenPr essKonf.html?nn=65116
enactment from 2001. The undemocratic way of changing previous legislation led to very harm-ful reactions and huge protest throughout widespread parts of the German population. After the nuclear accident in Fukushima in March 2011, the Government experienced an enormous pres-sure to rethink their nuclear policy. Chancellor Merkel responded to this by establishing an “Ethical Committee” (Ethikkommission), which had the mandate to evaluate the risks of nuclear power and also of other energy sources in general.
In May 2011, the Ethical Committee which was composed of former politicians, scientists, econo-my experts and represents from the church, presented the results from their two months of work. In a document called “Deutschlands Energiewende - Ein Gemeinschaftswerk für die Zukunft”, they concluded that the closing of the German nuclear power stations was feasible within the next 10 years. The Ethical Committee assesses the end of nuclear power production to be necessary in or-der to eliminate the risks that is connected to power production in nuclear power stations. Further, they recommend that the closing down is organized so that the competitiveness of industry and economy is not endangered. The nuclear power can be replaced through renewable energy, en-ergy efficiency and fossil enen-ergy. Change in lifestyle is also considered to give a contribution to energy savings27.
Following the recommendations from the Ethical Committee, the Government rapidly imple-mented the “Energiewende” (The major energy turnabout) during summer 2011. It decided to take eight nuclear power stations out of production immediately. The remaining nine power sta-tions will be taken off the grid between 2015 and 2022. In addition, several amendments in the energy policy legislation were carried out through the establishment of eight new laws. The most important ones concern increased deployment of renewable energy, electricity grids and energy efficiency.
The closing of nuclear implies that Germany will phase out almost 140 TWh or more than 20 per-cent of gross power production during the next 10 years. This power, which used to be part of the country’s base load, must be replaced by alternative sources. If renewable sources shall take the place of the nuclear power, new balancing power and storage units will have to be introduced into the German power system. We find it interesting to study in more detail what role Norwegian hydro power can play in this development.
GRID TARGETS
In order to meet the large changes in the electricity system, grid improvements and deployment will also be necessary. In the Energy Concept, the Government sees the need for the planning of a German overlay grid (“electricity highways”), which will in turn be integrated into an intercon-nected European grid. During 2012, the Government will present a grid concept, called “Zielnetz 2050”, incorporating both the existing grid and the necessary expansion defined by the Power Grid Expansion Act, in order to assess the required additional infrastructure for the future28. In this
context, the TSOs will be obliged to develop a common grid development plan for the next 10 years ahead, as mentioned earlier in this chapter 29.
There are no official targets yet for how much new and upgraded grid will be required in order to enable the foreseen renewable energy deployment until 2050. There is nevertheless a com-mon understanding that remarkable amounts will be necessary. The German Energy Agency, dena, has developed two grid studies, “dena I” and “dena II”, which calculates the necessary grid
27 Die Ethik-kommission Sichere Energieversorgung (2011): Deutschlands Energiewende – Ein Gemeinschaftswerk für die Zukunft
28 Bundesregierung (2010): Energiekonzept
for 2020/2025. They conclude that more than 4500 km new power lines must be constructed in order to integrate the targeted 35 – 40 percent renewable energy in the national grid. Dena is partly financed from the Government, but their study does not represent the official Government position on the topic. The study has been heavily criticized from environmental organizations and scientists for exaggerating the required grid amount, and hence influencing the public opinion about the feasibility of renewable energy deployment in a negative way. We will come back to this in the next chapters.
STORAGE TARGETS
In the Energy Concept, the government recognizes that it is necessary to expand storage capacity to meet the renewable energy deployment. How much capacity, what kind of storage and where these resources shall be established remain uncertain. The Government wants to tap all the avail-able potential in Germany for pumped storage hydroelectricity and also to examine options to use storage potential abroad, especially in Norway. For the enhanced use of biomass for storage purposes, the Government intends to conduct a swift investigation of possible investment incen-tives that can enhance the targeted generation and feed-in of power from biomass in order to counterbalance fluctuations in wind and solar energy. At the same time, other storage options will be explored and developed30.
Expectations and conditions for a
renewable Germany towards 2050
The next chapters will present different views on the potential for a 100 percent renew-able electricity supply in Germany. The basis for this assessment is both the study of exist-ing studies as well as information gathered in interviews and conversations with different stakeholders.
There exist a variety of different studies, which aims at estimating the potentials for the future electricity production in Germany from 2010 until 2050. In this report, we will not carry out an exhaustive analysis of the whole specter of studies and compare their different results. Instead, we are going to highlight the major results from what we consider to be among the most central stud-ies. Further, the calculations behind them are carried out by different research institutes, which im-plies that there are different models for the power system behind the calculations. The four studies considered here are “The energy scenarios”, “Ways to 100 percent renewables”, “Blueprint Germany 2050” and “Klimaschutz: Plan B 2050”. We will nevertheless also comment on other studies where we consider this necessary.
It is necessary to mention that the energy scenarios differ substantially from the other studies, as it does not start out with the target of 100% renewable electricity supply, which is the case for the other three studies.
THE ELECTRICITY STUDIES
There are several different studies on German energy scenarios.
The energy scenarios
The energy scenarios are not official policy scenarios for the German Government, but they were developed as a basis for the Energy Concept, which was presented 28 September 2010 (see chap-ter 4). This can also be deviated from the title of the study: “Energy scenarios for an energy concept for the German Government”. The scenarios are the result of the work of three German institutes: EWI, Prognos and GWS. The assumptions for the scenarios were developed in a continuous pro-cess between the Government as represented by the Ministry for Economic Affairs (BMWi) and the Ministry for the Environment (BMU) – and the three institutes. The calculations behind the four scenarios can therefore be considered as the fundament for the numbers and targets that was presented in the energy concept.
The Energy scenarios and the Energy Concept’s basis assumptions are emissions reduction targets and targets for increasing the share of renewable energyin the electricity and final energy port-folio. A further assumption is that the CCS technology will be available and market-ready from 2025. One obvious criticism against the energy scenarios was that they were considering different options for extending the operation time of the nuclear power plants. The scenarios were hence assuming a later closing of the nuclear plants, which was also announced in the Energy Concept – but withdrawn again a few months later. We shall therefore only consider the scenario I A, as this is the scenario which is closest to the present situation as it assumes nuclear power production until
202431. This is only two years later than the existing decision to phase out nuclear energy by 2022.
Pathways towards a 100 percent renewable electricity system
This study was prepared by The German Advisory Council on the Environment (SRU) in 2011. Founded in 1971 to advise the German government, the SRU is politically independent and inter-disciplinary. The members of the Council are appointed by the German government for a four-year period, but the council is independent to determine the focus and scope of its reports.
The 100 percent renewable- study has become quite famous in the energy debate in Germany and has also received quite a lot of attention internationally because of its conspicuous findings. The purpose of the study was somewhat different from the energy scenarios and from most ener-gy scenarios. It starts out with the overall target: 100 percent renewable electricity supply by 2050, and then looks at what it considers to be required in order to reach this target.
The SRU-team has calculated eight different scenarios. They differ in their frame conditions for the final amount of the German electricity consumption in 2050, and in the possibility for an electric-ity exchange with neighbor countries. We have chosen to give a short description of the scenarios 1.a and 2.1a. The first is a scenario without imports and power exchange. The latter allows for 15 percent imports from Denmark and Norway, as well as an exchange corresponding to 15 percent of yearly production. Both foresee a total electricity consumption of 500 TWh/a in 2050. The SRU itself conceive the 2.1a as a realistic estimate of how the German electricity supply could develop in the future, and is therefore the core of the analysis made in the study. Even though the SRU also has calculated a 100 percent nationally scenario, the SRU presumes that “the cooperation with Norway and other Scandinavian countries is highly likely going to be necessary”.
Blueprint Germany 2050
The Blueprint Germany 2050 is WWF’s comprehensive study of how Germany can reach its emis-sion reduction targets by 2050 and what implications this would have for the electricity produc-tion. They have thus calculated two scenarios for the power supply in the given period, one with and one without the option of large-scale use of the carbon capture and storage technology. The study was prepared by Öko-Institut and Prognos in 2009.
Klimaschutz: Plan B 2050
The Plan B 2050-study was commissioned by Greenpeace and developed by EUtech in 2009. It foresees an early phase-out of nuclear power in 2015 and no use of CCS. Almost the total energy demand is covered by renewable energies by 2050.
GERMANY’S FUTURE SHARE OF RENEWABLE ELECTRICITY
The four studies differ not only in their estimates of the renewable share in the electricity mix, but also in the distribution of renewable technologies. In 2050, total electricity demand is very differ-ently estimated: The Energy Scenarios presumes 400 TWh, the SRU 509 TWh, Blueprint Germany 330 TWh and the greenpeace-study 465 TWh. The technology distribution is described in the ta-bles below.
31 The difference to scenario I B is negligible, because the difference between scenario A and B is exclusively made out by different assumptions for the costs of retrofitting the nuclear power stations.
The energy scenarios
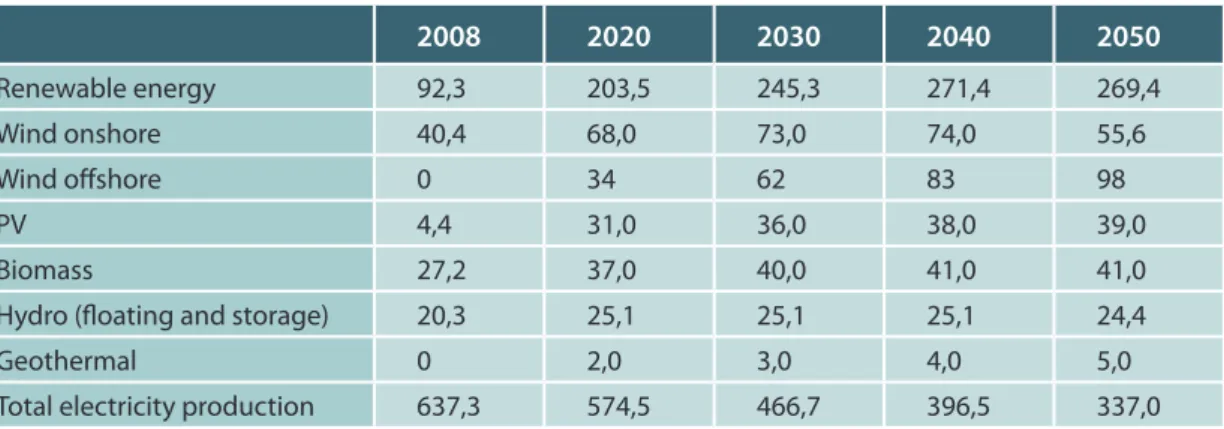
Scenario IA in the energy scenarios finds that 80 percent of a total electricity production of 337 TWh can be renewable in 2050. The study assumes a remarkable decline in electricity production from 2020 until 2050. Energy productivity (economic performance related to energy input) is as-sumed to increase by 2.5 percent each year in the given period.
2008 2020 2030 2040 2050
Renewable energy 92,3 203,5 245,3 271,4 269,4 Wind onshore 40,4 68,0 73,0 74,0 55,6 Wind offshore 0 34 62 83 98 PV 4,4 31,0 36,0 38,0 39,0 Biomass 27,2 37,0 40,0 41,0 41,0 Hydro (floating and storage) 20,3 25,1 25,1 25,1 24,4 Geothermal 0 2,0 3,0 4,0 5,0 Total electricity production 637,3 574,5 466,7 396,5 337,0
Table 2: The share of renewable energy of the final electricity production in TWh, scenario I A32
The net electricity demand in Germany decreases from 537.7 TWh in 2008 to 495.9 TWh in 2020 and ends up at 409.7 TWh in 2050. An increased share of electro cars is overcompensated by the reduced electricity demand in industry, private households and the service sector.
2020 2030 2040 2050
Nuclear 12,1 4,0 0 0 Hard coal 24,0 19,4 23,0 25,8 Lignite 21,4 11,8 6,6 1,3 Natural Gas 22,4 36,7 25,7 20,1 Renewable energy 90,0 101,2 108,9 113,9 Wind onshore 33,3 33,7 35,2 36,4 Wind offshore 10,1 16,3 21,0 24,5 PV 33,3 37,5 38,8 39,0 Biomass 5,7 6,0 6,0 6,0 Hydro 5,6 5,6 5,6 5,6 Geothermal 0,3 0,4 0,6 0,7 Total capacity 181,9 183,7 171,1 161,9
Table 3: Electricity production capacity by sources in GW, scenario I A
Because of the lower operation capacity of most of the renewable energy, the installed capac-ity actually increases until 2030, despite the remarkable decrease in total production. After 2030, there is a slight decrease also in installed capacity.
The expected volume of investment is in the order of magnitude of some 20 billion euros a year. To implement the Energy Concept, the authors suggest establishing a new special “energy and climate fund”, in order to cover the additional funding required, with an economic plan being drawn up each year. Payments by power plant operators will make a fundamental contribution to this fund. From 2013, this will be supplemented by the additional revenues from auctioning
sion allowances that exceed the sums already specified in the framework of financial planning. Furthermore, the relevant budget allocations will also apply.
Even though the Energy Scenarios is the study that lies behind the Energy Concept, the official Government position, the Federal Environmental Agency (UBA) calculated their own scenarios for a shift to renewable electricity. UBA finds that the power generation by 2050 can be based on renewables to 100 percent, and that there will be no threat for security of supply. The calculations also show that it requires remarkable expansion of production units, storage and grids.
Pathways towards a 100 percent renewable electricity system
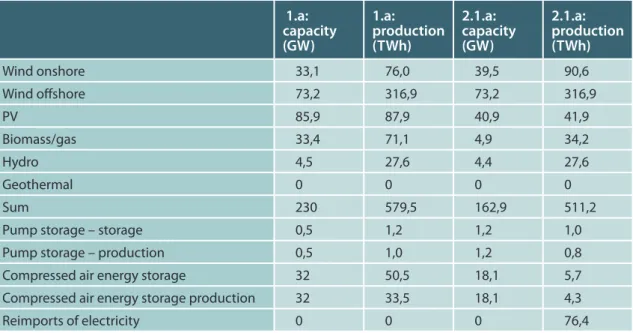
The first scenario describes a situation where Germany produces the total electricity supply na-tionally and no import/export is allowed. Among the most important findings, we see that ac-cording to SRU, a 100 percent renewable national electricity production is feasible in 2050. It is by the SRU characterized as a “theoretical option”. This is nevertheless far more expensive than if a regional exchange system with Denmark and Norway is established. The main reason for this is that it implies a much higher installed capacity in order to ensure security of supply; 230 GW in 1.a against 163 GW in 2.1.a. By comparison, installed capacity in Germany in 2005 was 126 GW.
1.a: capacity (GW)
1.a: production (TWh)
2.1.a: capacity (GW)
2.1.a: production (TWh)
Wind onshore 33,1 76,0 39,5 90,6 Wind offshore 73,2 316,9 73,2 316,9 PV 85,9 87,9 40,9 41,9 Biomass/gas 33,4 71,1 4,9 34,2 Hydro 4,5 27,6 4,4 27,6 Geothermal 0 0 0 0 Sum 230 579,5 162,9 511,2 Pump storage – storage 0,5 1,2 1,2 1,0 Pump storage – production 0,5 1,0 1,2 0,8 Compressed air energy storage 32 50,5 18,1 5,7 Compressed air energy storage production 32 33,5 18,1 4,3 Reimports of electricity 0 0 0 76,4
Table 4: The scenario 1.a and 2.1.a: Total production in TWh and installed capacity in GW, in 2050
The lower capacity in 2.1.a does not lead to a corresponding reduction in the production, which means that the installed productions units have higher annual capacity factors in 2.1.a than in the first scenario (2.5 to 3.1). Further, the need for overproduction is reduced in 2.1.a. The overproduc-tion in 1.a is first of all used in the air pressure storage units, where more than 50 TWh is stored during one year. In 2.1.a, this is reduced to 18 TWh. Instead, large amounts of electricity are here exported to Denmark/Norway in periods with overproduction, and stored in Norway’s large hydro storage magazines. This is reimported in seasons when Germany lacks renewable production. The reimports are estimated to 76 TWh. This corresponds to almost the total storage potential of the Norwegian hydro power magazines, and equates to 60 percent of the total electricity production in Norway (2010).
The larger capacity in 1.a is mainly distributed between bio and PV. The national scenario 1.a con-tains a remarkably higher share of PV: 88 TWh against 42 TWh in the regional system 2.1.a. Also the production of biomass and biogas is halved in the regional scenario.
The calculated costs for the two scenarios amounts to 46 billion €/year or 9.0 CT/kWh for the na-tional scenario 1.a, and 36 billion €/year or 5,1 ct/kWh for the regional system 2.1.a.
Blueprint Germany
WWFs study is not primarily occupied with estimating the development of renewable energy in Germany up to 2050. They use the estimates in the “Leitstudie 2008” by DLR33, which assumes a
total of 472.4 TWh available electricity from renewable sources by 2050, of which 351.4 TWh are nationally produced. Final electricity consumption is somewhat lower; 330 TWh in 2050.
WWF has made one modification from projections in DLR (2008), which is to reduce the amount of electricity from biomass by 2050 from 53.8 TWh to 41.3 TWh.
The study presents an innovation scenario which is an ambitious scenario with large emission re-ductions and remarkable deployment of renewable energies. There are two versions of this sce-nario: One with and one without CCS. In the CCS-scenario the CCS technology will be available from 2025. Among the important assumptions for this scenario is the developmentof high ef-ficiency batteries for the use in electric vehicles and for balancing of power production, as well as the development of electric cars. Further, they assume improved technologies for PV and biofuel production.
The amount of renewable energies in the innovation scenario both with and without CCS is drawn from the DLR 2008- study.
2005 2020 2030 2040 2050
Renewable energy 60 339 Wind total 27.2 87,2 142,2 186,7 209.3 Wind offshore - 33,7 84,1 123 142,4 PV 1.2 15,5 21,9 25,3 27.7 Biomass 12 46,2 44,7 41,3 41.3 Hydro (floating and storage) 19.6 24,3 24,6 24,8 24.8 Geothermal - 1,8 6,0 14,7 35.7 Net electricity production 583 485 428 403 405
Table 5: Net Electricity production in the innovation scenario without CCS 2005- 2050, in TWh
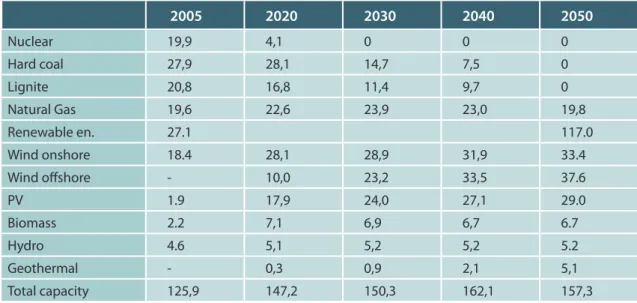
2005 2020 2030 2040 2050
Nuclear 19,9 4,1 0 0 0 Hard coal 27,9 28,1 14,7 7,5 0 Lignite 20,8 16,8 11,4 9,7 0 Natural Gas 19,6 22,6 23,9 23,0 19,8 Renewable en. 27.1 117.0 Wind onshore 18.4 28,1 28,9 31,9 33.4 Wind offshore - 10,0 23,2 33,5 37.6 PV 1.9 17,9 24,0 27,1 29.0 Biomass 2.2 7,1 6,9 6,7 6.7 Hydro 4.6 5,1 5,2 5,2 5.2 Geothermal - 0,3 0,9 2,1 5,1 Total capacity 125,9 147,2 150,3 162,1 157,3
Table 6: Installed capacity in the innovation scenario without CCS 2005- 2050, in GW
Klimaschutz: Plan B 2050
The Greenpeace-scenario presumes a very high potential for geothermal energy, much higher than all the other scenarios. The total share of this energy is foreseen for usage in combined heat and power stations (CPHs). This is also true for the biomass energy. In 2050, power production from CPHs is estimated to 140 TWh, of which 93 TWh is geothermal energy and 45 TWh derives from biomass.
2007 2020 2030 2040 2050
Renewable energy 174 257 340 468 Wind total 100 160 213 255 Wind offshore 35 85 130 165
PV 20 30 40 50
Biomass 25 27 35 45 Hydro (floating and storage) 24 25 25 25 Geothermal 5 60 37 93 Net electricity demand 529 466 446 446 465
Table 7: Electricity production in Germany 2020 – 2050, in Twh
It is interesting to notice that the Greenpeace scenario operates with considerable lower estimates for wind energy and PV than SRUs 1.a, which is the only other 100 percent renewable scenario which assumes national production (and storage). SRU foresees the need for almost 400 TWh wind against Greenpeace’s 255 TWh. SRU also need almost 90 TWh PV, 40 TWh more than Greenpeace. The reason for this is on the one hand, that net electricity demand in the Greenpeace scenario lays 40 TWh below SRU. On the other hand, SRU calculates an overproduction for storage and fluctua-tion purposes.
The Plan B does not say anything about required storage measures, nor does it give any numbers for the installed effect of renewable power capacity, which will be necessary in order to deliver the calculated electricity amount. The Plan B therefore operates with a one-to-one production and de-mand of renewable energy. The question about what will happen if the 305 TWh fluctuating wind and solar energy does not occur at the time as the consumer’s need for it remains uncommented.
IMPORTS OF ELECTRICITY
The Energy Scenarios assume a European electricity market by 2050. The energy scenarios there-fore show considerable import rates between 94 and 143 TWh (between 22 percent and 31 per-cent of total demand). In the scenario considered here (I A), there will be a net import of 103 TWh in 2050. In 2008, Germany was a net exporter of electricity with 22 TWh.
The Energy Scenarios also assume a remarkable establishment of interconnectors, both from the European continent to Scandinavia and the UK and from southern to the middle of Europe. Between Denmark and Norway, they presume between 2500 and 4000 MW new capacity. Also between Germany and Sweden 2500-4000 MW new capacity is estimated, and at least 1500 MW between Germany and Denmark. In total, the scenarios assume that the cross-border transmission capacity will increase by 250 percent. Not all of this electricity will be renewable.
The import rates are presumed to develop as described in the table below.
2008 2020 2030 2040 2050
- 22,5 (export) - 22,4 (export) 38,9 (17,9 RES) 76,3 (43,3 RES) 102,1 (66,9 RES)
Table 8: German import rates in the Energy Scenarios, scenario IA in TWh, renewable share in brackets
The high import rates shall contribute to a cost-efficient achievement of the climate targets, as the Energy Scenarios presumes that there will be cheaper renewable production abroad.
It has been commented that the Energy Scenarios actually replace the need for storage of elec-tricity through a balancing in the elecelec-tricity grids, and that this balancing will take place across the European borders. This would be enough to balance supply-demand discrepancies in an 80 percent renewable power system in Germany. The Energy Scenarios further assume that an “opti-mized European balancing” of the electricity is cheaper than the establishment of storage systems. The SRU-study has carried out the most detailed calculations of the role electricity imports and storage in a 100 percent renewable electricity system. As mentioned earlier, they have calculated different scenarios, which allows for different import shares. We shall here comment on scenario 2.1.a, as this is the one considered most realistic by the SRU. This is also the scenario that allows for a power exchange with Norway and Denmark, but where 100 percent of the production takes place nationally.
In 2.1.a, there is a high level of exchange of electricity between the three countries, which takes place with very short intervals. As much as 76 TWh is exported, stored and then reimported during one year. The high shares of wind power plants in Germany leads to high productions peaks on some days, when the electricity is exported. The next day or week, the exported excess energy is reimported to compensate for lack of production on days with less production in Germany. Figure 2 from the SRU shows that daily exports/imports can be as much as 40 GW on several days in the month of March. The SRU models find that a maximum capacity of 50 GW in- and output is re-quired for scenario 2.1.a.
Figure 3: German capacity load in typical March, by source (export and import included)34
Blueprint Germany estimates a limited net import in their innovation scenario with CCS. The esti-mate is a residual figure resulting from demand, development of renewables and development of gas-fired and storage power plants needed to regulate electricity. These imports are assumed to derive exclusively from renewable sources.
2008 2020 2030 2040 2050
- 22,5 (export) 0 15 33 48
Table 9: Net imports in Germany, 2008 - 2050 in TWh (Blueprint Germany)
Greenpeace’s Plan B 2050 has calculated a nationally closed balance of power generation and con-sumption in Germany. This means that the total amount of electricity consumed in Germany is produced in German power plants and that emission reductions take place within the country. However, an international electricity trade is not excluded, provided that the import-export rate remains balanced. The study does not estimate any figures for import / export rates, nor do they say to which countries the trade will take place. They mention the large potential for PV deploy-ment in North-Africa, but these potentials are not part of the model calculations.
ENERGY STORAGE
In the Energy Scenarios, it is recognized that the energy use of storage entities increases as a result of deployment of wind energy and PV. The scenarios also discuss peak load technologies and de-mand side management as options to meet fluctuating renewable capacity.
As the energy scenarios allows for the use of fossil energy, the authors nevertheless foresee that the flexible production of wind and solar is regulated by the availability of gas power plants. These gas power plants will only be in operation for a low number of hours per year, and are character-ized by low investment costs and high variable costs. Even though fossil fuels will have only 20
percent of the production, 29 percent of installed capacity is in fossil power plants (27 GW coal and 20 GW gas). Especially in the scenario I A gas has an outstanding role: gas is the most impor-tant non-renewable power producer with a share of 44 percent of the total non-renewable pro-duction capacity in 2030. Demand side management is supposed to contribute with 2.6-3.2 GW to securing peak load in the long term.
In the SRU-study, different storage options are described in detail. The study concludes that a 100 percent renewable electricity supply in Germany requires storage technologies with large storage capacity for the purpose of balancing daily, weekly and yearly electricity loads. Hence, the follow-ing technologies are taken into account: pump storage, compressed air energy storage, chemical storage (i.e. hydrogen) and electrochemical storage with batteries.
The SRU study considers that German renewable electricity output could in a first step be used to cover parts of Norway’s electricity demand and thus replace hydro power plant operation. The consequent dormant water volumes could be used later to export electricity to Germany. The long term minimum load that would be available for this arrangement in the Norwegian supply zone is at least 7 GW (SRU 2011). This is an arrangement, which could begin immediately insofar as German renewable electricity generation peaks exceed domestic demand and the requisite trans-mission capacity has been installed.
Germany can currently interchange approximately 1.5 GW of capacity with Norway, via Denmark. Another 1.4-2.8 GW is currently in planning. In order to facilitate for 50 GW of available load in the Norwegian system reduction to be fully used, the SRU estimates that transmission capacity amounting to approximately 45 GW above and beyond the foregoing capacity would need to be installed between Norway and Germany. Further, they foresee expansion of Norwegian turbine capacity:
“To obtain the approximately 50 GW input and output capacity required for scenario 2.1.a, the tur-bine capacity of Norwegian power plants (currently 22 GW) would have to be expanded, apart from stepping up pumping capacity. This would necessitate the construction of additional inflow tun-nels, pressure shafts, pumps and turbines whose realization would necessitate long term planning and sufficiently long lead times. According to our calculations, these expansion projects could be completed more rapidly than the counterpart North Sea transmission line build-out or installation of high voltage line capacity from the German North Sea coast to German centers of electricity con-sumption. These relatively short lead and planning phases are mainly attributable to the fact that no new storage lakes would have to be created and that most of the construction work would take place underground (excavating pump/turbine tunnels and caverns).” (SRU 2011)
According to SRU’s analysis, the concern that Norwegian reservoir capacity is too low to compen-sate for shortfalls in German renewable electricity generation is unfounded. Instead, they argue that Norwegian hydro power would match extremely well with German renewable electricity generation.
The SRU also admits that scenario group 2 involving a German-Danish-Norwegian network is an idealized case; as it is highly likely that other European states that plan to expand their renewable electricity use would also want to take advantage of this potential. Still, other European states such as France, Austria, Switzerland, Italy and Spain also have considerable storage hydroelectric power station capacity. Thus, the SRU assumes that there would be no storage capacity shortfall if the requisite capacity conversions are carried out.
The Blueprint Germany study recognizes that the great expansion of power generation from fluctuating renewable sources will pose special challenges for the expansion of storage capac-ity as the need for balancing power rises. At the same time, the potential for pumped storage in
Germany is as good as exhausted. According to the authors, there must be made use of alternative storage techniques, like for instance compressed-air storage. In the innovation scenario without CCS, the authors calculate an increased demand for storage capacity in Germany from 5.4 GW in 2005 to 20.4 GW in 2050. This produced power from storage systems is estimated to 54.7 TWh in 2050. The storage units will take a main position in balancing the fluctuating renewable electricity production. Their share of net power generation will grow from 1.2 percent to 13.5 percent. Table 10 shows its estimates for how much electricity that will be consumed – i.e. “lost” – in German stor-age systems from 2005-2050 in the innovation scenario without CCS.
2005 2020 2030 2040 2050
11 21 35 56 90
Table 10: Electricity consumption in storage units 2005 – 2050, in TWh
Blueprint Germany hence operates with a net power consumption of 453 TWh, but a final electric-ity consumption of only 330 TWh in 2050. As much as 90 TWh is lost in storage systems, 25 TWh are losses in the grid and 8 TWh is lost in conversion of voltage. The Greenpeace scenario does not treat electricity storage as a separate topic. Their focus is on production of renewable, which they conceive as sufficient to meet electricity demand in 2050. They nevertheless describe the fluctuat-ing PV production as a “large plus” because the peak loads in the grid merges with the maximum solar supply. The study expects that “different heating-storage-systems will make it possible to run the solar power stations continuously in close future”.
ELECTRICITY GRIDS
The Energy Scenarios presumes the strengthening of a European Power market in all scenarios. This preconditions a substantial deployment of power grids in Germany as well as transnationally. As much as a triplication of both national and transnational interconnectors will be necessary by 2050. The expanded grid will facilitate for the considerable amounts of electricity imports, com-mented on above.
The anticipated grid expansion goes far beyond the existing plans for grid constructions. It would require enhanced efforts in European coordination, planning, approval and execution of concrete measures. It also implies acceptance for new grids among the local population.
If the grid will not be accordingly expanded, electricity demand in the large German consumption areas will have to be met through other means than cheap renewable electricity from abroad. The Energy Scenarios here suggests the options of nuclear energy (which is now extremely unlikely), domestic renewable electricity or fossil generation with carbon capture and storage.
The SRU has in “Pathways towards a 100 percent renewable electricity system” excluded the costs of grid expansion within Germany from their computations of mean conventional and renewable electricity generation costs.
In SRUs scenarios, offshore wind power is going to be Germany’s main source of renewable tricity in the coming years from a technical and economic standpoint. Of Germany’s 509 TWh elec-tricity demand in 2050, offshore wind farms account for nearly 320 TWh, with the main generation capacity located at a considerable distance from the electricity demand centers in western and southern Germany. In addition, a large proportion of Germany’s onshore wind energy capacity is located in the northern coastal region (56-90 TWh/a).