MORE THAN SCORES
An Analysis of Why and How
Parents Choose Private Schools
JAmeS P.
KElly
, III, J.D. and
BenJAmIn
SCAfidi
, Ph.D.
november 2013
THE fRiEdMAN fOuNdATiON
for eDuCAtIonAl CHoICe
The Friedman Foundation for Educational Choice is a 501(c)(3) nonprofit and nonpartisan organization, solely dedicated to advancing Milton and Rose Friedman’s vision of school choice for all children. First established as the Milton and Rose D. Friedman Foundation in 1996, the Foundation continues to promote school choice as the most effective and equitable way to improve the quality of K-12 education in America. The Foundation is dedicated to research, education, and outreach on the vital issues and implications related to choice in K-12 education.
MORE THAN SCORES
An Analysis of Why and How
Parents Choose Private Schools
JAmeS P.
KElly
, III, J.D. and
BenJAmIn
SCAfidi
, Ph.D.
Executive Summary ...1
Introduction ...3
Public Education and School Choice ...4
Social and Cultural Challenges Facing Parents and K–12 Education in America ...5
The Georgia Education Expense Credit and Georgia GOAL Scholarship Program ...7
2013 GOAL Parent Survey ...8
GOAL Scholarship Parents are Satisfied with Their Private School Choices ...9
Why Did GOAL Scholarship Parents Choose to Enroll Their Children in Private Schools? ...10
Differences across Demographic Groups and Urbanicity ...14
Summary of Survey Results Regarding Why Parents Chose a Private School ...15
What Information Do Parents Wish to Consider When Choosing a Private School for Their Child? ...15
Differences in Information Desired across Demographic Groups and Urbanicity ...18
Would a More Efficient Spontaneous Education Order Arise through Informed Parental Choices? ...19
What Steps Would Parents Take to Obtain Information about Prospective Schools? ...19
Whether the Steps Parents Would Take to Gain Information about Schools Vary across Demographic Groups and Urbanicity ...20
Summary of Survey Results Regarding Steps Parents Would Take to Gain Information ...20
Ability of Parents to Obtain Desired Information ...20
Summary of Survey Results Regarding Whether Schools Failing to Provide Some Information Desired by Parents Would Impact Parent Decisions ...21
Creation of a Spontaneous Education Order...21
Parents as Active Education Consumers Who May Transform Private K–12 Education and Help Build a Spontaneous Education Order ...24
Similarities among Studies that Survey Parents about Schooling Choices ...24
Unique Insights from the 2013 GOAL Parent Survey ...26
A Spontaneous Education Order May Change Parents’ Preferences for Schools ...26
Conclusion ...27
Table 1: Demographic Characteristics ...8
Table 2: Reason for choosing a private school for their child ...10
Table 3: Most important reason for choosing a private school for my child ...11
Table 4: Second most important reason for choosing a private school
for my child ...11
Table 5: Third most important reason for choosing a private school
for my child ...12
Table 6: Top three reasons for choosing a private school for my child ...12
Table 7: Top five reasons for choosing a private school for my child ...13
Table 8: What information about private schools is important in
helping select the best private school for your child? ...16
Table 9: What information about private schools is most important in
helping select the best private school for your child? ...17
Table 10: What information about private schools is second most important
in helping select the best private school for your child? ...17
Table 11: What steps would you take to get desired information about
private schools? ...20
Table 12: Confidence in obtaining desired information on my own ...21 Table 13: If a private school declined to provide you with some of your desired
Executive Summary
This report uses the results of a survey administered to Georgia parents of K–12 private school scholarship recipients to address three questions:
• In choosing the private school education best suited for the overall needs of their children, do parents primarily focus on the results from standardized tests administered to students attending the school or do they rely on a variety of factors, including student safety, class size, classroom discipline, religious education, high school completion and post-secondary success, and a greater sense of community?
• To enable parents to make informed choices regarding the education of their children, what information should private schools provide to them and to the community at large?
• If state and local governments empowered parents to educate their children in the public or private schools of their choice, and parents were able to secure relevant information relating to those choices, would a more efficient “spontaneous education order” arise?
We address those questions in light of the following: • Frustrated by the failure of many local public school districts to educate their students adequately, parents, politicians, and policymakers are considering alternative systems for the delivery of K–12 education in America.
• American youth, their parents, and educators are facing a wide range of social and cultural challenges that add great complexity and uncertainty to the K–12 education mission.
• The implementation of K–12 school choice programs (e.g., tax-credit scholarships and vouchers) in many states is producing a large number of parents who, for a variety of reasons, have transferred their children from public to private schools.
In 2013, Georgia GOAL Scholarship Program, Inc. (GOAL), a tax-exempt, nonprofit student scholarship organization operating under Georgia’s Education Expense Credit (i.e., tax-credit scholarship) law, asked the parents of scholarship recipients to complete a survey pertaining to the reasons they chose a private school for their children and the information about private schools that they deem important to the school selection process. The results of the surveys completed by 754 GOAL parents indicate they have a variety of reasons for transferring their children from public schools to private schools and that they rely on a wide variety of information in evaluating prospective private schools.
Key findings from the survey include:
• Surveyed parents were overwhelmingly satisfied with their private school choice, with 98.6 percent of parents being “very satisfied” or “satisfied” with their decision to send their children to a private school using a GOAL scholarship.
• The top five reasons why parents chose a private school for their children are all related to school climate and classroom management, including “better student discipline” (50.9 percent), “better learning environment” (50.8 percent), “smaller class sizes” (48.9 percent), “improved student safety” (46.8 percent), and “more individual attention for my child” (39.3 percent).
• Student performance on standardized test scores is one of the least important pieces of information upon which parents base their decision regarding the private school to which they send their children. Only 10.2 percent of the parents who completed the survey listed higher standardized test scores as one of their top five reasons why they chose a particular private school for their child.
• Parents desire a wide variety of information to help them decide where to send their children to school, including, but not limited to, the student-teacher ratio (84.2 percent), school accreditation (70.2 percent), curriculum and course descriptions (69.9
percent), college acceptance rate (61.3 percent), and the availability of religious instruction (56 percent). In contrast, only 21.5 percent of the parents listed “the racial, ethnic, and socioeconomic makeup of the student population” as being important to their school selection process.
• Parents desire to be informed education consumers, with about 93 percent of parents indicating they would be willing to take three or more time- consuming steps to obtain the desired information. • Contrary to the assertions of some school choice opponents, low-income parents, single parents, African-American parents, and parents with less than a college education are willing and able to be informed and active education consumers on behalf of their children.
• Because they risk losing students to other K–12 schools in the educational marketplace, private schools have an incentive to voluntarily provide the information desired by parents. Based on the survey results, the failure of a private school to provide information would (79 percent) or might (20 percent) negatively impact a parent’s decision on whether to send his or her children there.
By providing parents with private (e.g., tax-credit scholarship) or public (e.g., voucher) funds for the education of their children at the private schools of their choice, it is possible to create a spontaneous education order.
In a spontaneous education order, empowered parents would seek information about private or public schools in their communities. In turn, to remain competitive, private or public schools would need to publish or otherwise make available the information sought by parents. And, rather than implementing onerous “rules of organization” that are used to perpetuate and micro-manage a government-run K–12 education monopoly, public officials would institute minimum “rules of just conduct,” which would protect the spontaneous education order from anti-democratic practices or tangible threats to child safety.
The adoption by many states of tax-credit scholarship or voucher programs is the first step toward building a pro-parent and pro-family spontaneous education order. To build on that important development:
• State and local officials and private schools should consider the reasons why parents are choosing to transfer their children from public schools to private schools.
• Parents should inform private schools about the information they deem important in making their decisions regarding the schools to which they send their children.
• Nonprofit education foundations, policymakers, parents, school choice advocates, researchers, and associations of private independent schools should (1) communicate on how to build online platforms for the publication and sharing of information about private schools that parents deem important to the school selection process and (2) reach consensus on those minimum rules of just conduct that are necessary to prevent private schools from engaging in anti-democratic practices and to prevent private schools from creating environments that lead to tangible threats to child safety.
• Given the low priority parents place on standardized test scores in choosing the private schools best suited for their children, public officials should resist the temptation to impose national or state standards and testing on private schools or demand that private schools publish “report cards” emphasizing test score performance.
introduction
Those remarks, made by Superintendent Laing at a December 2011 informational forum to discuss the expansion of the Milwaukee Parental Choice Program, represent the view of many school choice opponents that parents are incapable of making “good” choices for the education of their children outside the public schools to which they are assigned by ZIP Code. Yet, rather than seeking to understand the reasons why parents select a particular school for their children or to help them become informed education consumers, many public officials either deny parents the opportunity to take advantage of alternative educational options or impose on private schools the same standardized curriculum, testing, and assessment methods used in public schools. As states provide parents with greater opportunities for access to learning through tax-credit scholarships and vouchers, it is critical to evaluate the reasons parents choose particular schools for their children, the information upon which they rely in doing so, and the policies and practices that are required to create a “spontaneous education order” that empowers them.
This report uses the results of a survey administered to Georgia parents of K–12 private school scholarship recipients to address three questions:
• In choosing the private school education best suited for the overall needs of their children, do parents focus primarily on the results from standardized tests administered to students attending the school or do they rely on a variety of factors, including student safety, class size, classroom discipline, religious education, high school completion and post-secondary success, and a greater sense of community?
• To enable parents to make informed choices regarding the education of their children, what information should private schools provide to them and to the community at large?
• If state and local governments empowered parents to educate their children in the public or private schools of their choice, and parents were able to secure relevant information relating to those choices, would a more efficient spontaneous educational order arise?
The purpose of this study is to address those questions based on the results of a 2013 survey completed by 754 parents whose children received scholarships to attend the private schools of their choice under the Georgia GOAL Scholarship Program (GOAL). GOAL operates the largest Student Scholarship Organization (SSO) in Georgia. Georgia law permits taxpayers to receive a state income tax credit for private contributions made to qualified SSOs.2 The SSOs use the contributed funds
to award scholarships to families for the education of their children at accredited private schools.
Prior to examining the survey results, this report will briefly examine current alternatives to traditional public schools, the social and cultural challenges families and K–12 education in America are facing, and the nature of the Georgia Education Expense Credit (i.e., tax-credit scholarship) and related Georgia GOAL Scholarship Program.
African-American families are the
ones who (were) most prone to enroll
their kids in the fly-by-night schools
that cropped up after vouchers
existed…. [African-American
families] don’t know how to make
good choices for their children.
They really don’t. They didn’t have
parents who made good choices for
them or helped them learn how to
make good choices, so they don’t
know how to do that.
— racine unified School District Superintendent Ann laing, Wisconsin1
After examining the survey results, this report will outline the nature of a spontaneous education order that could arise from the free actions of informed K–12 education consumers and private K–12 schools free of unnecessary government regulations. We conclude with several policy and practical recommendations that would promote such an order.
Public Education
and School Choice
Measured in constant 2011–12 dollars, real spending per student in American public schools—adjusted for inflation—has increased from $764 per student in the 1919–20 school year to $13,692 in the 2009–10 school year. That represents an increase in real spending per student of 1,692 percent.3 Yet, in all areas of
America—rural, urban, and suburban—parents have become increasingly concerned that they cannot secure a quality education for their children at the public schools to which their children are assigned. Of greatest concern has been the ongoing failure of many urban public school districts to successfully educate a large percentage of their students.4
Tired of being told by politicians and others to “be patient” and support efforts to improve the local public schools, many parents are demanding greater access to other learning opportunities. To meet that demand, state legislators have enacted a variety of alternatives to traditional public schools, including:
• public charter schools,
• online public “cyber” academies, • career academies,
• tax-credit scholarship programs that grant taxpayers state income tax credits for their private contributions to nonprofits that award scholarships to children to transfer from public schools to the private schools of their parents’ choice,
• voucher programs in which the state provides public
funds to parents that they can use to pay all or a part of the tuition at the private school they choose for their children to attend, and
• more flexible homeschooling options, including hybrid schooling where students receive instruction from more than one delivery mode (e.g., homeschool, face-to-face, and/or online instruction).5
As those so-called “school choice,” “educational choice,” or “parental choice” options have proliferated, so has opposition from those with a vested interest in protecting the status quo in public education, including the leaders of teachers’ unions, public school board associations, and public school superintendent associations. Those opponents of providing parents with more education options either fight against the adoption of those alternatives or, if school choice programs are enacted, work to weigh them down with many of the cumbersome rules and regulations that apply to traditional public schools.6
Although early opposition to school choice included business, civic, and foundation leaders, many of those individuals have started to embrace the idea that, rather than perpetuating the government-operated public school monopoly, the government should empower parents to choose from a variety of options to educate their children.7
Some supporters of school choice programs believe that, as a condition of being eligible to participate in voucher or tax-credit scholarship programs, private schools should be required to administer the same standardized tests offered to public school students. To the contrary, other supporters of school choice believe the focus should be on empowering parents to choose schools based on what is in the best interests of their children. In the latter case, it is important to identify the variety of reasons parents choose to enroll their children in private schools, to identify the types of information upon which parents rely in choosing the best school for their children, and to encourage private schools to provide the information that will enable interested parents to become informed consumers relating to the K–12 education of their children.
Social and Cultural Challenges
facing Parents and K–12
Education in America
Any meaningful discussion of parents’ preferences in choosing the most appropriate education for their children can take place only in the context of the difficult social and cultural conditions facing elementary and secondary school families in modern America. Some of the relevant statistics include the following:
• In 2011, 40.8 percent of all births were to unmarried mothers. Among Hispanics, that figure was 53 percent and, among blacks, it was 72 percent.8
• As of 2011, 25.8 percent of children in America were being raised by a single parent.9
• In 2012, 6.5 percent of eighth graders, 17 percent of 10th graders, and 22 percent of 12th graders used marijuana in the past month.10
• As of 2012, 11 percent of all American children ages four to 17 (more than six million in all) have been diagnosed with attention-deficit hyperactivity disorder (ADHD), an increase of 16 percent since 2007.11
• In 2012, 14.8 percent of high school seniors used a prescription drug non-medically in the past year. Data for specific drugs show the most commonly abused prescription drugs by teens are the stimulant Adderall and the pain reliever Vicodin.12
• In 2010, only 52 percent of black male ninth graders graduated from high school in four years, compared with 58 percent of Latino male ninth graders and 78 percent of white, non-Latino male ninth graders.13
• On any given day in 2007, nearly 23 percent of all young black men ages 16–24 who had dropped out of high school were in jail, prison, or a juvenile justice institution in America.14
• Black high school dropouts in 2007 experienced the highest jobless rate at 69 percent followed by Asians at 57 percent and whites at 54 percent.15
• In a 2011 nationally representative sample of youth in grades nine through 12, 12 percent reported being in a physical fight on school property in the 12 months before the survey; 5.9 percent reported they did not go to school on one or more days in the 30 days before the survey because they felt unsafe at school or on their way to or from school; 5.4 percent reported carrying a weapon on school property one or more days in the 30 days before the survey; and 20 percent reported being bullied on school property and 16 percent reported being bullied electronically during the 12 months before the survey.16
• In 2011, students ages 12–18 were victims of about 1,246,000 nonfatal victimizations at school, including 648,600 thefts and 597,000 violent victimizations (simple assault and serious violence).17
• During the 2009–10 school year, 16 percent of public schools reported that gang activities had occurred and about 20 percent of students ages 12– 18 reported that gangs were present at their schools.18
• As classroom discipline problems undermine teacher control and effectiveness and the learning environment for students, instead of helping state and local school districts address the problem, the U.S. Department of Education and U.S. Department of Justice have launched a campaign against public school districts that, in their view, engage in the disproportionate discipline of minority students, especially black and Hispanic students.19
• Among U.S. high school students surveyed in 2011, 47.4 percent had engaged in sexual intercourse; 33.7 percent had engaged in sexual intercourse during the previous three months; 15.3 percent had sex with four or more people during their life; an estimated 8,300 young people
ages 13–24 years in the 40 states reporting to the Centers for Disease Control and Prevention had an HIV infection in 2009; nearly half of the 19 million new STDs each year are among young people ages 15–24 years; and more than 400,000 teen girls ages 15–19 gave birth in 2009.20
• About 11 percent of adolescents have a depressive disorder by the age of 18, and major depressive disorder is the leading cause of disability among Americans ages 15–44.21
• Efforts to stop school staff cheating on standardized tests in public school districts throughout America “have been constrained by factors including bureaucratic inertia, budget constraints, and, sometimes, staff and community resistance.”22
Remarkably, considering the gravity and impact of those alarming statistics and facts, few public discussions or debates about them occur at the national, state, or local level. Perhaps because of political correctness, the complexity of the problems, the potential of enormous costs associated with remedying the problems, or the knowledge that, even with increased funding and programs, public school districts are often ill-equipped to navigate toward viable solutions, politicians are leaving it to parents to do their best to protect their children from becoming statistics. Unfortunately, the limited financial resources of most families preclude them from looking for solutions outside of the public schools to which their children are assigned.
Though all parents face the decision about where to secure the best education for their children, the decision pertaining to the education of a particular child is an original one. It takes place in the context of unique biological, familial, cultural, economic, and social conditions faced only by the parents and their child. The distinctive ability of parents lies in their capacity to embark successfully on lines of enquiry, which other parents, faced with the same opportunities, would not have recognized or not have thought worthwhile. This is their originality.23
Originality entails a distinctively personal initiative and is invariably impassioned, sometimes to the point of obsessiveness. From the parents’ first awareness of the need to select a school for their child, and throughout their consideration of this need to the point of its solution, the process of discovery is guided by a personal vision, and sustained by a personal conviction, of what is in the best interests of their child. To exercise their personal responsibility to decide what is in the best interests of their child in the context of the various conditions to which they and their child may be subject is the acceptance of their calling as parents. Accepting their responsibility to pursue the universal aspiration to do what is in the best interests of their child places parents in a transcendent perspective and assures them of their personhood.24 By limiting the
ability of parents to choose freely from among a variety of educational options, or by placing greater emphasis on one or more educational input (e.g., national curriculum standards) or outcome (e.g., standardized test scores) than on others, the government interferes with the calling of parents and affronts their personal freedom and dignity.
Depending on the academic, social, and cultural needs of their children, parents have a variety of reasons for preferring one education model or school to others, with student character formation playing an important role in the decision-making process. By focusing exclusively on a government-financed and government-managed top-down education model, school choice opponents undermine personal and educational freedom and prevent the creation of a spontaneous education order in which informed parents are empowered to choose from a variety of educational options.
As a result, it is critical to understand the variety of reasons why parents choose private schools and the information they need to make informed decisions. This understanding can be achieved by analyzing the results of the 2013 GOAL Parent Survey, a survey of parents of students who receive GOAL scholarships to attend private schools.
The Georgia Education Expense
Credit and Georgia GOAl
Scholarship Program
In 2008, the Georgia General Assembly passed, and Gov. Sonny Perdue signed into law, the Georgia Education Expense Credit Program.25 The key features
of the program include:
• In exchange for contributing to a qualified Student Scholarship Organization (SSO), Georgia taxpayers can receive an offsetting state income tax credit. • An individual can receive a tax credit for a contribution of up to $1,000; a married couple can receive a tax credit for a contribution of up to $2,500; an owner of an interest in a pass-through entity (e.g., S corporation, partnership, or limited liability company) can receive a tax credit for a contribution of up to $10,000; and a C corporation can receive a tax credit for a contribution of up to 75 percent of its Georgia income tax liability. • In 2013, the total education expense tax credits annually available to Georgia taxpayers making contributions to SSOs was increased to $58 million. • The SSOs, which must be nonprofit entities recognized by the Georgia Department of Education, must use the contributions to provide scholarships to students (grades two and above) whose parents want to transfer them from public schools to accredited private schools and scholarships to students who are eligible to enroll in pre-kindergarten through first grade (regardless of whether they are enrolled in a public or private school).
• When making their contributions, Georgia taxpayers may designate the private schools at which they want the SSO to use their contributions for awarding scholarships; however, contributors may not designate that the SSO award a scholarship to a specific student.
• In most cases, SSOs award scholarships based on the recommendations of the private schools to which the scholarship applicant has applied for acceptance. • Georgia law requires that SSOs consider the financial needs of scholarship applicant families. • Although some of the leading SSOs have adopted voluntary guidelines limiting the household income of the scholarship recipients and the amount of scholarship assistance to which they are entitled, the law places no limits on the household income of scholarship recipients and limits the maximum annual scholarship award to the average state and local expenditures per student in fall enrollment in public elementary and secondary education for the state of Georgia. For 2013, this maximum annual scholarship amount is $9,046. • Although participating private schools must be accredited by an accrediting agency recognized by the state of Georgia and most of them administer norm-referenced standardized tests to their students, the law does not require them to administer either norm-referenced standardized tests or criterion-referenced end-of-course tests or graduation examinations.
Created in 2008, Georgia GOAL Scholarship Program, Inc. (GOAL) is the largest of the 36 SSOs operating in Georgia, having received approximately 32 percent of all contributions made by taxpayers to SSOs since the adoption of the law in 2008 through 2012.
Key facts pertaining to GOAL include:
• From 2008 through 2012, GOAL received $54,254,528 in contributions and awarded 8,681 scholarships to 5,220 students, totaling $33,161,165. As of December 31, 2012, GOAL had obligated an additional $17.8 million, earmarked for future scholarship payments and awards. In 2012, GOAL awarded 3,366 scholarships.
• GOAL has adopted scholarship award guidelines, voluntarily adhered to by its participating private
schools, which limit the amount of scholarship awards based on the household income of scholarship applicant families and family size. • As of December 31, 2012, the average federal adjusted gross income of GOAL scholarship recipients was $51,923 ($25,705 adjusted for family size) and the average annual amount of the scholarship awarded to each recipient was $3,815. • The racial breakdown of GOAL scholarship recipients has been 60 percent Caucasian, 25 percent African-American, 5 percent Hispanic/ Latino, 3 percent unknown, and 7 percent other. • Presently, 122 private schools from throughout Georgia participate in the GOAL program.
• An 11-person board of directors governs GOAL, the members of which include representatives from the juvenile justice, business, philanthropic, education, and religious communities.
2013 GOAl Parent Survey
In the spring of 2013, at the request of the authors of this study, GOAL distributed a web-based survey to the parents and caregivers of its scholarship recipients. Hereafter, survey respondents will be termed “parents” for expositional purposes. Parents of GOAL scholarship recipients were asked to fill out the survey, but they were not required to do so. Appendix 1, available at edchoice.org/MoreThanScores, contains a copy of the survey instrument. Parents took the web survey via Survey Monkey, a well-respected online platform for conducting survey research.
Of the 2,685 families who had at least one child receiving a GOAL scholarship and were requested to complete the survey, 962 parents or caregivers responded to the survey—a response rate of 36 percent. Of the 962 parents who took the survey, 754 parents—or 78.4 percent—provided complete data for all questions used in this report. The most common missing variable was a question asking about household income.26
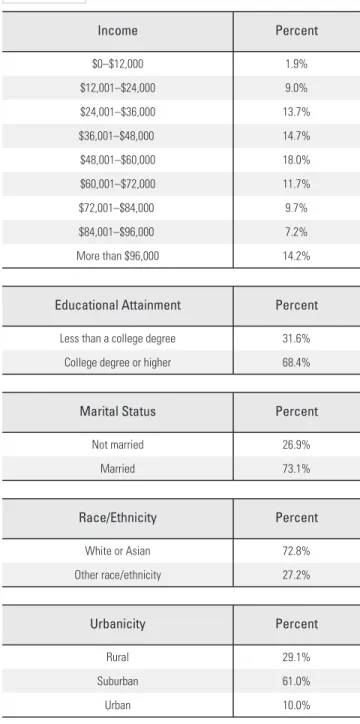
Table 1 shows summary statistics of the demographic characteristics of the survey respondents. Some totals do not equal 100 percent because of rounding. The results show that parents from all geographic areas want to secure the best possible education for their child. Among the parents surveyed, 61 percent live in a suburban area, 29 percent in a rural area, and 10 percent in an urban area. Median family income is in the $48,000–$60,000 range; just more than two-thirds of respondents had
TABLE 1
Demographic Characteristics$0–$12,000 $12,001–$24,000 $24,001–$36,000 $36,001–$48,000 $48,001–$60,000 $60,001–$72,000 $72,001–$84,000 $84,001–$96,000 More than $96,000
1.9% 9.0% 13.7% 14.7% 18.0% 11.7% 9.7% 7.2% 14.2%
Percent Income
Less than a college degree College degree or higher
31.6% 68.4%
Percent Educational Attainment
Not married Married
26.9% 73.1%
Percent Marital Status
White or Asian Other race/ethnicity
72.8% 27.2%
Percent Race/Ethnicity
Rural Suburban
Urban
29.1% 61.0% 10.0%
Percent Urbanicity
obtained at least a college degree; about 73 percent live in married households; and more than 27 percent consider themselves neither white nor Asian.27
To gauge the accuracy of the opinion held by some school choice opponents that many African-American, Hispanic, and Native-American parents are incapable of making good schooling choices for their children, respondent parents were divided into (a) white and Asian and (b) other racial and ethnic categories. As discussed in the pages to follow, the survey results provide evidence that GOAL scholarship parents are capable of making good educational decisions for their children.
The parents who responded to the survey have higher incomes than the typical families of GOAL scholarship recipients. For that reason, we analyzed the data separately for different demographic groups and report important differences in responses.
We do not claim that the survey respondents are a representative sample of low- and middle-income parents in Georgia. Nevertheless, our results do suggest the low- and middle-income parents who are taking advantage of the GOAL scholarship program are active consumers of K-12 education.
GOAl Scholarship Parents are
Satisfied with Their Private
School Choices
Prior to considering the reasons why the surveyed parents chose private schools for their children and the types of information upon which they would rely in doing so again, it is important to note that the surveyed parents were overwhelmingly satisfied with their private school choices.
The survey asked parents about their level of satisfaction with their child’s current private school relative to their satisfaction with their child’s former public school:
“Relative to your child’s prior public school experience (if any), how satisfied are you overall with your child’s current private school experience?”
Parents were able to select that they were “very satisfied,” “satisfied,” “dissatisfied,” or “very dissatisfied.” Relative to their child’s former public school, 84 percent of parents indicated that they were “very satisfied” with the private school they were able to choose for their child under the GOAL scholarship program. An additional 14.6 percent were “satisfied” with their new private school. Only 1 percent indicated they were “dissatisfied,” while only 0.4 percent indicated they were “very dissatisfied.” Thus, 98.6 percent of parents were either “very satisfied” or “satisfied” with their decision to send their children to a private school using a GOAL scholarship.
It is interesting to note that the parents of most GOAL scholarship recipients are making a significant financial investment in sending their children to private schools. In many instances, the GOAL scholarships are substantially less in amount than the tuition charged by the private schools attended by their children. In almost all cases, any financial aid offered by the private schools does not make up that difference. On the one hand, that may make parents more likely to view their investment favorably. More likely, it makes parents more critically evaluate the performance of their children’s private schools.
As of December 31, 2012, the average GOAL scholarship was $3,815. In comparison, for the 2009– 10 academic year (the most recent year for which spending information is available), the average spending per student in Georgia public schools was $10,684.28 In 2011–12, on average, GOAL scholarships
provided 47 percent of the tuition charged by the private schools participating in the GOAL scholarship program. In addition to incurring significant tuition costs, GOAL scholarship families also pay property taxes (directly or indirectly through rent) to support public schools. Yet, they are willing to assume this financial commitment for their children even though almost 70 percent of those families have annual household incomes of $72,000 or less and more than
39 percent had incomes of $48,000 or less.29
The percentages of parents across demographic groups who are either “very satisfied” or “satisfied” with their children’s new private schools relative to their experiences in their former public schools are virtually identical. However, lower socioeconomic parents are slightly more likely to state they are “satisfied” rather than “very satisfied.” There are no discernible differences across urban, suburban, and rural parents regarding satisfaction.
Why did GOAl Scholarship
Parents Choose to Enroll Their
Children in Private Schools?
The first research question we analyze using the survey is:
In choosing the private school education best suited for the overall needs of their children, do parents focus on the results from standardized tests administered to students attending the school or do they rely on a variety of factors, including student safety, class size, classroom discipline, religious education, high school completion and post-secondary success, and a greater sense of community?
To address that research question, the survey explicitly asked GOAL scholarship parents:
“There are many possible reasons why families send their children to a private school, rather than to a public school. Please select each of the following reasons you had for sending your child to a private school (you may mark as many or as few reasons as applied to your situation).”
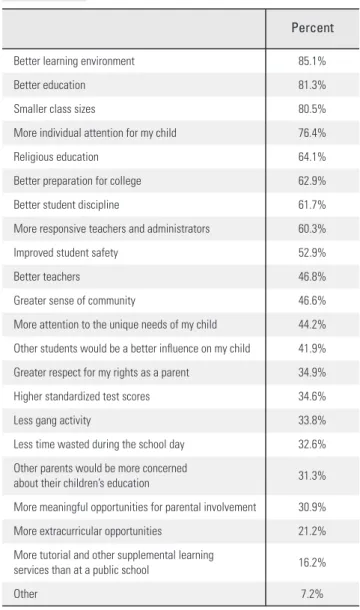
The survey contained a list of 21 possible reasons why parents chose a private school for their children (see Table 2). Parents were allowed to choose more than one reason, and they were also allowed to choose “other.” The reasons for choosing a private school in Table 2 are sorted from the most stated reason to the least.
More than 85 percent of parents said they chose a private school for a “better learning environment” for their child, whereas 81.3 percent said the choice was made for a “better education.” The next two most common responses were “smaller class sizes” (80.5 percent) and “more individual attention for my child” (76.4 percent). Other reasons cited by a majority of parents were “religious education” (64.1 percent), “better preparation for college” (62.9 percent), “better student discipline” (61.7 percent), “more responsive teachers and administrators” (60.3 percent), and “improved student safety” (52.9 percent).
TABLE 2
Reason for choosing a private schoolfor their childBetter learning environment Better education Smaller class sizes
More individual attention for my child Religious education
Better preparation for college Better student discipline
More responsive teachers and administrators Improved student safety
Better teachers
Greater sense of community
More attention to the unique needs of my child Other students would be a better influence on my child Greater respect for my rights as a parent
Higher standardized test scores Less gang activity
Less time wasted during the school day Other parents would be more concerned about their children’s education
More meaningful opportunities for parental involvement More extracurricular opportunities
More tutorial and other supplemental learning services than at a public school
Other
85.1% 81.3% 80.5% 76.4% 64.1% 62.9% 61.7% 60.3% 52.9% 46.8% 46.6% 44.2% 41.9% 34.9% 34.6% 33.8% 32.6% 31.3% 30.9% 21.2% 16.2% 7.2%
TABLE 3
Most important reason for choosinga private school for my childBetter education Religious education Better learning environment Improved student safety Smaller class sizes Better preparation for college
More attention to the unique needs of my child More individual attention for my child Other
Better student discipline Greater sense of community Better teachers
Other students would be a better influence on my child More responsive teachers and administrators Other parents would be more concerned about their children’s education
More tutorial and other supplemental learning services than at a public school
Greater respect for my rights as a parent Less time wasted during the school day Less gang activity
More extracurricular opportunities Higher standardized test scores
More meaningful opportunities for parental involvement
28.2% 28.1% 10.9% 7.0% 4.4% 4.2% 4.1% 3.3% 3.1% 2.1% 1.1% 0.8% 0.7% 0.5% 0.4% 0.4% 0.4% 0.1% 0.1% 0.0% 0.0% 0.0% Percent
TABLE 4
Second most important reason forchoosing a private school for my childBetter education Better learning environment Smaller class sizes Religious education
More individual attention for my child Better preparation for college Better student discipline Improved student safety Better teachers
More attention to the unique needs of my child More responsive teachers and administrators Greater sense of community
Other students would be a better influence on my child Greater respect for my rights as a parent
Higher standardized test scores Less gang activity
Other
More extracurricular opportunities
More tutorial and other supplemental learning services than at a public school
Less time wasted during the school day Other parents would be more concerned about their children’s education
More meaningful opportunities for parental involvement
16.2% 13.0% 12.3% 11.9% 8.6% 7.8% 5.6% 4.6% 4.4% 4.0% 2.4% 1.6% 1.5% 1.1% 0.9% 0.7% 0.7% 0.5% 0.5% 0.5% 0.4% 0.1% Percent
Parents gave a wide variety of reasons as to why they chose a private school for their child. Among the 21 reasons listed in the survey, 20 of them were cited by at least 20 percent of the survey respondents as a reason for choosing a private school.
Contrary to the concern about standardized test scores expressed by those seeking to impose standardized testing requirements on private school students, the choice “higher standardized test scores” was only the 15th-highest rated reason why parents chose a private school for their children. For comparison, 62.9 percent of parents listed “better preparation for college” as a reason for choosing a private school; however, only 34.6 percent listed “higher standardized test scores.”30 The surveyed parents were
also provided an opportunity to prioritize the reasons they chose a private school. Specifically, they had the opportunity to list the “most important reason,” the “second most important reason,” and the third, fourth, and fifth most important reasons why they chose a private school for their children.
My daughter is getting a quality education. She is raising her standards to those of other college preparatory students. She is in an environment conducive to higher learning with the support system in place to help her.
Parents were provided the same possible reasons as listed in Table 2. The results are contained in Table 3, which lists the “most important” reason why parents selected a private school. The responses in Table 3 are sorted from the most common to the least common response.
Just two reasons accounted for about 56 percent of the responses: “better education” (28.2 percent) and “religious education” (28.1 percent). The next “most important reasons” were “better learning environment” (10.9 percent), “improved student safety” (7 percent), “smaller class sizes” (4.4 percent), “better preparation for college” (4.2 percent), and “more attention to the unique needs of my child” (4.1 percent).
No respondents listed “higher standardized test scores” as the “most important reason” for choosing a private school.
When it came to listing the “second most” and “third most” important reasons for choosing a private school, the variety of reasons offered by parents significantly increased. Tables 4 and 5 contain the responses to those questions, sorted from most common to least common response.
Pertinent to this study, seven out of 754 parents (only 0.9 percent) said that “higher standardized test scores” was the “second most important reason” for choosing a private school. Only 21 out of 754 parents (2.8 percent)
TABLE 5
Third most important reason for choosinga private school for my childBetter learning environment Smaller class sizes
More individual attention for my child Better preparation for college Better student discipline Better education Better teachers Improved student safety Religious education
More responsive teachers and administrators Other students would be a better influence on my child Greater sense of community
More attention to the unique needs of my child Higher standardized test scores
Greater respect for my rights as a parent Other parents would be more concerned about their children’s education
Less gang activity Other
More tutorial and other supplemental learning services than at a public school
More meaningful opportunities for parental involvement More extracurricular opportunities
14.5% 13.1% 11.5% 7.6% 6.6% 5.7% 5.0% 4.8% 4.6% 4.5% 3.3% 3.1% 2.9% 2.8% 1.6% 1.3% 1.2% 1.2% 0.8% 0.8% 0.7% Percent
TABLE 6
Top three reasons for choosing aprivate school for my childBetter student discipline Improved student safety Better learning environment Better education Smaller class sizes
More individual attention for my child Religious education
Better preparation for college Greater sense of community Better teachers
More responsive teachers and administrators More attention to the unique needs of my child Other students would be a better influence on my child Higher standardized test scores
Other parents would be more concerned about their children’s education
Greater respect for my rights as a parent More extracurricular opportunities
More tutorial and other supplemental learning services than at a public school
Less gang activity Other
Less time wasted during the school day
40.3% 37.7% 31.6% 28.9% 25.9% 23.2% 21.0% 15.8% 15.5% 13.7% 10.2% 6.9% 5.8% 4.2% 3.8% 3.1% 2.0% 2.0% 1.9% 1.9% 1.3% Percent
said “higher standardized test scores” was the “third most important reason.”
Table 6 (previous page) analyzes the combined top three reasons for choosing a private school, listing them from most common to least common responses.
Among the survey respondents, there was a very wide heterogeneity in reasons for choosing a private school. The two most common to be listed among the “top three reasons” for choosing a private school were “better student discipline” (40.3 percent) and “improved school safety” (37.7 percent).
Based on the survey results, it appears school climate and classroom management are at or near the top of the reasons why GOAL scholarship parents chose a private school for their child. The term “school climate” is routinely used in education policy discussions and connotes the safety, order, and geniality of the school environment.
The other reasons that garnered more than 20 percent of the parents were “better learning environment” (31.6 percent), “better education” (28.9 percent), “smaller class sizes” (25.9 percent), “more individual attention for my child” (23.2 percent), and “religious education” (21 percent). Thus, seven different items were considered as one of the “top three reasons” for choosing their private school by at least 20 percent of GOAL scholarship parents. This finding provides further evidence parents have a variety of different reasons for choosing a private school.
Only 4.2 percent of parents listed “higher standardized test scores” as one of their “top three reasons” for choosing a private school.
Parent concern about school climate and classroom management is further evidenced by Table 7, which displays the percent of parents who listed each reason as one of their “top five reasons” for choosing a private school. Of the seven items chosen by at least 20 percent of GOAL scholarship parents to be among their “top five reasons” for choosing a private school, the top five have a direct impact on the ability of a student to learn in an orderly, safe, and attentive classroom.
TABLE 7
Top five reasons for choosing a privateschool for my childBetter student discipline Better learning environment Smaller class sizes Improved student safety
More individual attention for my child Better education
Better preparation for college Religious education
More responsive teachers and administrators Greater sense of community
Better teachers
More attention to the unique needs of my child Other students would be a better influence on my child Higher standardized test scores
Other parents would be more concerned about their children’s education
Greater respect for my rights as a parent More extracurricular opportunities Less gang activity
Less time wasted during the school day
More meaningful opportunities for parental involvement More tutorial and other supplemental learning services than at a public school
Other
50.9% 50.8% 48.9% 46.8% 39.3% 36.9% 31.7% 29.7% 23.2% 22.1% 20.3% 14.1% 13.8% 10.2% 8.5% 7.4% 6.9% 6.6% 5.3% 4.6% 4.4% 2.7%
Percent
(In public school) [m]y daughter was bullied, verbally abused, and poorly treated by students, and teachers did not defend or protect her. She was a top student in her class, but the teachers could not keep her occupied with work and ignored her desire to excel.
“Higher standardized test scores” was among the “top five reasons” for 10.2 percent of parents, placing this item in 14th place among the 21 listed reasons for choosing a private school. In contrast, just more than 50 percent of parents placed “better student discipline” or “better learning environment” as one of their “top five reasons” for choosing a private school.
differences across demographic
Groups and urbanicity
In this subsection we highlight the differences in the responses among demographic groups and among urban, suburban, and rural residents—what social scientists term “urbanicity.”
The GOAL scholarship parents surveyed are overwhelmingly low- and middle-income. However, some school choice opponents maintain that low-income parents lack the capacity to make good decisions about the best schools for their children. To analyze that issue, survey parents are separated into two groups: “high-income” and “low-income.” High-income is defined as families with household incomes of $60,000 per year and above. Low-income is defined as household incomes less than $60,000. We do not mean to imply that an income of $60,000 makes a household with children wealthy. Nevertheless, that is a relatively high income for recipients of GOAL scholarships.
There are only small differences across demographic groups in the most important reasons why parents chose a private school for their children:
• For high-income families, 67.4 percent said a “better learning environment” or a “better education” was among their top two for the most important reasons why they chose a private school for their child. The corresponding percentage for low-income families was 69.5 percent.
• Lower-income parents were more likely to say that a “religious education” was one of the top two reasons why they chose a private school for their children—41.9 percent versus 37.8 percent for higher-income parents.
• Parents without a college degree were more likely to list a “better education” as one of their top two reasons for choosing a private school—48.7 percent for parents with less than a college degree versus 42.6 percent for parents with a college degree. • Perhaps reflecting the fact that many unmarried parents live in school attendance zones with low- quality public schools, 36.5 percent of unmarried parents listed a “better education” as their most important reason for choosing a private school for their child, compared with 25.2 percent for married parents.
• Parents identified as neither white nor Asian, many of whom do not have access to good public schools, placed more emphasis on the importance of securing a “better education” for their child than did white and Asian parents, with 40.5 percent of the former listing it as their top reason for choosing a private school versus 23.7 percent in the case of white and Asian parents.
• White and Asian parents were more likely to say that “religious education” was their most important reason for choosing a private school (32.6 percent) versus 26.9 percent for others. With regard to urbanicity, urban and suburban parents
My child was robbed of his opportunity to learn on a daily basis by children who were out of control and disruptive. Learning is challenging for him and he needs structure and a controlled environment. It is unfortunate that we had to sacrifice financially to remove him from public school mainly because of this reason.
had strikingly similar top reasons for choosing private schools for their children. In order, their top three reasons were “better education,” “religious education,” and, in a distant third, “better learning environment.” Rural residents were 10 percentage points more likely than urban and suburban residents to say a “religious education” was the most important reason they chose a private school for their children.
Summary of Survey Results Regarding
Why Parents Chose a Private School
Based on the answers to the question about the reasons for choosing a private school and the questions asking for the most important of those reasons, GOAL scholarship parents have revealed that they most value a safe school climate and effective classroom management, including “better student discipline” (50.9 percent), “better learning environment” (50.8 percent), “smaller class sizes” (48.9 percent), “improved student safety” (46.8 percent), and “more individual attention for my child” (39.3 percent). Answers to that series of questions about why parents chose the schools they did provide strong evidence parents value a variety of school attributes, that different parents value different aspects of private schools, and that standardized test scores are a lower priority (outside of the top five) for about 90 percent of parents surveyed.
The survey responses in this area are evidence that low-income, less-educated, unmarried, traditionally disadvantaged, or urban or rural parents have roughly the same reasons for sending their children to private schools as other parents. In fact, unmarried parents and parents from traditionally disadvantaged racial and ethnic groups were more likely to list a “better education” as the most important reason why they chose a private school for their child. Again, perhaps their lack of access to quality public schools significantly motivates unmarried parents and nonwhite and non-Asian parents to take the private school selection process very seriously.
What information do Parents
Wish to Consider When
Choosing a Private School
for Their Child?
The second main question addressed by this paper is: To enable parents to make informed choices regarding the education of their children, what information should private schools provide to them and to the community at large?
To address that question, the survey contained a second set of questions asking parents to list and prioritize the information they would consider important in deciding about a private school for their child. The first information question in the survey was:
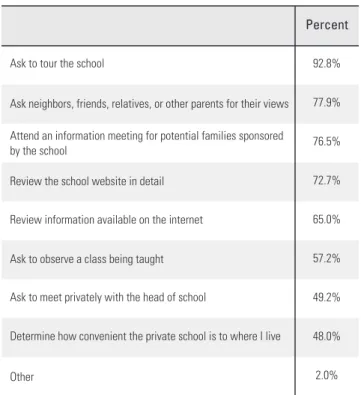
“If your family had to move to another community in Georgia and select another private school for your child to attend, please select which of the following pieces of information about the private schools in your new community you would consider to be important in helping you select the best private school for your child (assuming cost is not a factor). (You may mark as many or as few options as you like.)
“If I were choosing from among affordable private schools for my child or children, I would seek the
[The private school] provides community… like one big family (meaning love and support for my child), she is learning biblical principles for living before God and living in character with others. It provides fun, active, effective learning experiences through a wide variety of modalities. It provides knowledgeable, competent, compassionate teachers to invest in her.
TABLE 8
What information about private schools is importantin helping select the best private school for your child?84.2% 70.2% 69.9% 61.3% 56.0% 52.8% 48.4% 45.9% 45.4% 43.6% 37.8% 37.4% 36.2% 32.5% 24.4% 23.7% 23.2% 23.1% 21.5% 19.1% 14.6% 3.1%
Percent
The ratio of students per teacher and the average class size Evidence that the school is accredited by a recognized school accrediting agency
The curriculum (i.e., content of instructional areas) and course descriptions
The percentage of students who are accepted and attend college Whether the private school teaches your religion or any religion with which you are comfortable
The average performance on standardized tests by students in different grades
The graduation rate for students attending the school The disciplinary policy of the school
The years of teaching experience and credentials of the teachers at the school
Evidence that the private school teaches character education The quality and availability of extracurricular activities The colleges attended by graduates of the school The financial condition of the school
Whether parents have access to the head of school to express any concerns
Whether students have access to tablet, laptop, and classroom computers
The percent of teachers and administrators who leave from year-to-year
Whether computers are used effectively in classroom instruction The frequency and nature of disciplinary actions
The racial, ethnic, and socioeconomic makeup of the student population
The governance of the school, including the members of the board of trustees
The duration of the school year and the hours spent by the students in class
Other
following information to help me decide which private school to choose:”
Table 8 lists the percentage of parents who would consider each particular piece of information to be “important.” As is evidenced in Table 8, GOAL scholarship parents consider a variety of information as important to their choice of education for their children. At least 20 percent of respondent parents consider 19 of the 21 possible pieces of information to be “important” in deciding which private school to send their children. The four pieces of information that had the highest percentage of parents suggesting them as important were “ratio of students per teacher and the average class size” (84.2 percent), evidence the school is accredited (70.2 percent), the “curriculum and course descriptions” (69.9 percent), and the “percentage of students who are accepted and attend college” (61.3 percent).31
Information about “average performance on standardized tests by students in different grades” came in sixth place at 52.8 percent, a somewhat low ranking relative to the disproportionate emphasis that many educators, politicians, policymakers, business leaders, and the media are placing on national standards and standardized testing.
Analogous to the “reasons for choosing a private school” as previously discussed, there may be more useful information in the questions that ask parents to prioritize which information about schools is most important to them when making decisions where to send their children to school. There was a wide variety of responses given by parents as to their first, second, third, fourth, and fifth most important pieces of information about schools they would find important. Tables 9 and 10 (next page) show the percent of parents who list each piece of information as the most and second most important, respectively.
As shown in Tables 9 and 10, there is a somewhat wide divergence among parents as to what are the two most important pieces of information about schools. As to the most important piece of information, 21.1 percent of parents would want to know whether the private school teaches their religion or any religion with which they
TABLE 9
What information about private schools is most important in helping select the best private school for your child?21.1% 18.4% 15.6% 11.0% 8.8% 6.0% 5.4% 2.9% 2.8% 1.6% 1.5% 1.5% 0.7% 0.5% 0.5% 0.4% 0.4% 0.4% 0.3% 0.3% 0.0% 0.0% Percent
Evidence that the school is accredited by a recognized school accrediting agency
The ratio of students per teacher and the average class size The curriculum (i.e., content of instructional areas) and course descriptions
The percentage of students who are accepted and attend college Whether the private school teaches your religion or any religion with which you are comfortable
The average performance on standardized tests by students in different grades
The graduation rate for students attending the school
The disciplinary policy of the school
The years of teaching experience and credentials of the teachers at the school
Evidence that the private school teaches character education
The quality and availability of extracurricular activities The colleges attended by graduates of the school
The financial condition of the school
Whether parents have access to the head of school to express any concerns
Whether students have access to tablet, laptop, and classroom computers
The percent of teachers and administrators who leave from year-to-year
Whether computers are used effectively in classroom instruction The frequency and nature of disciplinary actions
The racial, ethnic, and socioeconomic makeup of the student population
The governance of the school, including the members of the board of trustees
The duration of the school year and the hours spent by the students in class
Other
TABLE 10
What information about private schools is second most important in helping select the best private school for your child?16.7% 14.6% 9.9% 7.7% 7.7% 6.4% 6.2% 6.0% 5.8% 4.5% 3.1% 2.0% 1.6% 1.3% 1.2% 1.1% 1.1% 0.8% 0.8% 0.4% 0.3% 0.1% Percent
Evidence that the school is accredited by a recognized school accrediting agency
The ratio of students per teacher and the average class size The curriculum (i.e., content of instructional areas) and course descriptions
The percentage of students who are accepted and attend college Whether the private school teaches your religion or any religion with which you are comfortable
The average performance on standardized tests by students in different grades
The graduation rate for students attending the school
The disciplinary policy of the school
The years of teaching experience and credentials of the teachers at the school
Evidence that the private school teaches character education
The quality and availability of extracurricular activities The colleges attended by graduates of the school
The financial condition of the school
Whether parents have access to the head of school to express any concerns
Whether students have access to tablet, laptop, and classroom computers
The percent of teachers and administrators who leave from year-to-year
Whether computers are used effectively in classroom instruction The frequency and nature of disciplinary actions
The racial, ethnic, and socioeconomic makeup of the student population
The governance of the school, including the members of the board of trustees
The duration of the school year and the hours spent by the students in class
are comfortable, while 18.4 percent of parents believe evidence that the school is accredited is the most important piece of information. The “ratio of students per teacher and the average class size” (15.6 percent) and the “curriculum and course descriptions” (11 percent) were the only other two pieces of information that were listed by more than 10 percent of parents as the most important.
There is an even wider dispersion in answers regarding the “second most important” piece of information about private schools. Ten of the choices garnered at least 4.5 percent of parents indicating it was the second most important piece of information. The most common responses for the second most important piece of information were “ratio of students per teacher and the average class size” (16.7 percent) and the “curriculum and course descriptions” (14.6 percent). Average test scores placed seventh, with 6.2 percent of parents rating that piece of information as the second most important.
Opponents of school choice often suggest parents will choose schools so that their children are in schools that are homogeneous with respect to race and ethnicity. The survey results do not support that assertion. Only 0.7 percent of parents (five out of 754) listed “the racial, ethnic, and socioeconomic makeup of the student population” as the most important piece of information in helping them to select a private school for their children—only 1.6 percent chose that piece
of information as the second most important piece of information.32
differences in information desired across
demographic Groups and urbanicity
Higher-income and lower-income parents have very similar responses on the top four pieces of information they most desire about private schools—the top four in Tables 9 and 10. However, there is an interesting difference across income. Lower-income parents are more likely to place high school graduation and post-secondary information in their top two pieces of information—relative to higher-income parents. Specifically, as their top two pieces of information about private schools, 19.1 percent of lower-income parents listed either the graduation rate of students attending the school, the percentage of students who are accepted or attend college, or the colleges attended by the graduates of the school. The corresponding percentage for higher-income parents was only 12.1 percent. Lower-income parents are also more likely to place those pieces of information as among their top five.
There is a similar pattern by educational attainment— 40.7 percent of parents who do not have a college degree place those graduation and post-secondary pieces of information in their top two, whereas only 31.5 percent of college graduates do so. And, there is a similar pattern by marital status. Forty-four percent of unmarried parents place those graduation and post-secondary pieces of information in their top two, as compared with only 30.9 percent of married parents.
The corresponding percentages are even more different across racial and ethnic groups. Nonwhites and non-Asians are twice as likely to place high school graduation and post-secondary information in their top two desired pieces of information from private schools that would help them make decisions on where to send their children to school. Of those parents from traditionally disadvantaged racial and ethnic groups, 54.1 percent place that information in their top two, whereas only 27 percent of white and Asian parents do so.
I would look for a school that meets the unique needs of my daughter, teaching methods that are tailored to an individual child’s needs, a community environment where social responsibility and self-advocacy is taught and practiced regularly and methodically, and teachers who are trained and have the experience and desire to work with children who have unique learning differences and needs.