Center on Education Policy
April 2010
State Test Score Trends Through 2007-08, Part 6
Has Progress Been Made
in Raising Achievement for
English Language Learners?
Has Progress Been Made in Raising
Achievement for English Language Learners?
Introduction
The federal No Child Left Behind Act (NCLB) holds schools, districts, and states account-able for improving the academic achievement of all students, including those with limited speaking, reading, or writing skills in the English language. By 2014, 100% of English lan-guage learners (ELLs)—also referred to as “limited English proficient” or LEP students—are expected to perform at the “proficient” level on state reading and mathematics tests, the same goal set for students overall and for other student subgroups. NCLB also calls on schools and districts to close achievement gaps between ELLs and other students and to include ELLs in regular state testing programs to the maximum extent possible. The goal of 100% proficient is something of a no-win situation, however. As a result of immigration, recent arrivals who have not yet mastered English are continually entering the ELL subgroup, while the highest performers who have mastered English eventually leave the subgroup.
This report by the Center on Education Policy (CEP), an independent nonprofit organization, examines progress in raising achievement for English language learners. It also describes the fac-tors that make it difficult to accurately assess what ELLs know and can do. The data for this analy-sis were collected by CEP with technical support from the Human Resources Research Organization (HumRRO) and come from the state reading and mathematics tests used for NCLB accountability in all 50 states. The trends discussed in this report cover fewer years—2006 through 2008—than the trends in recent CEP reports on achievement for students as a whole and achievement gaps for student subgroups. This is because revised federal regulations for test-ing ELLs and determintest-ing their progress under NCLB became final in September 2006. We now have enough data in many states to establish a three-year trend line of test results for ELLs.
Main Findings
In general, English language learners have shown progress on state tests, but this positive news should be viewed somewhat cautiously because language barriers, demographic changes, and changes in state policies for testing and classifying students as ELLs make it difficult to obtain an accurate picture of achievement for this group. Several main findings from our study support this general conclusion:
Because of language barriers, test results for English language learners may not accurately reflect what these students know and can do.It is difficult to design appro-priate accommodations to compensate for ELLs’ lack of English proficiency, particularly when they are tested in reading/language arts. Consequently, questions remain about the reliability of test scores for ELLs and the validity of inferences drawn from these scores. The number of ELL test-takers has changed rapidly in many states, which complicates efforts to track achievement trends for this group.Between 2006 and 2008, the num-ber of ELLs taking tests in grade 4 reading, for example, increased by more than 20% in 19 states, due to immigration, other demographic factors, changes in state testing
poli-C
e
n
te
r
o
n
E
d
u
ca
tio
n
P
o
lic
y
cies, and possible procedural changes that affect which students are classified as ELLs. If the new growth was due to greater numbers of new immigrants and other students with more serious educational needs, then achievement trends could be influenced as much by changes in subgroup composition as by the quality of teaching and learning. In grade 4 reading and math, rising percentages of English language learners have
reached three achievement levels—basic, proficient, and advanced—although gains are less prevalent at the advanced level in reading.For example, 25 of the 35 states with sufficient data made gains in the percentage of 4thgrade ELLs scoring at or above
the proficient level in reading, while 10 showed declines. Overall, states with gains in grade 4 clearly outnumbered those with declines for every achievement level/subject combination except advanced-level reading, in which 14 states had gains, 13 had declines, and 7 showed no net change.
English language learners have made progress in reaching state proficiency benchmarks in reading and math at all three grade levels analyzed—elementary, middle, and high school—although gains are less prevalent in high school than at the other grade levels.In grades 4 and 8 in both reading and math, more than 70% of the states with sufficient data made gains in the percentage of ELLs scoring at the proficient level. At the high school grade tested (usually grade 10 or 11), a slimmer majority of the states with sufficient data, 56%, showed increases in percentages proficient for ELLs.
Trends for English language learners are mostly positive in states with the largest numbers of ELL test-takers. In the 10 states with the most ELL test-takers, positive trends outnumbered negative trends.The four “gateway” states that account for the majority of ELLs nationally (California, Texas, Florida, and New York) made gains across the board—at all three grade spans in both reading and math.
English language learners in grade 4 are doing better in math than in reading at all three achievement levels.Both the number of states with gains and the median per-centages of students reaching various achievement levels were higher in math than in reading. And differences in test performance between ELLs and students overall tended to be smaller, on average, in math than in reading, a finding that is not surprising in light of the language backgrounds of ELLs.
Very large differences in percentages proficient exist between English language learners and other students.Of the 35 states with sufficient data in high school reading, 27 states had differences in the percentage proficient of more than 30 percentage points between ELLs and students who are not English language learners, and 18 states had differences of more than 40 percentage points.
Percentages proficient for English language learners vary widely by state, more so than for students who are not ELLs.In one state, for example, 87% of high school ELLs scored proficient in reading, while in another just 6% of ELLs reached proficiency, a staggering disparity between states. The comparable range for non-ELLs was a high of 94% and a low of 38%. Even after considering the differences that exist among states in standards, assessments, testing policies, and demographics, the low performance of ELLs in some states is surely a cause for concern.
Readers who are interested in trends for ELLs in a specific state are encouraged to access the detailed state profiles of subgroup achievement trends available on CEP’s Web site (www.cep-dc.org).
H
a
s
P
ro
g
re
s
s
B
e
e
n
M
a
d
e
in
R
a
is
in
g
A
ch
ie
v
e
m
e
n
t
fo
r
E
n
g
li
s
h
L
a
n
g
u
a
g
e
Le
a
rn
e
rs
?
Background on the ELL Subgroup and Study Methods
This report, the sixth in a 2009-10 series of CEP reports on student achievement trends,1
focuses specifically on the achievement of English language learners—students with a pri-mary language other than English who have a limited range of speaking, reading, writing, and listening skills in English (U.S. Department of Education, 2007a).2
In 2007, some 20% of U.S. children ages 5-17, or 10.8 million children, spoke a language other than English at home—up from 9% of such children in 1979 and 18% in 2000. About 5% of school-age children, or 2.7 million, spoke English with difficulty according to 2007 data from the U.S. Department of Education (ED) (Planty et al., 2009). Much of the growth in the ELL population has been fueled by immigration. In 2007, 22% of all chil-dren living in the U.S. were either born outside this country or lived with a foreign-born parent, making children of immigrants the fastest-growing segment of the U.S. population under 18 (Mather, 2009).
Roughly 80% of ELLs speak Spanish at home, according to the most recent full-scale stud-ies of ELL demographics by ED (Kindler, 2002; Zehler et al., 2003). Home languages vary greatly by state, however. In Alaska, Montana, and North Dakota, for example, most ELLs are Native Americans. In Maine, the most common home language for ELLs is French. Altogether, about 460 different home languages are spoken by ELLs.
Some 46% of all ELLs and 50% of Spanish-speaking ELLs were born in the United States. Most ELLs know at least some spoken English. About 61% of ELLs have some difficulty with English in a classroom setting, 24% have considerable difficulty, and 14% have little or no proficiency in English. The percentage of students who are ELLs tends to decrease from the lower grades to the upper grades—about 16% of kindergarteners are ELLs, com-pared with just over 5% of 12thgraders. This decrease may reflect not only improvements in
students’ English language proficiency as they progress through school, but also the fact that ELLs drop out of high school at rates far higher than native-born students (Planty et al., 2009). In 2003, almost 60% of ELLs received all instruction in the regular curriculum solely in English—in other words, they did not receive any bilingual or native language instruc-tion—while the rest received varying proportions of native language instruction (Kindler, 2002; Zehler et al., 2003).
To conduct this study of ELL achievement, we examined trends in state test scores spanning three consecutive years from 2006 through 2008, the latest year for which test results were
avail-C
e
n
te
r
o
n
E
d
u
ca
tio
n
P
o
lic
y
3
1This series of reports is entitledState Test Score Trends Through 2007-08.Part 1 examined trends since 2002 at the basic,
pro-ficient, and advanced levels of achievement for students as a whole and found that many more states had gains than declines at all three achievement levels (CEP, 2009a). Part 2 concluded that the so-called “plateau” effect—a leveling off of achievement gains after a test has been in place for several years—was neither widespread nor inevitable for the current generation of state tests (CEP, 2009b). Part 3 found that achievement gaps on state tests between different racial/ethnic groups of students and between low-income and more advantaged students have tended to narrow since 2002 (CEP, 2009c). Part 4 noted that students with disabilities have made gains since 2006 in the majority of states with data but cautioned that imprecise data make it diffi-cult to obtain a clear picture of achievement for this group (CEP, 2009d). Part 5 found that both boys and girls had made progress at three achievement levels, but also noted that higher percentages of girls than boys scored proficient in reading (CEP, 2010). These reports can be downloaded from CEP’s Web site at www.cep-dc.org.
2NCLB defines “limited English proficient” students as those who are between the ages of 3 and 21, are enrolled or preparing to
enroll in an elementary or secondary school, were either not born in the United States or have a native language other than English, and have difficulties speaking, reading, writing, or understanding English that impede their ability to perform at profi-cient levels on state tests, successfully achieve in an English-language classroom setting, or participate fully in society. Although there is no standardized procedure for identifying ELLs, the federal government does require all parents registering children in public school to fill out a home language survey. On the basis of this survey, school districts can administer various assessments of a child’s English proficiency and determine eligibility for ELL services.
able at the time we collected our data. Our main unit of analysis is the trend line, which is a record of change from 2006 through 2008 in the performance of the ELL subgroup at a par-ticular achievement level in one subject and grade level in one state. For example, the change during this period in the percentage proficient in reading for 4thgrade ELLs in California
con-stitutes one trend line. States have been omitted from our analyses if they have fewer than three consecutive years of comparable test data, the minimum span needed to establish a reliable direc-tion in achievement. These “breaks” in trend lines exist because some states have made major changes in their testing systems since 2005-06, such as switching tests or changing cut scores for various achievement levels, or because states lacked data for other reasons.
To determine whether ELLs have made progress across the achievement spectrum, we looked at grade 4 trends at the basic-and-above, proficient-and-above, and advanced achievement levels. In particular, we calculated the average annual percentage-point gain or decline for each trend line and counted the number of states showing gains or declines at each achievement level in reading and math. (The average annual gain or decline is simply the increase or decrease in the percentage of students scoring at or above a certain achievement level divided by two, because we are looking at the degree of change between school years 2005-06 and 2007-08.) We limited this analysis by achievement level to one elementary grade because of the massive amount of data involved and because this was the pilot year for a process that CEP hopes to expand to the middle and high school levels in future years.
In addition, we also looked at ELL trends at the proficient level for three grade levels: ele-mentary (grade 4 in all cases), middle school (grade 8 in all but one state), and high school (generally grade 10 or 11). To obtain a rough idea of how the ELL subgroup is performing relative to other students, we analyzed data on the percentages of ELLs and of students who are not ELLs reaching the proficient level in each state in 2008.
We carried out this study with advice from a panel of five nationally known experts in edu-cational testing or education policy.3 More details about study methods can be found in
appendix 1 to part 1 of this series of reports (CEP, 2009a).
Problems in Testing ELLs
Finding:Because of language barriers, test results for English language learners may not accurately reflect what these students know and can do. It is difficult to design appropriate accommodations to compensate for ELLs’ lack of English proficiency. Consequently, questions remain about the reliability of test scores for ELLs and the validity of inferences drawn from test results.
ELLs typically get tested more than other students. Not only must they take the regular state tests administered to all students and used for accountability under NCLB, but they must also take an annual English proficiency assessment under Titles I and III of the Elementary and Secondary Education Act (the federal programs for educating disadvantaged children and supporting language instruction programs for ELLs, respectively). States must report the
H
a
s
P
ro
g
re
s
s
B
e
e
n
M
a
d
e
in
R
a
is
in
g
A
ch
ie
v
e
m
e
n
t
fo
r
E
n
g
li
s
h
L
a
n
g
u
a
g
e
Le
a
rn
e
rs
?
4
3Members of the expert panel include Laura Hamilton, senior behavioral scientist, RAND Corporation; Eric Hanushek, senior
fel-low, Hoover Institution; Frederick Hess, director of education policy studies, American Enterprise Institute; Robert L. Linn, pro-fessor emeritus, University of Colorado; and W. James Popham, propro-fessor emeritus, University of California, Los Angeles.
results of both types of assessments. The results of the English proficiency assessments are used at the local level to decide when students should be classified as ELLs and when they are ready to exit this status.4Title III further requires states to develop standards for English
language proficiency and a set of state targets to spur improvement. The extra testing reflects the fact that ELLs are expected to master regular academic content as defined by state stan-dards at the same time they are mastering the English language. This study reports on achievement of ELLs on the regular state reading/language arts and math tests administered to all students, not the English proficiency assessments intended specifically for ELLs. NCLB’s provisions for English language learners have presented particular challenges in determining adequate yearly progress (AYP) under NCLB. In surveys taken by CEP soon after the enactment of the law, both state and district officials reported that one of NCLB’s most formidable hurdles was getting the ELL subgroup to make AYP (CEP, 2004). Many states and school districts raised an outcry about the NCLB accountability requirements as they pertained to ELLs. As a result of immigration, recent arrivals who had not yet mastered English were continually entering the ELL subgroup, while those who had mastered English eventually left the subgroup. This, of course, made it difficult for that subgroup to show progress on state reading/language arts tests.
In response, ED made policy changes in 2004 that were incorporated in final regulations in 2006. These revised policies allow a one-year delay in testing for certain ELLs. Newly arrived students who have attended school in the U.S. for less than 12 months can be exempted for one year from taking state reading/language arts assessments; however, they still must take the English language proficiency exam. These newly arrived students must also take the reg-ular state math test, with accommodations as needed, although the first year of results from this testing can be omitted from AYP determinations. In addition, the revised ED policies allow students who have exited ELL status because they have demonstrated English profi-ciency to have their results counted in the ELL subgroup for AYP purposes for two addi-tional years. While these policy changes have addressed some of the concerns raised by educators, an issue remains about whether ELL achievement on state tests appears to be too low because students who have learned English are “skimmed” out of the subgroup after two years. If these former ELL students remain in the subgroup for longer periods, however, the test results for the whole subgroup might not accurately reflect the performance of students who are still learning English.
With the approval of ED, states have also taken other actions that have made it easier for ELLs and other subgroups to meet, or not be subject to, the AYP requirements of NCLB. One such action pertains to the minimum number of students that must be included in a subgroup in order for that subgroup’s results to count toward AYP. Many states have set these minimums so high that few schools have ELL subgroups large enough to count. Another action pertains to the use of confidence intervals, statistical techniques which allow sub-groups that perform somewhat below state AYP targets to still make AYP. The smaller the group of students, the more “wiggle room” a confidence interval allows. Along with NCLB’s “safe harbor” provision, which allows a subgroup to make AYP if its percentage of students scoring below proficient decreases by 10% from the previous year, these actions took some pressure off states in making AYP for ELLs (CEP, 2007).
C
e
n
te
r
o
n
E
d
u
ca
tio
n
P
o
lic
y
5
4Criteria for exiting ELL status vary among states but are based for the most part on assessments of English language proficiency
and academic achievement (as determined by performance on regular state math and reading tests, classroom work, and input from parents and teachers). See Ragan & Lesaux, 2006.
Questions have also arisen about the validity and fairness of interpretations of ELLs’ test results. Some researchers and practitioners have noted that reading and math test results for ELLs are not valid indicators of what these students know and can do because the language of the test creates a barrier to demonstrating their actual skills. To address the difficulties of testing ELLs in a language they have not fully mastered, NCLB lets states offer a wide variety of test accom-modations for students with limited English ability. The most commonly used accommoda-tions for ELLs include the use of a bilingual dictionary, reading aloud of some test items in English, extra time, individual or small group administration of a test, and provision of test instructions in the test-taker’s native language (GAO, 2006; Willner et al., 2008).
It is quite difficult, however, to adjust for the “downward language effect” because even with accommodations and even for tests of math and science, ELLs are still being assessed to a varying extent on both their English ability and the content at hand (Abedi & Dietel, 2004). Until fairly recently, little was known about which types of accommodations were effective for which students. In a review of recent research, Willner and colleagues (2008) indicated that in the 1990s, states tended to simply provide the same types of accommodations to ELLs as they did to students with disabilities, without appropriate understanding of the unique needs of ELLs. Over the past decade, states’ use of accommodations has become more “ELL-responsive”—in other words, less derived from practices used for students with disabilities, a group for which the research base is far larger—although progress still needs to be made. Research is starting to support the effectiveness of some accommodations specifi-cally for ELLs, in particular the use of dictionaries and glossaries during testing (Kieffer et al., 2009; Willner et al., 2008). Kopriva and colleagues (2007) found that giving ELLs accommodations keyed to their individual needs resulted in higher test scores than a generic package of accommodations or none at all.
States are also allowed to administer tests in reading/language arts in students’ native lan-guages for up to three years, as long as the tests are aligned to state standards (U.S. Department of Education, 2007b). In 2004-05, 16 states offered native-language tests for certain language groups—mostly in Spanish, but also in Hmong, Chinese, Vietnamese, Russian, and other languages in a smaller number of states (GAO, 2006). Foreign language tests are rarely available in all tested topics at all tested grades because of their high costs of development and scoring (GAO, 2006; GAO, 2009). Creating foreign language tests is con-siderably more complicated than merely translating an existing test from English; additional work must be done to ensure the results from translated tests are truly comparable to those from regular tests (Willner et al., 2008). Consequently, states have had difficulty demon-strating to ED-led peer review teams that their native language tests are sufficiently reliable and yield results that can be interpreted in a valid way (GAO, 2006; GAO, 2009). Furthermore, GAO (2006) found that even after states went through the trouble of devel-oping native language tests, relatively few students took them. Native language tests are not suitable for all ELLs. Since the majority of ELLs receive instruction primarily in English, it can be confusing for them to take a test of that same academic content in another language. On the other hand, native language tests are appropriate in some cases, such as when ELLs are being taught in their home language or were recently educated in another country (CEP, 2005; GAO, 2006; Willner et al., 2008; Kieffer et al., 2009).
Because of the problems with accommodations and native language tests, concerns persist about the validity of inferences drawn from test results for ELLs. Some progress has occurred in making assessments in subjects other than reading/language arts more understandable for ELLs by reducing the language complexity of assessments; this “universal design” approach to testing strives to “design and develop assessments that allow participation of the widest
H a s P ro g re s s B e e n M a d e in R a is in g A ch ie v e m e n t fo r E n g li s h L a n g u a g e Le a rn e rs ? 6
range of students, and result in valid inferences about their performance” (Thompson & Thurlow, 2002; see also Abedi & Dietel, 2004; Rivera & Stansfield, 2004).
Policies about whether and how to use accommodations not only affect the validity and reli-ability of test results at one point in time but may also affect trends over time. This could occur if changes in policies and their implementation result in more or fewer students being tested with accommodations or lead to higher test scores for ELLs as a group. For example, states may figure out which accommodations work best and then encourage their use, or local educators may become more skillful at providing accommodations.
Changing Numbers of Test-Takers
Finding:The number of ELL test-takers has changed rapidly, which complicates efforts to track achievement trends for this group.
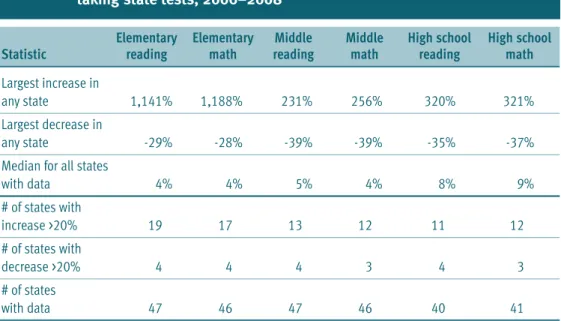
Between 2006 and 2008, some states have reported very large fluctuations, either up or down, in the number of ELL test-takers. These fluctuations can affect achievement trends. For instance, if the current tested population of ELLs includes many more recent immigrants than it did a few years ago, then schools may face greater challenges in raising achievement for this subgroup. In this case, a flat or declining trend line might be more attributable to the different composition of the subgroup than to ineffective instruction. Similarly, a change in state testing policies might result in many more ELLs with very low levels of English profi-ciency taking regular tests; test results for this subgroup as a whole could go down regardless of how well schools were doing their job. Finally, changes that affect which students are clas-sified as ELLs and how long they are so clasclas-sified impact the number of ELL test-takers. Examples of these changes include the introduction of a new English language proficiency exam or a change in the cut scores that define various levels of achievement on such an exam. Table 1shows the changes in the number of ELL test-takers between 2006 and 2008. For each tested subject and grade level, the table shows the largest percentage increase and decrease in this population found in any state, the median change in this population across all states with data (meaning that half the states were below this median figure and the other half above), and the number of states with increases or decreases of more than 20%. Some of the numbers in table 1 are eye-popping: Illinois reported a 1,141% increase in the number of ELLs taking the grade 4 reading test and a 1,188% increase in the number tak-ing the grade 4 math test, and had the highest percentage growth for the other grade level/subject combinations as well. Data provided to us by Illinois indicate that 1,071 ELL 4thgraders took the state reading test in 2006; by 2008, this figure had increased to 13,294.
According to Illinois state education officials, this increase occurred due to a change in test-ing policies; an alternative academic assessment previously given to ELLs in that state was phased out in 2007 after ED objected to its use. As a result, many more ELLs took the reg-ular state test with accommodations.
Nineteen states reported increases of more than 20% in the number of ELLs taking the state grade 4 reading test, although the median increase was just 4% for this subject and grade. This indicates that growth in the ELL population is quite uneven across states, with massive shifts both up and down. There are also vast differences in the numbers of ELLs in each state.
C
e
n
te
r
o
n
E
d
u
ca
tio
n
P
o
lic
y
In Delaware, for example, the number of ELLs taking the state grade 4 reading test rose from just 119 in 2006 to 374 in 2008, but this amounted to a 214% increase. In California, by contrast, the number of ELLs taking the reading test at this grade declined by 21,840 stu-dents from 2006 to 2008, but this amounted to a decrease of just 14% because California has so many ELL test-takers—more than 130,000 students in 2008 in grade 4 reading.
Although the numbers of ELL test-takers have grown rapidly in many states, most of these students are concentrated in just a few states—California, Texas, Florida, and New York, the “gateway states” for new immigrants. At grade 4, about 59% of ELL test-takers nationwide attend school in these four states. While the numbers of ELL test-takers in California and Florida have stabilized to some extent, Texas and New York have continued to see rapid growth. The tested population of ELLs has also grown rapidly in states that are not tradi-tional gateway states, such as Tennessee, Iowa, and the Carolinas. At the opposite end of the spectrum, eight states (Delaware, Maine, Mississippi, New Hampshire, North Dakota, Vermont, West Virginia, and Wyoming) tested fewer than 500 ELLs at grade 4.
The enormous fluctuations in the test-taking population suggest that in some states, the characteristics of the ELL subgroup may have been very different in 2008 than in 2006. For instance, some states may have experienced a large influx of immigrants. Or, as in Illinois, the state may have started testing a different pool of students. In short, rapid changes in the composition of this subgroup make it difficult to reach conclusions about whether ELLs have actually improved their achievement. Moreover, the trends in this report cover just three years, the minimum span used to determine trends for our achievement studies and a rather short span on which to base conclusions. As a result, the trends discussed in this report provide more of a rough idea of ELL achievement than a precise picture.
H
a
s
P
ro
g
re
s
s
B
e
e
n
M
a
d
e
in
R
a
is
in
g
A
ch
ie
v
e
m
e
n
t
fo
r
E
n
g
li
s
h
L
a
n
g
u
a
g
e
Le
a
rn
e
rs
?
8
Table 1. Percentage change in the number of English language learners taking state tests, 2006–2008
Elementary Elementary Middle Middle High school High school
Statistic reading math reading math reading math
Largest increase in
any state 1,141% 1,188% 231% 256% 320% 321% Largest decrease in
any state -29% -28% -39% -39% -35% -37% Median for all states
with data 4% 4% 5% 4% 8% 9%
# of states with
increase >20% 19 17 13 12 11 12
# of states with
decrease >20% 4 4 4 3 4 3
# of states
with data 47 46 47 46 40 41
Table reads: Between 2006 and 2008, the number of English language learners taking tests in elementary reading increased by as much as 1,141% in one state (the largest increase) and decreased by as much as 29% in another state (the largest decrease); the median change in this population across the 47 states with data was a 4% increase. Nineteen states reported increases of more than 20% and four states reported decreases of more than 20% in the tested population of ELLs in elementary reading.
Grade 4 Trends for ELLs at Three Achievement Levels
Under NCLB, states must report student achievement at a minimum of three achievement levels—basic, proficient, and advanced. (Students who fall below their state’s benchmark for basic achievement are considered “below basic,” a de facto fourth category.) NCLB gave states the latitude to define these levels in terms of their own tests, cut scores, and standards for academic content; as a result, states’ definitions vary considerably.5
Although the percentage of students scoring at or above the proficient level is the indicator used to determine AYP under NCLB, the percentages scoring at the basic and advanced lev-els can also reveal valuable information about student achievement. For example, if the per-centage of ELLs reaching or exceeding the basic level in math has increased over time, this indicates that more students in this group have improved enough to move from the below-basic into the below-basic category—progress that would not show up if one looked only at the percentage proficient. Likewise, if more ELLs over time have moved from the proficient to the advanced level, this also would not be picked up by the percentage proficient alone. To better understand how ELLs are performing across the achievement spectrum, we tallied the number of states with gains and declines between 2006 and 2008 in the percentages of grade 4 ELLs scoring at three achievement levels: basic-and-above, proficient-and-above, and advanced. Under this approach, the percentage proficient-and-above also includes the percentage of students reaching the advanced level, and the percentage basic-and-above also includes the percentages reaching the proficient and advanced levels. (Since there is no achievement level above advanced, the percentage advanced is a discrete category.) Using these cumulative achievement categories, rather than the discrete categories of basic alone or proficient alone, is consistent with how AYP is determined under NCLB and is a simpler way to interpret trends that can become quite complex.
Finding:In grade 4, increasing percentages of English language learners have reached three achievement levels—basic, proficient, and advanced—although gains are less prevalent at the advanced level in reading.
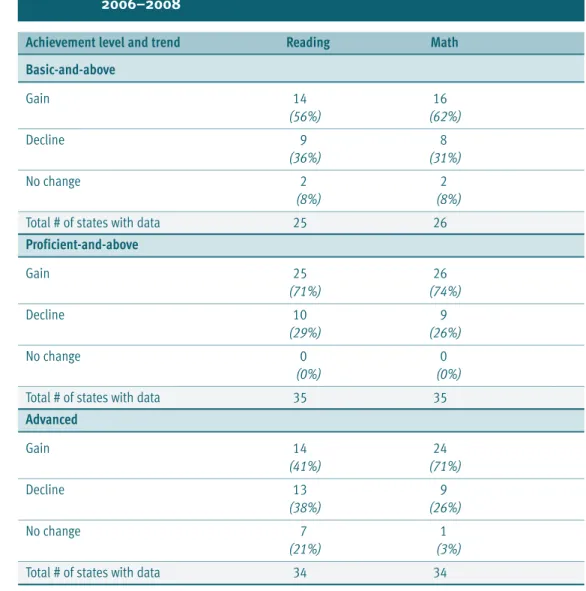
Table 2presents the results of our analysis of trends by achievement level in grade 4 reading and math between 2006 and 2008. In all but one combination of achievement level and subject, states with gains in the percentage of ELLs reaching a particular achievement level clearly outnumbered states with declines. For example, the percentage of ELLs scoring at the basic-and-above level in reading rose in 14 of the 25 states with adequate data, declined in 9 states, and showed no change in 2 states. Across the three achievement levels, the number of states with gains was highest at the proficient level; of the 35 states with sufficient data, 25 demonstrated increases in the percentage proficient for ELLs, while 10 had declines. The exception occurred at the advanced level in reading: 14 states showed gains at this level, 13 had declines, and 7 showed no net change.
Gains were more prevalent in math than in reading at all achievement levels. At the advanced level in particular, the share of states with gains in math far exceeded the share with gains in reading.
C
e
n
te
r
o
n
E
d
u
ca
tio
n
P
o
lic
y
9
5In addition, some states use different names for the three achievement levels, and some have established more than three levels.
More information about the process and challenges of analyzing performance by achievement level, as well as a detailed
dis-cussion of trends at three levels for students as a whole, can be found in part 1 of this series of CEP reports,Is the Emphasis on
Overall, the ratios of gains to declines for ELLs at the three achievement levels were roughly similar to those we found for other subgroups of students, as described in detail in part 3 of this series of reports (CEP 2009c).
Finding:English language learners have made progress in reaching state proficiency benchmarks in reading and math at all three grade levels analyzed—elementary, middle, and high school—although gains are less prevalent in high school than at the other grades.
The percentage proficient is the primary measure of AYP under NCLB and, as such, receives the most attention. We analyzed changes from 2006 through 2008 in the percentages of
H
a
s
P
ro
g
re
s
s
B
e
e
n
M
a
d
e
in
R
a
is
in
g
A
ch
ie
v
e
m
e
n
t
fo
r
E
n
g
li
s
h
L
a
n
g
u
a
g
e
Le
a
rn
e
rs
?
10
Table 2. Number (and percentage) of states showing various trends for English language learners at three achievement levels on state grade 4 tests, 2006–2008
Achievement level and trend Reading Math
Basic-and-above
Gain 14 16
(56%) (62%)
Decline 9 8
(36%) (31%)
No change 2 2
(8%) (8%)
Total # of states with data 25 26
Proficient-and-above
Gain 25 26
(71%) (74%)
Decline 10 9
(29%) (26%)
No change 0 0
(0%) (0%)
Total # of states with data 35 35
Advanced
Gain 14 24
(41%) (71%)
Decline 13 9
(38%) (26%)
No change 7 1
(21%) (3%)
Total # of states with data 34 34
Table reads: Of the 25 states with sufficient data to analyze grade 4 reading trends for ELLs at the basic-and-above level, 14 states (56%) showed gains in the percentage of ELLs scoring at or above the basic level, 9 states (36%) had declines in this percentage, and 2 states (8%) showed no net change.
ELLs scoring at the proficient level at three grade spans—elementary (grade 4 in all cases), middle (grade 8 in all but one case), and high school (usually grade 10 or 11).
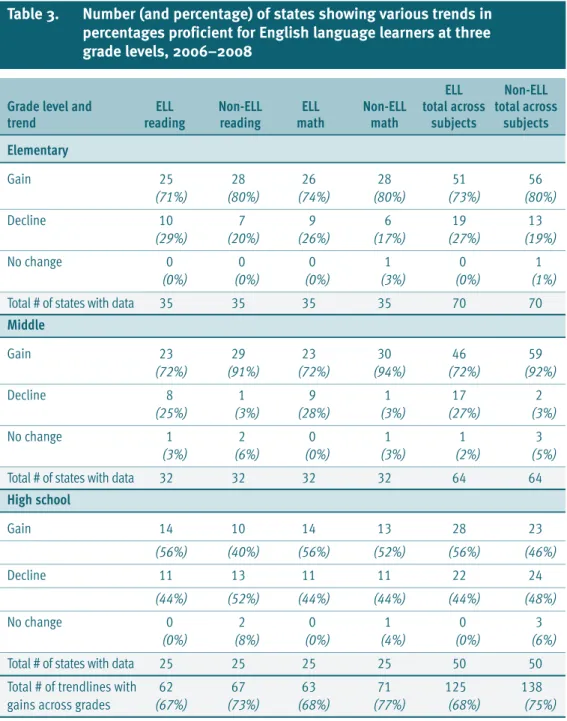
Table 3shows the number of states with gains and declines in the ELL percentage proficient by subject and grade level. At each grade level and in both subjects, states with gains out-numbered those with declines. At the elementary and middle school levels in both reading and math, more than 70% of the states with sufficient data made gains in the percentage of ELLs scoring proficient. At the high school level, a slimmer majority (56%) of the states with data showed percentage proficient gains for ELLs in reading and/or math.
C
e
n
te
r
o
n
E
d
u
ca
tio
n
P
o
lic
y
11 Table 3. Number (and percentage) of states showing various trends in
percentages proficient for English language learners at three grade levels, 2006–2008
ELL Non-ELL
Grade level and ELL Non-ELL ELL Non-ELL total across total across
trend reading reading math math subjects subjects
Elementary
Gain 25 28 26 28 51 56
(71%) (80%) (74%) (80%) (73%) (80%)
Decline 10 7 9 6 19 13
(29%) (20%) (26%) (17%) (27%) (19%)
No change 0 0 0 1 0 1
(0%) (0%) (0%) (3%) (0%) (1%)
Total # of states with data 35 35 35 35 70 70
Middle
Gain 23 29 23 30 46 59
(72%) (91%) (72%) (94%) (72%) (92%)
Decline 8 1 9 1 17 2
(25%) (3%) (28%) (3%) (27%) (3%)
No change 1 2 0 1 1 3
(3%) (6%) (0%) (3%) (2%) (5%)
Total # of states with data 32 32 32 32 64 64
High school
Gain 14 10 14 13 28 23
(56%) (40%) (56%) (52%) (56%) (46%)
Decline 11 13 11 11 22 24
(44%) (52%) (44%) (44%) (44%) (48%)
No change 0 2 0 1 0 3
(0%) (8%) (0%) (4%) (0%) (6%)
Total # of states with data 25 25 25 25 50 50 Total # of trendlines with 62 67 63 71 125 138 gains across grades (67%) (73%) (68%) (77%) (68%) (75%)
Table reads: Of the 35 states with sufficient data to analyze grade 4 ELL trends between 2006 and 2008, 25 states (71%) showed gains in the percentage of ELLs scoring at or above proficient in reading, and 10 states (29%) showed declines in this percentage.
To gauge how ELLs are doing relative to other students, table 3 also includes results for stu-dents who are not English language learners—the non-ELL comparison group—for the same time frame, using only the pool of states with sufficient ELL data. At grade 4, slightly fewer states showed gains for ELLs than for non-ELLs. At grade 8, far fewer states had gains for ELLs than for non-ELLs. At high school, however, the trend was reversed: slightly more states showed progress for ELLs than for non-ELLs. Across all three grade spans, the per-centage of trend lines with gains was smaller for ELLs (68%) than for non-ELLs (75%).
Finding:Trends for English language learners are mostly positive in the states with the largest numbers of ELL test-takers.
Because ELLs are so unevenly distributed throughout the 50 states, we checked the 10 states6
with the largest tested populations of ELLs at grade 4 to see whether trends in these states matched the national trends we found for all states. These 10 states account for three-fourths of the grade 4 ELL test-takers nationwide. Of the 60 possible trend lines for ELLs in these 10 states (10 states times three grade levels times two subjects), data were available for 52 trend lines. Of these, 39 trend lines (75%) showed increases in the percentage proficient for ELLs, while 13 trend lines (25%) showed decreases—a somewhat higher proportion of gains than for all states analyzed.
California, Texas, Florida, and New York, which together enroll a majority of the tested pop-ulation of ELLs at the elementary level, showed gains for ELLs at the proficient level for every grade/subject combination, and no declines.
Therefore, achievement trends for ELLs are overwhelmingly moving upward in states with the largest tested populations of these students. Some of these states demonstrated a mixed picture of increases in some subjects and grade levels and decreases in others, however. Colorado was the only state with declines for ELLs across the board. Again, trends in some of these states—including Illinois, Colorado, Nevada, New York, North Carolina, and Texas—are complicated by shifts of 30% or more in the number of test-takers.
Differences in Achievement Between ELLs and Other Students
As discussed above, English language learners have made progress in a majority of states. But what proportion of ELLs have reached various levels of performance, and how do their results compare with those for all students or for students who are not ELLs?Finding:English language learners in grade 4 are doing better in math than in reading at all three achievement levels. Both the number of states with gains and the median percentages of students reaching various achievement levels are higher in math than in reading. And differences in test performance between ELLs and students overall tend to be smaller, on average, in math than in reading.
H
a
s
P
ro
g
re
s
s
B
e
e
n
M
a
d
e
in
R
a
is
in
g
A
ch
ie
v
e
m
e
n
t
fo
r
E
n
g
li
s
h
L
a
n
g
u
a
g
e
Le
a
rn
e
rs
?
12
6In order of the number of ELL test-takers at the elementary school level, these states are California, Texas, Florida, New York,
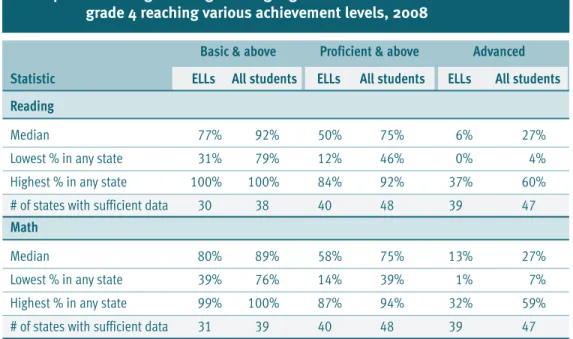
Table 4gives a snapshot across states of the percentages of 4thgrade ELLs performing at three
achievement levels in 2008, the most recent year of test data collected for this report. The table also includes comparable percentages for students overall—the “all students” group in NCLB parlance. For this analysis, we used all students rather than ELLs because data for non-ELLs are typically available only for the proficient level but not for other achievement levels. Comparisons between ELLs and non-ELLs at the proficient level appear later in this section. As table 4 illustrates, the median percentages of ELLs reaching or exceeding the basic level of achievement were 77% in reading and 80% in math; the medians at the proficient level were 50% in reading and 58% in math.7At the proficient and advanced levels, results for
ELLs are markedly better in math than in reading, and the differences between ELLs and all students are smaller in math than in reading. This is not surprising, given that ELLs are still learning the English language and may not be ready to handle the language demands of a reading/language arts test, which typically exceed those of a math test. The differences in median percentages at the three achievement levels between ELLs and all students range from 9 to 25 percentage points, depending on the subject and achievement level.
Table 4 also shows the range from lowest to highest across states in the percentage of ELLs attaining each of these three achievement levels. These types of disparities are often a product of different state policies for ELLs and state testing systems that vary greatly in content, rigor, and allowable accommodations. Demographic differences are also a factor. This range should not be viewed, by itself, as an indicator that ELLs are learning much more in some states than in others. For example, in Arizona no 4thgrade ELL scored at the advanced level, while in
Virginia 37% did so. This may be partly attributable to different testing policies in the two
C
e
n
te
r
o
n
E
d
u
ca
tio
n
P
o
lic
y
13
Table 4. Percentages of English language learners and all tested students in grade 4 reaching various achievement levels, 2008
Basic & above Proficient & above Advanced Statistic ELLs All students ELLs All students ELLs All students Reading
Median 77% 92% 50% 75% 6% 27%
Lowest % in any state 31% 79% 12% 46% 0% 4% Highest % in any state 100% 100% 84% 92% 37% 60% # of states with sufficient data 30 38 40 48 39 47
Math
Median 80% 89% 58% 75% 13% 27%
Lowest % in any state 39% 76% 14% 39% 1% 7% Highest % in any state 99% 100% 87% 94% 32% 59% # of states with sufficient data 31 39 40 48 39 47
Table reads: For the 30 states with sufficient data, the median percentage of English language learners achieving at the basic level or above in grade 4 reading was 77%; the comparable median for all students reaching the basic level or above was 92%. The lowest percentage of ELLs scoring at the basic-and-above level in grade 4 reading in any state was 31%; the highest in any state was 100%.
Source: Center on Education Policy based on data collected from state departments of education.
states and the policy change discussed above that allows students to remain in the ELL sub-group for two years after they have exited ELL status. In South Dakota, 100% of ELLs scored at or above the basic level in reading. A closer examination of that state’s profile (available on the Web at www.cep-dc.org) reveals that virtually all South Dakota students—including low-income students and students with disabilities—reached the basic level on state reading tests.
Finding:Very large differences in percentages proficient exist between English language learners and other students.
Of the 35 states with sufficient data in high school reading, for example, 27 states had dif-ferences of more than 30 percentage points between ELLs and other students, and 18 states had differences of more than 40 percentage points.
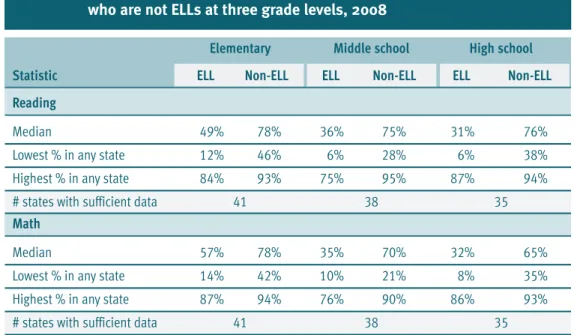
Table 5presents the median percentages of ELLs scoring proficient in reading and math in 2008 at three grade levels, alongside the comparable median percentages for students who are not ELLs. In high school reading, for example, the median percentage proficient for ELLs was 31% in 2008, signifying that half the states were below 31% and half were above. The median for students who were not ELLs was 76%—a difference of 45 percentage points. In middle school math, the median percentage proficient was 35% for ELLs and 70% for non-ELLs, a difference of 35 percentage points. Taken together, these figures show the difficulty many states face in getting the ELL subgroup to 100% proficiency.
H
a
s
P
ro
g
re
s
s
B
e
e
n
M
a
d
e
in
R
a
is
in
g
A
ch
ie
v
e
m
e
n
t
fo
r
E
n
g
li
s
h
L
a
n
g
u
a
g
e
Le
a
rn
e
rs
?
14
Table 5. Percentages proficient for English language learners and students who are not ELLs at three grade levels, 2008
Elementary Middle school High school
Statistic ELL Non-ELL ELL Non-ELL ELL Non-ELL
Reading
Median 49% 78% 36% 75% 31% 76%
Lowest % in any state 12% 46% 6% 28% 6% 38% Highest % in any state 84% 93% 75% 95% 87% 94% # states with sufficient data 41 38 35
Math
Median 57% 78% 35% 70% 32% 65%
Lowest % in any state 14% 42% 10% 21% 8% 35% Highest % in any state 87% 94% 76% 90% 86% 93% # states with sufficient data 41 38 35
Table reads: For the 41 states with sufficient data, the median percentage of English language learners scoring at the proficient level or above in grade 4 reading was 49% in 2008; this compares with a median of 78% for students who were not ELLs. The lowest percentage of English language learners scoring proficient in grade 4 reading in any state was 12%; the highest in any state was 84%.
Note: The figures in this table differ from those in table 4 because the comparison groups are different—students who are not ELLs in the case of this table, and all tested students (including ELLs) in table 4. In addition, table 4 includes only 4thgraders.
Finding:Percentages proficient for ELL students vary widely by state, more so than for students who are not ELLs.
Table 5 also displays the spread between the lowest and highest percentage proficient in any state. It is noteworthy that this spread tends to be far greater for ELLs than for non-ELLs. In high school reading, for example, just 6% of ELLs in one state scored high enough on the state test to be considered proficient in 2008, while 87% of ELLs in another state reached this level. The comparable range for non-ELLs was a low of 38% proficient and a high of 94%. In elementary math, the percentage proficient ranged across states from 14% to 87% for ELLs but from 42% to 94% for non-ELLs.
It seems, then, that ELLs are doing fairly well in some states but are performing at a very low level in others. The differences among states in standards, assessments, testing policies, demo-graphics, and policies for identifying ELLs account for a portion of these disparities, but the very low percentages of ELLs reaching proficiency in some states are still a cause for concern.
Conclusion
As this study has shown, the percentages of English language learners meeting achievement benchmarks increased between 2006 and 2008, according to the state tests used for NCLB accountability. Still, in many states the percentages of ELLs reaching the proficient level in reading and math remain quite low. In the near future, schools and districts could conceiv-ably continue to make AYP for this subgroup through a combination of NCLB’s safe har-bor provision and their state’s use of confidence intervals. But sticking with the current methods of determining AYP skirts the issue of whether it is wise to have an unattainable goal of 100% proficient, particularly for this subgroup.
Using growth models to determine AYP (as ED is already allowing many states to do) would shift the focus away from requiring districts and schools to reach possibly unattainable fixed goals and toward requiring them to meet targets for student growth. Tracking the growth of individual students could also provide information about the extent to which schools move students out of the ELL classification. In addition, this would clear up some of the poten-tially misleading information about ELL performance that results from counting ELLs who have exited that status in the subgroup for two years. However, trying to measure individ-ual growth for the ELL subgroup is complicated by the fact that students are constantly exit-ing the subgroup (unlike other subgroups tracked under NCLB).
Initially, there was great concern that schools would not make AYP solely because of the ELL subgroup, but that has not turned out to be the case. An ED study on NCLB implementa-tion found that only 4% of the schools that did not make AYP were in that status solely because of the ELL subgroup; by contrast, 33% of schools that did not make AYP missed targets for “all students” (Stullich et al., 2007). As long as NCLB accountability require-ments are in effect, ED should continue to monitor carefully the percentage of schools not making AYP solely because of the ELL subgroup.
Earlier this year, ED required states that sought education funding under the American Recovery and Reinvestment Act (ARRA) to submit a series of assurances in four areas of edu-cation reform. CEP recently surveyed state officials to find out how states planned to meet these assurances (CEP, 2009e). We found that 34 states plan to assess the effectiveness of
C
e
n
te
r
o
n
E
d
u
ca
tio
n
P
o
lic
y
testing accommodations for ELLs and students with disabilities, which will be a helpful step. States are also planning as part of their ARRA reforms to take other actions to improve the quality of their academic standards and the rigor of their assessments. Strategies to maximize participation of ELLs in appropriate ways should be part of this process.
The upcoming reauthorization of the Elementary and Secondary Education Act offers an opportunity to consider new ways of testing and tracking the progress of English language learners that are realistic, take into account their unique circumstances, hold educators accountable for these students’ learning, and provide the public with a clear measure of achievement. The federal government could help states to develop reliable and fair assess-ments for ELLs of both content knowledge and language proficiency that can be used to make valid inferences about their learning and that offer students a variety of ways, includ-ing appropriate accommodations, to demonstrate what they have learned. The federal gov-ernment could also fund research and development on better ways to assess these students and should encourage state collaboration and sharing of ideas about best practices.
The trends highlighted in this report also indicate the need to improve instruction aligned to standards for English language learners. As part of a reauthorized ESEA, the federal gov-ernment should expand and improve professional development for teachers on effectively instructing ELLs and should conduct research on innovative, evidence-based models for teaching these students both academic content and language proficiency. For more detailed discussion of CEP’s recommendations for reauthorizing ESEA, see Better Federal Policies Leading to Better Schools, available on CEP’s Web site (www.cep-dc.org).
H
a
s
P
ro
g
re
s
s
B
e
e
n
M
a
d
e
in
R
a
is
in
g
A
ch
ie
v
e
m
e
n
t
fo
r
E
n
g
li
s
h
L
a
n
g
u
a
g
e
Le
a
rn
e
rs
?
References
Abedi, J. & Dietel, R. (2004).Challenges in the No Child Left Behind Act for English language learners. National Center for Research on Evaluation, Standards and Student Testing. Retrieved on November 11, 2009, from www.cse.ucla.edu/products/policy/cresst_policy7.pdf
Center on Education Policy. (2004).From the capital to the classroom: Year 2 of No Child Left Behind. Washington, DC: Author.
Center on Education Policy. (2005).State high school exit exams: States try harder, but gaps persist. Washington, DC: Author.
Center on Education Policy. (2007).No Child Left Behind at five: A review of changes to state
accountability plans.Washington, DC: Author.
Center on Education Policy. (2009a).State test score trends through 2007-08, part 1: Is the emphasis on
proficiency shortchanging higher- and lower-achieving students?Washington, DC: Author.
Center on Education Policy. (2009b).State test score trends through 2007-08, part 2: Is there a plateau
effect in test scores?Washington, DC: Author.
Center on Education Policy. (2009c).State test score trends through 2007-08, part 3: Are achievement
gaps closing and is achievement rising for all?Washington, DC: Author.
Center on Education Policy. (2009d).Has progress been made in raising achievement for students with
disabilities?Washington, DC: Author.
Center on Education Policy. (2009e).An early look at the economic stimulus package and the public
schools: Perspectives from state leaders.Washington, DC: Author.
Center on Education Policy. (2010).State test score trends through 2007-08, part 5: Are there differences
in achievement between girls and boys?Washington, DC: Author.
Government Accountability Office. (2006).No Child Left Behind Act: Education assistance could help
states better measure progress of students with limited English proficiency.Retrieved on November 1,
2009, from www.gao.gov/new.items/d07646t.pdf
Government Accountability Office. (2009).No Child Left Behind Act: Enhancements in the Department of
Education’s review process could improve state academic assessments.Retrieved on December 2,
2009, from www.gao.gov/new.items/d09911.pdf
Kieffer, M.J., Lasaux, N.K., Rivera, M., & Francis, D.J. (2009). Accommodations for English language learners taking large-scale assessments: A meta-analysis on effectiveness and validity.Review of
Education Research, (79)3, 1168-1201.
Kindler, A. (2002).Survey of the states’ limited English proficient students and available educational
programs and services.Washington, DC: U.S. Department of Education, Office of English Language
Acquisition.
Kopriva, R.J., Emick, J.E., Hipolito-Delgado, C.P., & Cameron, C.A. (2007). Do proper accommodations make a difference? Examining the impact of improved decision-making on scores for English language learners.Educational Measurement: Issues and Practice, (26)3, 11-20.
Mather, M. (2009).Children in immigrant families chart new path.Population Reference Bureau. Retrieved on December 5, 2009, from www.aecf.org/KnowledgeCenter/Publications.aspx?pubguid= {11F178AD-66BF-474E-84B2-2B7E93A8877F}
Planty, M., Hussar, W., Snyder, T., Kena, G., KewalRamani, A., Kemp, J., Bianco, K., & Dinkes, R. (2009).
The condition of education 2009(NCES 2009-081). Washington, DC: National Center for Education
Statistics, U.S. Department of Education.
C
e
n
te
r
o
n
E
d
u
ca
tio
n
P
o
lic
y
Ragan, A., & Lesaux, N.K. (2006). Federal, state, and district level English language learner program entry and exit requirements: Effects on the education of language minority learners.Education Policy
Analysis Archives, 14(20). Retrieved on January 25, 2010, from www.eric.ed.gov/ERICDocs/data/
ericdocs2sql/content_storage_01/0000019b/80/3e/99/fd.pdf
Rivera, C. & Stansfield, C. (2004). The effect of linguistic simplification of science test items on score comparability.Educational Assessment, 9(3&4), 79-105.
Stullich, S., Eisner, E., & McRary, J. (2007).National assessment of title I: Final report, vol. I,
implementation.Washington, DC: U.S. Department of Education, Policy and Program Studies Service.
Thompson, S., & Thurlow, M. (2002).Universally designed assessments: Better tests for everyone. National Center on Educational Outcomes. Retrieved on January 15, 2009, from
www.cehd.umn.edu/nceo/OnlinePubs/Policy14.htm
U.S. Department of Education. (2007a).WWC topic report: English language learners.What Works Clearinghouse. Retrieved on January 4, 2010, from http://ies.ed.gov/ncee/wwc/pdf/ELL_TR_07_30_07.pdf U.S. Department of Education. (2007b).Assessment and accountability for recently arrived and former
limited English proficient (LEP) students: Non-regulatory guidance.Retrieved on December 1, 2009,
from www.ed.gov/about/inits/ed/lep-partnership/index.html
Willner, L.S., Rivera, C., & Acost, B.D. (2008, October).Descriptive study of state language assessment
policies for accommodating English language learners.George Washington University, Center for
Equity and Excellence in Education. Retrieved on November 18, 2009, from http://ceee.gwu.edu/AA/DescriptiveStudy.pdf.
Zehler, A.M., Fleischman, H.L., Hopstock, P.J., Stephenson, T.G., Pendzik, M.L., & Sapru, S. (2003).
Descriptive study of services to LEP students and LEP students with disabilities.Washington, DC:
U.S. Department of Education, Office of English Language Acquisition.
H
a
s
P
ro
g
re
s
s
B
e
e
n
M
a
d
e
in
R
a
is
in
g
A
ch
ie
v
e
m
e
n
t
fo
r
E
n
g
li
s
h
L
a
n
g
u
a
g
e
Le
a
rn
e
rs
?
Credits and Acknowledgments
This report was written by Naomi Chudowsky and Victor Chudowsky, CEP consultants, who also conducted research for this study. Nancy Kober, CEP consultant, edited the report and assisted with the writing. Sunny Becker, Hilary Campbell, Monica Gribben, Wade Buckland, and Rebecca Dvorak from the Human Resources Research Organization (HumRRO) provided support in data collection and analysis. Diane Stark Rentner, CEP’s director of national programs, oversaw the study project for CEP, communicated with the expert panel, and provided advice and assistance for all aspects of the study. Jack Jennings, CEP’s president and CEO, provided advice and assistance.
We would like to thank our panel of expert advisors-Laura Hamilton, Eric Hanushek, Frederick Hess, Robert Linn, and W. James Popham-for their invaluable advice. We would also like to thank Robert T. Linquanti, Project Director and Senior Research Associate, WestEd, who reviewed a draft of this report. Additionally, we are grateful to the chief state school officers and state assessment personnel for their cooperation in providing information on state testing programs and student achievement data.
Based in Washington, D.C., and founded in January 1995 by Jack Jennings, the Center on Education Policy is a national independent advocate for public education and for more effective public schools. The Center works to help Americans better understand the role of public education in a democracy and the need to improve the academic quality of public schools. We do not represent any special interests. Instead, we help citizens make sense of the conflicting opinions and perceptions about public education and create the conditions that will lead to better public schools.
The Center on Education Policy receives nearly all of its funding from charitable founda-tions. We are grateful to the William and Flora Hewlett Foundation and the Smith Richardson Foundation for their support of the student achievement study. The George Gund Foundation and the Phi Delta Kappa International Foundation also provide the Center with general support funding that assisted us in this endeavor. The statements made and views expressed are solely the responsibility of the Center.
w w w . c e p - d c . o r g
Center on Education Policy1001 Connecticut Avenue, NW, Suite 522 Washington, D.C. 20036
tel: 202.822.8065 fax: 202.822.6008 e: cep-dc@cep-dc.org w: www.cep-dc.org