Juniper Networks, Junos, Steel-Belted Radius, NetScreen, and ScreenOS are registered trademarks of Juniper Networks, Inc. in the United States and other countries. The Juniper Networks Logo, the Junos logo, and JunosE are trademarks of Juniper Networks, Inc. All other trademarks, service marks, registered trademarks, or registered service marks are the property of their respective owners.
Juniper Networks assumes no responsibility for any inaccuracies in this document. Juniper Networks reserves the right to change, modify, transfer, or otherwise revise this publication without notice.
Real-Time Performance Monitoring Services Copyright © 2014, Juniper Networks, Inc. All rights reserved.
The information in this document is current as of the date on the title page. YEAR 2000 NOTICE
Juniper Networks hardware and software products are Year 2000 compliant. Junos OS has no known time-related limitations through the year 2038. However, the NTP application is known to have some difficulty in the year 2036.
END USER LICENSE AGREEMENT
The Juniper Networks product that is the subject of this technical documentation consists of (or is intended for use with) Juniper Networks software. Use of such software is subject to the terms and conditions of the End User License Agreement (“EULA”) posted at
http://www.juniper.net/support/eula.html. By downloading, installing or using such software, you agree to the terms and conditions of that EULA.
About the Documentation . . . xi
Documentation and Release Notes . . . xi
Using the Examples in This Manual . . . xi
Merging a Full Example . . . xii
Merging a Snippet . . . xii
Documentation Conventions . . . xiii
Documentation Feedback . . . xv
Requesting Technical Support . . . xv
Self-Help Online Tools and Resources . . . xv
Opening a Case with JTAC . . . xvi
Part 1
Overview
Chapter 1 RPM Services . . . 3Real-Time Performance Monitoring Services Overview . . . 3
RFC 2544-Based Benchmarking Tests Overview . . . 4
Part 2
Configuration
Chapter 2 Configuration Tasks . . . 9[edit services rpm] Hierarchy Level . . . 9
Configuring BGP Neighbor Discovery Through RPM . . . 11
Configuring RPM Probes . . . 13
Configuring RPM Receiver Servers . . . 18
Limiting the Number of Concurrent RPM Probes . . . 18
Configuring RPM Timestamping . . . 19
Configuring TWAMP . . . 22
Configuring TWAMP Interfaces . . . 23
Configuring TWAMP Servers . . . 23
Enabling RPM for the Junos OS extension-provider package . . . 24
Configuring an RFC 2544-Based Benchmarking Test . . . 25
Configuring a Test Name for an RFC 2544-Based Benchmarking Test for a IPv4 Network . . . 26
Configuring a Test Name for an RFC 2544-Based Benchmarking Test for an Ethernet Pseudowire: . . . 27
Tracing RPM Operations . . . 28
Configuring the RPM Log File Name . . . 29
Configuring the Number and Size of RPM Log Files . . . 29
Configuring Access to the Log File . . . 29
Configuring a Regular Expression for Lines to Be Logged . . . 30
Chapter 3 Examples . . . 31
Examples: Configuring BGP Neighbor Discovery Through RPM . . . 31
Examples: Configuring Real-Time Performance Monitoring . . . 32
Example: Configuring an RFC 2544-Based Benchmarking Test for Layer 3 IPv4 Services . . . 36
Example: Configuring an RFC 2544-Based Benchmarking Test for UNI Direction of Ethernet Pseudowires . . . 44
Example: Configuring an RFC 2544-Based Benchmarking Test for NNI Direction of Ethernet Pseudowires . . . 51
Chapter 4 Configuration Statements . . . 59
authentication-mode . . . 61
bgp . . . 62
client-list . . . 63
data-fill . . . 63
data-size . . . 64
destination-ipv4-address (RFC 2544 Benchmarking) . . . 65
destination-interface . . . 66
destination-port . . . 67
destination-udp-port (RFC 2544 Benchmarking) . . . 68
direction (RFC 2544 Benchmarking) . . . 68
dscp-code-point . . . 69
family (RFC 2544 Benchmarking) . . . 70
hardware-timestamp . . . 71
history-size . . . 71
inactivity-timeout (Services RPM) . . . 72
logical-system . . . 72
maximum-connections . . . 73
max-connection-duration . . . 73
maximum-connections-per-client . . . 74
maximum-sessions . . . 74
maximum-sessions-per-connection . . . 75
mode (RFC 2544 Benchmarking) . . . 75
moving-average-size . . . 76
one-way-hardware-timestamp . . . 76
port (RPM) . . . 77
port (TWAMP) . . . 77
probe . . . 78
probe-count . . . 79
probe-interval . . . 79
probe-limit . . . 80
probe-server . . . 81
probe-type . . . 82
routing-instance . . . 83
routing-instances . . . 83
rfc2544-benchmarking . . . 84
rpm . . . 85
rpm . . . 85
server-inactivity-timeout . . . 86
services (RPM) . . . 87
source-address . . . 87
source-ipv4-address (RFC 2544 Benchmarking) . . . 88
source-udp-port (RFC 2544 Benchmarking) . . . 88
target (Services RPM) . . . 89
tcp . . . 89
test . . . 90
tests (RFC 2544 Benchmarking) . . . 91
test-interface (RFC 2544 Benchmarking) . . . 92
test-interval . . . 93
test-name (RFC 2544 Benchmarking) . . . 94
thresholds . . . 95
traceoptions (RPM) . . . 96
traps . . . 98
twamp . . . 99
twamp-server . . . 100
udp . . . 100
Part 3
Administration
Chapter 5 RPM Operational Mode Commands . . . 103clear services rpm twamp server connection . . . 104
show services rpm active-servers . . . 105
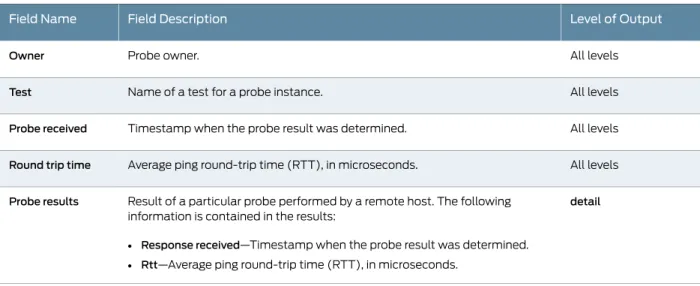
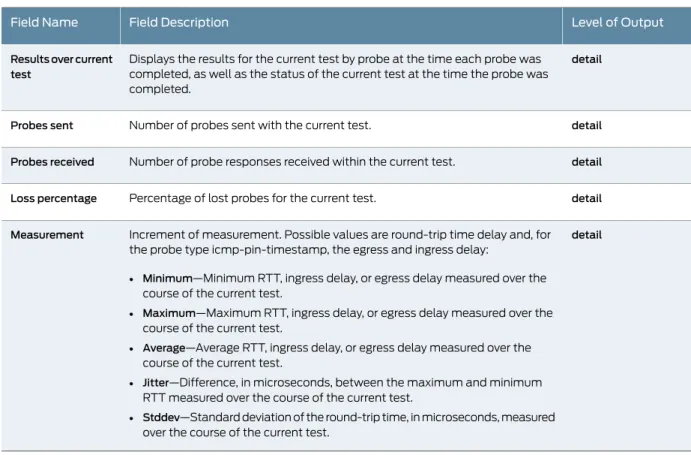
show services rpm history-results . . . 106
show services rpm probe-results . . . 109
show services rpm twamp server connection . . . 115
show services rpm twamp server session . . . 117
show services rpm rfc2544-benchmarking . . . 119
show services rpm rfc2544-benchmarking test-id . . . 124
test services rpm rfc2544-benchmarking test . . . 141
Part 4
Index
Index . . . 145Part 2
Configuration
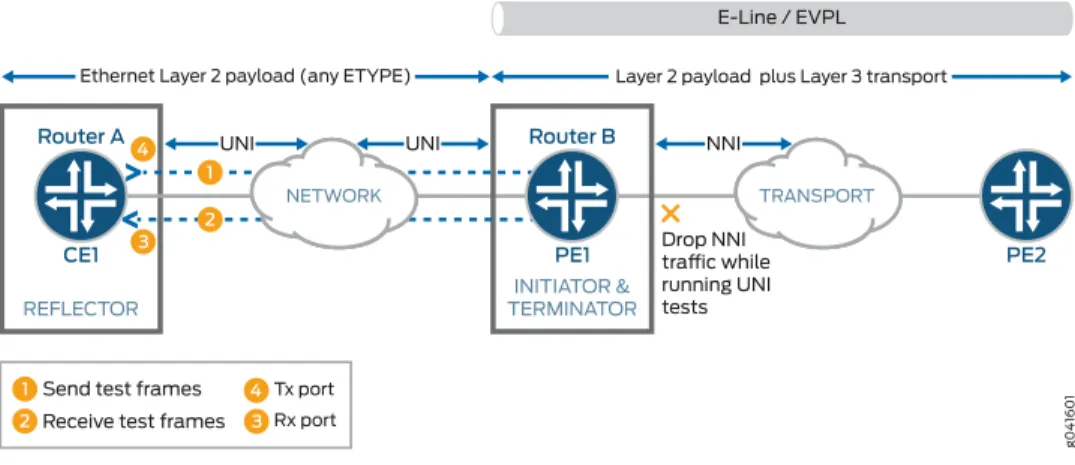
Chapter 3 Examples . . . 31 Figure 1: RFC 2544-Based Benchmarking Test for a Layer 3 IPv4 Service . . . 37 Figure 2: RFC 2544-Based Benchmarking Test for UNI Direction of an Ethernet
Pseudowire . . . 45 Figure 3: RFC 2544-Based Benchmarking Test for NNI Direction of an Ethernet
About the Documentation . . . xi
Table 1: Notice Icons . . . xiii
Table 2: Text and Syntax Conventions . . . xiii
Part 1
Overview
Chapter 1 RPM Services . . . 3Table 3: Supported Network Topologies for RFC 2544 Benchmarking Tests . . . 5
Part 2
Configuration
Chapter 2 Configuration Tasks . . . 9Table 4: RPM Tracing Flags . . . 30
Part 3
Administration
Chapter 5 RPM Operational Mode Commands . . . 103Table 5: show services rpm active-servers Output Fields . . . 105
Table 6: show services rpm history-results Output Fields . . . 106
Table 7: show services rpm probe-results Output Fields . . . 109
Table 8: show services rpm twamp server connection Output Fields . . . 115
Table 9: show services rpm twamp server session Output Fields . . . 117
Table 10: show services rpm rfc2544-benchmarking Output Fields . . . 120
• Documentation and Release Notes on page xi
• Using the Examples in This Manual on page xi
• Documentation Conventions on page xiii
• Documentation Feedback on page xv
• Requesting Technical Support on page xv
Documentation and Release Notes
To obtain the most current version of all Juniper Networks®technical documentation, see the product documentation page on the Juniper Networks website at
http://www.juniper.net/techpubs/.
If the information in the latest release notes differs from the information in the documentation, follow the product Release Notes.
Juniper Networks Books publishes books by Juniper Networks engineers and subject matter experts. These books go beyond the technical documentation to explore the nuances of network architecture, deployment, and administration. The current list can be viewed athttp://www.juniper.net/books.
Using the Examples in This Manual
If you want to use the examples in this manual, you can use theload mergeor theload merge relativecommand. These commands cause the software to merge the incoming configuration into the current candidate configuration. The example does not become active until you commit the candidate configuration.
If the example configuration contains the top level of the hierarchy (or multiple hierarchies), the example is afull example. In this case, use theload mergecommand. If the example configuration does not start at the top level of the hierarchy, the example is asnippet. In this case, use theload merge relative command. These procedures are described in the following sections.
Merging a Full Example
To merge a full example, follow these steps:
1. From the HTML or PDF version of the manual, copy a configuration example into a text file, save the file with a name, and copy the file to a directory on your routing platform.
For example, copy the following configuration to a file and name the fileex-script.conf. Copy theex-script.conffile to the/var/tmpdirectory on your routing platform.
system { scripts {
commit {
file ex-script.xsl; }
} }
interfaces { fxp0 {
disable; unit 0 {
family inet {
address 10.0.0.1/24; }
} } }
2. Merge the contents of the file into your routing platform configuration by issuing the
load mergeconfiguration mode command:
[edit]
user@host#load merge /var/tmp/ex-script.conf load complete
Merging a Snippet
To merge a snippet, follow these steps:
1. From the HTML or PDF version of the manual, copy a configuration snippet into a text file, save the file with a name, and copy the file to a directory on your routing platform. For example, copy the following snippet to a file and name the file
ex-script-snippet.conf. Copy theex-script-snippet.conffile to the/var/tmpdirectory on your routing platform.
commit {
file ex-script-snippet.xsl; }
2. Move to the hierarchy level that is relevant for this snippet by issuing the following configuration mode command:
[edit]
user@host#edit system scripts [edit system scripts]
3. Merge the contents of the file into your routing platform configuration by issuing the
load merge relativeconfiguration mode command:
[edit system scripts]
user@host#load merge relative /var/tmp/ex-script-snippet.conf load complete
For more information about theloadcommand, see theCLI User Guide.
Documentation Conventions
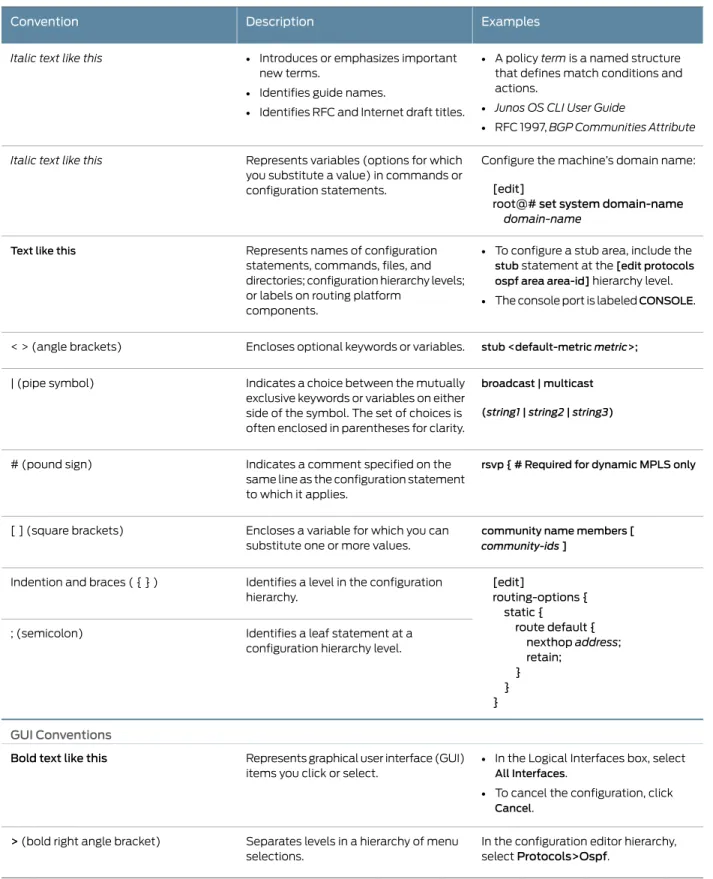
Table 1 on page xiiidefines notice icons used in this guide.
Table 1: Notice Icons
Description Meaning
Icon
Indicates important features or instructions. Informational note
Indicates a situation that might result in loss of data or hardware damage. Caution
Alerts you to the risk of personal injury or death. Warning
Alerts you to the risk of personal injury from a laser. Laser warning
Indicates helpful information. Tip
Alerts you to a recommended use or implementation. Best practice
Table 2 on page xiiidefines the text and syntax conventions used in this guide.
Table 2: Text and Syntax Conventions
Examples Description
Convention
To enter configuration mode, type the
configurecommand:
user@host>configure
Represents text that you type.
Bold text like this
user@host> show chassis alarms No alarms currently active
Represents output that appears on the terminal screen.
Table 2: Text and Syntax Conventions
(continued)
Examples Description
Convention
• A policytermis a named structure that defines match conditions and actions.
• Junos OS CLI User Guide
• RFC 1997,BGP Communities Attribute
• Introduces or emphasizes important new terms.
• Identifies guide names.
• Identifies RFC and Internet draft titles. Italic text like this
Configure the machine’s domain name:
[edit]
root@#set system domain-name
domain-name Represents variables (options for which
you substitute a value) in commands or configuration statements.
Italic text like this
• To configure a stub area, include the
stubstatement at the[edit protocols ospf area area-id]hierarchy level.
• The console port is labeledCONSOLE. Represents names of configuration
statements, commands, files, and directories; configuration hierarchy levels; or labels on routing platform
components.
Text like this
stub <default-metricmetric>;
Encloses optional keywords or variables. < > (angle brackets)
broadcast | multicast (string1|string2|string3)
Indicates a choice between the mutually exclusive keywords or variables on either side of the symbol. The set of choices is often enclosed in parentheses for clarity. | (pipe symbol)
rsvp { # Required for dynamic MPLS only
Indicates a comment specified on the same line as the configuration statement to which it applies.
# (pound sign)
community name members [ community-ids]
Encloses a variable for which you can substitute one or more values. [ ] (square brackets)
[edit]
routing-options { static {
route default { nexthop address; retain;
} } }
Identifies a level in the configuration hierarchy.
Indention and braces ( { } )
Identifies a leaf statement at a configuration hierarchy level. ; (semicolon)
GUI Conventions
• In the Logical Interfaces box, select
All Interfaces.
• To cancel the configuration, click
Cancel. Represents graphical user interface (GUI)
items you click or select.
Bold text like this
In the configuration editor hierarchy, selectProtocols>Ospf.
Separates levels in a hierarchy of menu selections.
Documentation Feedback
We encourage you to provide feedback, comments, and suggestions so that we can improve the documentation. You can send your comments to
techpubs-comments@juniper.net, or fill out the documentation feedback form at
https://www.juniper.net/cgi-bin/docbugreport/. If you are using e-mail, be sure to include the following information with your comments:
• Document or topic name
• URL or page number
• Software release version (if applicable)
Requesting Technical Support
Technical product support is available through the Juniper Networks Technical Assistance Center (JTAC). If you are a customer with an active J-Care or JNASC support contract, or are covered under warranty, and need post-sales technical support, you can access our tools and resources online or open a case with JTAC.
• JTAC policies—For a complete understanding of our JTAC procedures and policies, review theJTAC User Guidelocated at
http://www.juniper.net/us/en/local/pdf/resource-guides/7100059-en.pdf.
• Product warranties—For product warranty information, visit
http://www.juniper.net/support/warranty/.
• JTAC hours of operation—The JTAC centers have resources available 24 hours a day, 7 days a week, 365 days a year.
Self-Help Online Tools and Resources
For quick and easy problem resolution, Juniper Networks has designed an online self-service portal called the Customer Support Center (CSC) that provides you with the following features:
• Find CSC offerings:http://www.juniper.net/customers/support/ • Search for known bugs:http://www2.juniper.net/kb/
• Find product documentation:http://www.juniper.net/techpubs/
• Find solutions and answer questions using our Knowledge Base:http://kb.juniper.net/ • Download the latest versions of software and review release notes:
http://www.juniper.net/customers/csc/software/
• Search technical bulletins for relevant hardware and software notifications:
• Join and participate in the Juniper Networks Community Forum:
http://www.juniper.net/company/communities/
• Open a case online in the CSC Case Management tool:http://www.juniper.net/cm/
To verify service entitlement by product serial number, use our Serial Number Entitlement (SNE) Tool:https://tools.juniper.net/SerialNumberEntitlementSearch/
Opening a Case with JTAC
You can open a case with JTAC on the Web or by telephone.
• Use the Case Management tool in the CSC athttp://www.juniper.net/cm/.
• Call 1-888-314-JTAC (1-888-314-5822 toll-free in the USA, Canada, and Mexico). For international or direct-dial options in countries without toll-free numbers, see
• Real-Time Performance Monitoring Services Overview on page 3
• RFC 2544-Based Benchmarking Tests Overview on page 4
Real-Time Performance Monitoring Services Overview
Real-Time Performance Monitoring (RPM) enables you to configure active probes to track and monitor traffic. Probes collect packets per destination and per application, including PING Internet Control Message Protocol (ICMP) packets, User Datagram Protocol and Transmission Control Protocol (UDP/TCP) packets with user-configured ports, user-configured Differentiated Services code point (DSCP) type-of-service (ToS) packets, and Hypertext Transfer Protocol (HTTP) packets. RPM provides Management Information Base (MIB) support with extensions for RFC 2925,Definitions of Managed Objects for Remote Ping, Traceroute, and Lookup Operations.
You can also configure RPM services to determine automatically whether a path exists between a host router and its configured BGP neighbors. You can view the results of the discovery using an SNMP client. Results are stored inpingResultsTable,
jnxPingResultsTable,jnxPingProbeHistoryTable, andpingProbeHistoryTable.
Probe configuration and probe results are supported by the command-line interface (CLI) and SNMP.
The following probe types are supported with DSCP marking:
• ICMP echo
• ICMP timestamp
• HTTP get (not available for BGP RPM services)
• UDP echo
• TCP connection
• UDP timestamp
With probes, you can monitor the following:
• Minimum round-trip time
• Average round-trip time
• Standard deviation of the round-trip time
• Jitter of the round-trip time—The difference between the minimum and maximum round-trip time
One-way measurements for ICMP timestamp probes include the following:
• Minimum, maximum, standard deviation, and jitter measurements for egress and ingress times
• Number of probes sent
• Number of probe responses received
• Percentage of lost probes
NOTE: Timestamping is not supported on PTX Series Packet Transport Routers.
You can configure the following RPM thresholds:
• Round-trip time
• Ingress/egress delay
• Standard deviation
• Jitter
• Successive lost probes
• Total lost probes (per test)
Support is also implemented for user-configured CoS classifiers and for prioritization of RPM packets over regular data packets received on an input interface.
Related Documentation
Configuring BGP Neighbor Discovery Through RPM on page 11
•
• [edit services rpm] Hierarchy Level on page 9
• Examples: Configuring BGP Neighbor Discovery Through RPM on page 31
RFC 2544-Based Benchmarking Tests Overview
RFC 2544 defines a series of tests that can be used to describe the performance characteristics of a network-interconnecting device, such as a router, and outlines specific formats to report the results of the tests. These tests can be used to benchmark interconnected network devices and devise a guideline or a measurement pattern to analyze the health and efficiency of the network devices. Because of the ability of these tests to measure throughput, bursty frames, frame loss, and latency, this mechanism is also used to diagnose Ethernet-based networks. These tests are the standard
benchmarking tests. The test methodology enables you to define various parameters such as different frame sizes to be examined (64, 128, 256, 512, 1024, 1280 and 1518 bytes), the test time for each test iteration, and the frame format (IP or UDP). In Junos OS Release 13.3, MX104 routers support only the reflector function and the corresponding benchmarking tests. These tests display only the reflected bytes and packets on the routers.
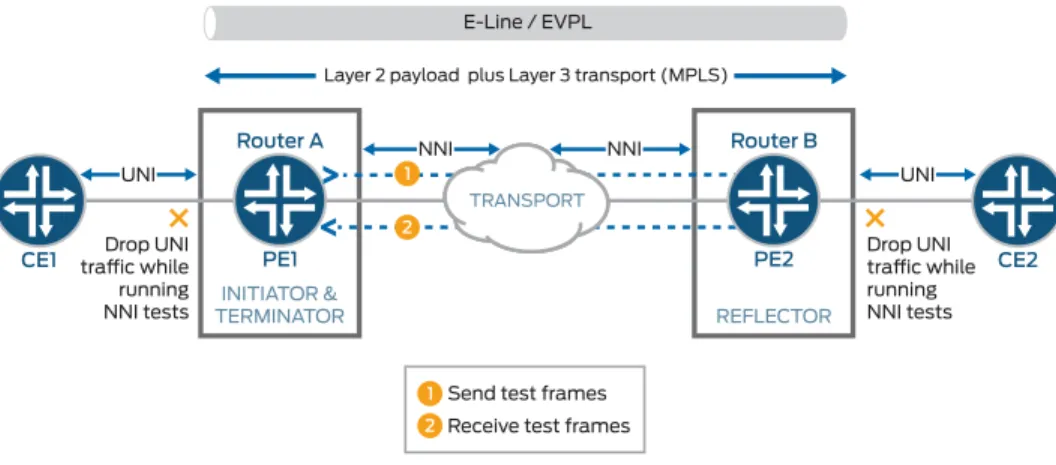
RFC 2544-based benchmarking test is performed by transmitting test packets from a device that functions as the generator or the initiator. The initiator is also called the originator. These packets are sent to a device that functions as the reflector, which receives and returns the packets back to the initiator.
The RFC 2544 methodology assesses different parameters that are defined in service-level agreements (SLAs). By measuring the performance availability, transmission delay, link bursts, and service integrity, a carrier provider can certify that the working parameters of the deployed Ethernet circuit comply with the SLA and other defined policies.
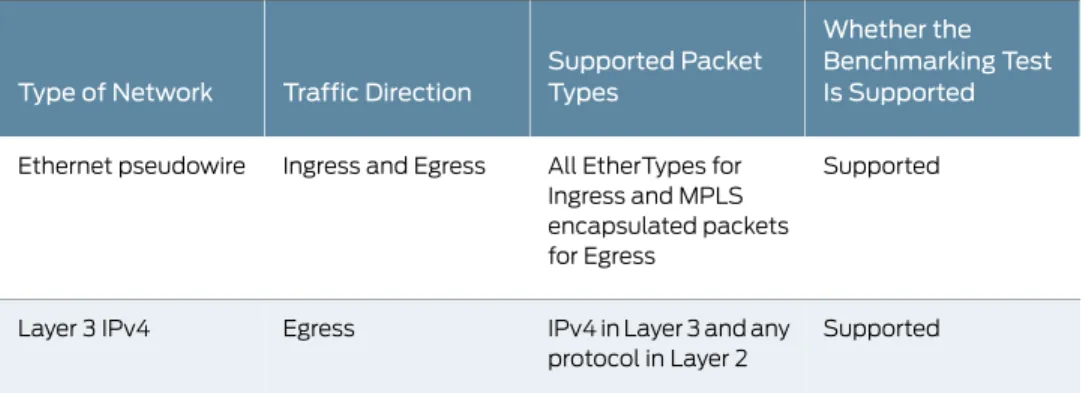
Table 3 on page 5describes the different network topologies in which the benchmarking test is supported:
Table 3: Supported Network Topologies for RFC 2544 Benchmarking
Tests
Whether the Benchmarking Test Is Supported Supported Packet
Types Traffic Direction
Type of Network
Supported All EtherTypes for
Ingress and MPLS encapsulated packets for Egress
Ingress and Egress Ethernet pseudowire
Supported IPv4 in Layer 3 and any
protocol in Layer 2 Egress
Layer 3 IPv4
Related Documentation
• Configuration Tasks on page 9
• Examples on page 31
• [edit services rpm] Hierarchy Level on page 9
• Configuring BGP Neighbor Discovery Through RPM on page 11
• Configuring RPM Probes on page 13
• Configuring RPM Receiver Servers on page 18
• Limiting the Number of Concurrent RPM Probes on page 18
• Configuring RPM Timestamping on page 19
• Configuring TWAMP on page 22
• Enabling RPM for the Junos OS extension-provider package on page 24
• Configuring an RFC 2544-Based Benchmarking Test on page 25
• Tracing RPM Operations on page 28
[edit services rpm] Hierarchy Level
To configure Real-Time Performance Monitoring (RPM) services, include therpm
statement at the[edit services]hierarchy level:
[edit services] rpm {
bgp {
data-filldata;
data-sizesize;
destination-portport;
history-sizesize;
logical-systemlogical-system-name [routing-instances routing-instance-name];
moving-average-sizenumber;
probe-countcount;
probe-intervalseconds;
probe-typetype;
routing-instancesinstance-name;
test-intervalinterval; }
probeowner {
testtest-name {
data-filldata;
data-sizesize;
destination-portport; dscp-code-pointdscp-bits; hardware-timestamp; history-sizesize; moving-average-sizenumber; one-way-hardware-timestamp; probe-countcount; probe-intervalseconds; probe-typetype; routing-instanceinstance-name; source-addressaddress;
target(url url | address address);
test-intervalinterval; thresholdsthresholds; trapstraps; } } probe-server{ tcp{ destination-interfaceinterface-name; portnumber; } udp{ destination-interfaceinterface-name; portnumber; } } probe-limitlimit; traceoptions{
file filename <files number> <match regular-expression > <size maximum-file-size> <world-readable | no-world-readable>;
flag flag; }
twamp { server {
authentication-mode(authenticated | encrypted | none); client-list list-name {
[ address address ]; } inactivity-timeout seconds; maximum-connections-duration hours; maximum-connections count; maximum-connections-per-client count; maximum-sessions count; maximum-sessions-per-connection count; port number; server-inactivity-timeout minutes; } } rfc2544-benchmarking{ tests{
test-name (RFC 2544 Benchmarking)test-name {
test-interfaceinterface-name;
modereflect;
family(inet | ccc);
destination-udp-portport-number;
source-ipv4-addressaddress;
source-udp-portport-number;
direction(egress | ingress); }
} } }
NOTE: RPM does not require an Adaptive Services (AS) or Multiservices PIC or Multiservices Dense Port Concentrator (DPC) unless you are configuring RPM timestamping as described in“Configuring RPM Timestamping” on page 19.
Related Documentation
Configuring BGP Neighbor Discovery Through RPM on page 11
•
• Configuring RPM Probes on page 13
• Configuring RPM Receiver Servers on page 18
• Limiting the Number of Concurrent RPM Probes on page 18
• Configuring RPM Timestamping on page 19
• Configuring TWAMP on page 22
• Enabling RPM for the Junos OS extension-provider package on page 24
• Tracing RPM Operations on page 28
Configuring BGP Neighbor Discovery Through RPM
BGP neighbors can be configured at the following hierarchy levels:
• [edit protocols bgp groupgroup-name]—Default logical system and default routing instance.
• [edit routing-instancesinstance-nameprotocols bgp groupgroup-name]—Default logical system with a specified routing instance.
• [edit logical-systemslogical-system-nameprotocols bgp groupgroup-name]—Configured logical system and default routing instance.
• [edit logical-systemslogical-system-namerouting-instancesinstance-nameprotocols bgp groupgroup-name]—Configured logical system with a specified routing instance. When you configure BGP neighbor discovery through RPM, if you do not specify a logical system, the RPM probe applies to configured BGP neighbors for all logical systems. If you do not specify a routing instance, the RPM probe applies to configured BGP neighbors in all routing instances. You can explicitly configure RPM probes to apply only to the default logical system, the default routing instance, or to a particular logical system or routing instance.
To configure BGP neighbor discovery through RPM, configure the probe properties at the
[edit services rpm bgp]hierarchy:
data-filldata;
data-sizesize;
destination-portport;
history-sizesize;
logical-systemlogical-system-name [routing-instances routing-instance-name];
moving-average-sizenumber;
probe-countcount;
probe-intervalseconds;
probe-typetype;
routing-instancesinstance-name;
test-intervalinterval;
• To specify the contents of the data portion of Internet Control Message Protocol (ICMP) probes, include thedata-fillstatement at the[edit services rpm bgp]hierarchy level. The value can be a hexadecimal value.
• To specify the size of the data portion of ICMP probes, include thedata-sizestatement at the[edit services rpm bgp]hierarchy level. The size can be from0through65400
and the default size is0.
• To specify the User Datagram Protocol (UDP) port or Transmission Control Protocol (TCP) port to which the probe is sent, include thedestination-portstatement at the
[edit services rpm bgp]hierarchy level. Thedestination-portstatement is used only for the UDP and TCP probe types. The value can be7or from49160through65535.
• To specify the number of stored history entries, include thehistory-sizestatement at the[edit services rpm bgp]hierarchy level. Specify a value from0to512. The default is50.
• To specify the logical system used by ICMP probes, include thelogical-system logical-system-namestatement at the[edit services rpm bgp]hierarchy level. If you do not specify a logical system, the RPM probe applies to configured BGP neighbors for all logical systems. To apply the probe to only the default logical system, you must set the value oflogical-system-nametonull.
• To specify a number of samples for making statistical calculations, include the moving-average-size statement at the[edit services rpm bgp]hierarchy level. Specify a value from 0 through 255.
• To specify the number of probes within a test, include theprobe-countstatement at the[edit services rpm bgp]hierarchy level. Specify a value from1through15.
• To specify the time to wait between sending packets, include theprobe-interval
statement at the[edit services rpm bgp]hierarchy level. Specify a value from1through
255seconds.
• To specify the packet and protocol contents of the probe, include theprobe-type
statement at the[edit services rpm bgp]hierarchy level. The following probe types are supported:
• icmp-ping—Sends ICMP echo requests to a target address.
• tcp-ping—Sends TCP packets to a target.
• udp-ping—Sends UDP packets to a target.
• udp-ping-timestamp—Sends UDP timestamp requests to a target address.
NOTE: Some probe types require additional parameters to be configured. For example, when you specify thetcp-pingorudp-pingoption, you must configure the destination port using thedestination-portportstatement. Theudp-ping-timestampoption requires a minimum data size of 12; any smaller data size results in a commit error. The minimum data size for TCP probe packets is 1.
• To specify the routing instance used by ICMP probes, include therouting-instances
statement at the[edit services rpm bgp]hierarchy level. The default routing instance is Internet routing tableinet.0. If you do not specify a routing instance, the RPM probe applies to configured BGP neighbors in all routing instances. To apply the RPM probe to only the default routing instance, you must explicitly set the value ofinstance-name
todefault.
• To specify the time to wait between tests, include thetest-intervalstatement at the
[edit services bgp probe]hierarchy level. Specify a value from0through86400seconds.
Related Documentation
Real-Time Performance Monitoring Services Overview on page 3
•
• [edit services rpm] Hierarchy Level on page 9
• Examples: Configuring BGP Neighbor Discovery Through RPM on page 31
Configuring RPM Probes
The owner name and test name identifiers of an RPM probe together represent a single RPM configuration instance. When you specify the test name, you also can configure the test parameters.
To configure the probe owner, test name, and test parameters, include theprobe
statement at the[edit services rpm]hierarchy level:
probeowner {
testtest-name {
data-filldata;
data-sizesize;
destination-interfaceinterface-name;
destination-portport;
dscp-code-pointdscp-bits;
hardware-timestamp;
history-sizesize;
moving-average-sizenumber;
one-way-hardware-timestamp;
probe-countcount;
probe-typetype;
routing-instanceinstance-name;
source-addressaddress;
target(url url | address address);
test-intervalinterval;
thresholdsthresholds;
trapstraps; }
}
Keep the following points in mind when you configure RPM clients and RPM servers:
• You cannot configure an RPM client that is PIC-based and an RPM server that is based on either the Packet Forwarding Engine or Routing Engine to receive the RPM probes.
• You cannot configure an RPM client that is Packet Forwarding Engine-based and an RPM server that receives the RPM probes to be on the PIC or Routing Engine.
• The RPM client and RPM server must be located on the same type of module. For example, if the RPM client is PIC-based, the RPM server must also be PIC-based, and if the RPM server is Packet Forwarding Engine-based, the RPM client must also be Packet Forwarding Engine-based.
• To specify a probe owner, include theprobestatement at the[edit services rpm]
hierarchy level. The probe owner identifier can be up to 32 characters in length.
• To specify a test name, include theteststatement at the[edit services rpm probe owner]hierarchy level. The test name identifier can be up to 32 characters in length. A test represents the range of probes over which the standard deviation, average, and jitter are calculated.
• To specify the contents of the data portion of Internet Control Message Protocol (ICMP) probes, include thedata-fillstatement at the[edit services rpm probeowner]hierarchy level. The value can be a hexadecimal value. Thedata-fillstatement is not valid with thehttp-getorhttp-metadata-getprobe types.
• To specify the size of the data portion of ICMP probes, include thedata-sizestatement at the[edit services rpm probeowner]hierarchy level. The size can be from0through
65400and the default size is0. Thedata-sizestatement is not valid with thehttp-get
orhttp-metadata-getprobe types.
NOTE: If you configure the hardware timestamp feature (see“Configuring RPM Timestamping” on page 19):
• Thedata-sizedefault value is 32 bytes and32is the minimum value for explicit configuration. The UDP timestamp probe type is an exception; it requires a minimum data size of 44 bytes.
• Thedata-sizemust be at least 100 bytes smaller than the default MTU of the interface of the RPM client interface.
• On M Series and T Series routers, you configure thedestination-interfacestatement to enable hardware timestamping of RPM probe packets. You specify ansp-interface
to have the AS or Multiservices PIC add the hardware timestamps; for more information, see“Configuring RPM Timestamping” on page 19. You can also include the
one-way-hardware-timestampstatement to enable one-way delay and jitter measurements.
• To specify the User Datagram Protocol (UDP) port or Transmission Control Protocol (TCP) port to which the probe is sent, include thedestination-portstatement at the
[edit services rpm probeownertesttest-name]hierarchy level. Thedestination-port
statement is used only for the UDP and TCP probe types. The value can be7or from
49160through65535.
When you configure eitherprobe-type udp-pingorprobe-type udp-ping-timestamp
along with hardware timestamping, the value for thedestination-portcan be only 7. A constraint check prevents you from configuring any other value for the destination port in this case. This constraint does not apply when you are using one-way hardware timestamping.
• To specify the value of the Differentiated Services (DiffServ) field within the IP header, include thedscp-code-pointstatement at the[edit services rpm probeownertest test-name]hierarchy level. The DiffServ code point (DSCP) bits value can be set to a valid 6-bit pattern; for example,001111. It also can be set using an alias configured at the[edit class-of-service code-point-aliases dscp]hierarchy level. The default is
000000.
• To specify the number of stored history entries, include thehistory-sizestatement at the[edit services rpm probeownertesttest-name]hierarchy level. Specify a value from
0to512. The default is50.
• To specify a number of samples for making statistical calculations, include the
moving-average-sizestatement at the[edit services rpm probeownertesttest-name]
hierarchy level. Specify a value from0through255.
• To specify the number of probes within a test, include theprobe-countstatement at the[edit services rpm probeownertesttest-name]hierarchy level. Specify a value from
1through15.
• To specify the time to wait between sending packets, include theprobe-interval
statement at the[edit services rpm probeownertesttest-name]hierarchy level. Specify a value from1through255seconds.
• To specify the packet and protocol contents of the probe, include theprobe-type
statement at the[edit services rpm probeownertesttest-name]hierarchy level. The following probe types are supported:
• http-get—Sends a Hypertext Transfer Protocol (HTTP) get request to a target URL.
• http-metadata-get—Sends an HTTP get request for metadata to a target URL.
• icmp-ping—Sends ICMP echo requests to a target address.
• icmp-ping-timestamp—Sends ICMP timestamp requests to a target address.
• udp-ping—Sends UDP packets to a target.
• udp-ping-timestamp—Sends UDP timestamp requests to a target address.
The following probe types support hardware timestamping of probe packets:icmp-ping,
icmp-ping-timestamp,udp-ping,udp-ping-timestamp.
NOTE: Some probe types require additional parameters to be configured. For example, when you specify thetcp-pingorudp-pingoption, you must configure the destination port using thedestination-portstatement. The udp-ping-timestampoption requires a minimum data size of 12; any smaller data size results in a commit error. The minimum data size for TCP probe packets is 1.
When you configure eitherprobe-type udp-pingorprobe-type
udp-ping-timestampalong with theone-way-hardware-timestampcommand, the value for thedestination-portcan be only 7. A constraint check prevents you for configuring any other value for the destination port in this case.
• To specify the routing instance used by ICMP probes, include therouting-instance
statement at the[edit services rpm probeownertesttest-name]hierarchy level. The default routing instance is Internet routing tableinet.0.
• To specify the source IP address used for ICMP probes, include thesource-address
statement at the[edit services rpm probeownertesttest-name]hierarchy level. If the source IP address is not one of the router’s assigned addresses, the packet will use the outgoing interface’s address as its source.
• To specify the destination address used for the probes, include thetargetstatement at the[edit services rpm probeownertesttest-name]hierarchy level.
• For HTTP probe types, specify a fully formed URL that includeshttp://in the URL address.
• For all other probe types, specify an IP version 4 (IPv4) address for the target host.
• To specify the time to wait between tests, include thetest-intervalstatement at the
[edit services rpm probeownertesttest-name]hierarchy level. Specify a value from0
through86400seconds.
• To specify thresholds used for the probes, include thethresholdsstatement at the
[edit services rpm probeownertesttest-name]hierarchy level. A system log message is generated when the configured threshold is exceeded. Likewise, an SNMP trap (if configured) is generated when a threshold is exceeded. The following options are supported:
• egress-time—Measures maximum source-to-destination time per probe.
• ingress-time—Measures maximum destination-to-source time per probe.
• jitter-egress—Measures maximum source-to-destination jitter per test.
• jitter-rtt—Measures maximum jitter per test, from 0 through 60000000 microseconds.
• rtt—Measures maximum round-trip time per probe, in microseconds.
• std-dev-egress—Measures maximum source-to-destination standard deviation per test.
• std-dev-ingress—Measures maximum destination-to-source standard deviation per test.
• std-dev-rtt—Measures maximum standard deviation per test, in microseconds.
• successive-loss—Measures successive probe loss count, indicating probe failure.
• total-loss—Measures total probe loss count indicating test failure, from 0 through 15.
• Traps are sent if the configured threshold is met or exceeded. To set the trap bit to generate traps, include thetrapsstatement at the[edit services rpm probeownertest test-name]hierarchy level. The following options are supported:
• egress-jitter-exceeded—Generates traps when the jitter in egress time threshold is met or exceeded.
• egress-std-dev-exceeded—Generates traps when the egress time standard deviation threshold is met or exceeded.
• egress-time-exceeded—Generates traps when the maximum egress time threshold is met or exceeded.
• ingress-jitter-exceeded—Generates traps when the jitter in ingress time threshold is met or exceeded.
• ingress-std-dev-exceeded—Generates traps when the ingress time standard deviation threshold is met or exceeded.
• ingress-time-exceeded—Generates traps when the maximum ingress time threshold is met or exceeded.
• jitter-exceeded—Generates traps when the jitter in round-trip time threshold is met or exceeded.
• probe-failure—Generates traps for successive probe loss thresholds crossed.
• rtt-exceeded—Generates traps when the maximum round-trip time threshold is met or exceeded.
• std-dev-exceeded—Generates traps when the round-trip time standard deviation threshold is met or exceeded.
• test-completion—Generates traps when a test is completed.
• test-failure—Generates traps when the total probe loss threshold is met or exceeded.
Related Documentation
Real-Time Performance Monitoring Services Overview on page 3
•
• [edit services rpm] Hierarchy Level on page 9
Configuring RPM Receiver Servers
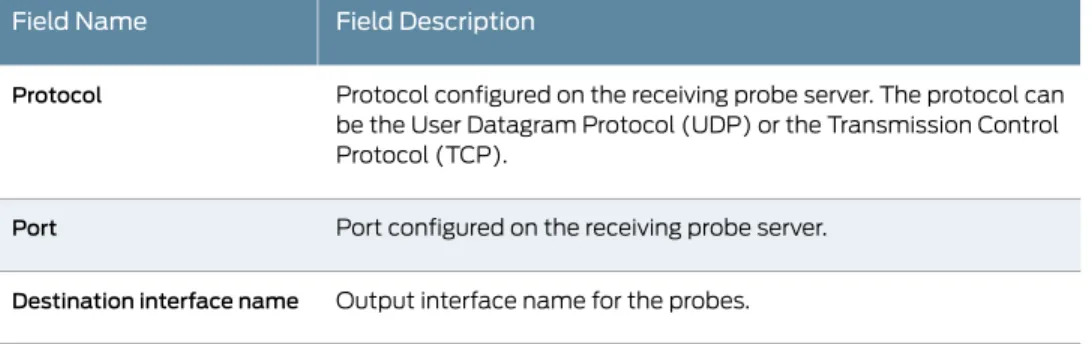
The RPM TCP and UDP probes are proprietary to Juniper Networks and require a receiver to receive the probes. To configure a server to receive the probes, include theprobe-server
statement at the[edit services rpm]hierarchy level:
[edit services rpm]
probe-server{
tcp{
destination-interfaceinterface-name;
portnumber; }
udp{
portnumber; }
}
The port number specified for the UDP and TCP server can be7or from49160through
65535.
NOTE: Thedestination-interfacestatement is not supported on PTX Series Packet Transport Routers.
When you configure eitherprobe-type udp-pingorprobe-type udp-ping-timestampalong with theone-way-hardware-timestampcommand, the value for thedestination-portcan be only 7. A constraint check prevents you for configuring any other value for the destination port in this case.
Related Documentation
Real-Time Performance Monitoring Services Overview on page 3
•
• [edit services rpm] Hierarchy Level on page 9
• Examples: Configuring Real-Time Performance Monitoring on page 32
Limiting the Number of Concurrent RPM Probes
To configure the maximum number of concurrent probes allowed, include theprobe-limit
statement at the[edit services rpm]hierarchy level:
probe-limitlimit;
Specify a limit from1through500. The default maximum number is 100.
Related Documentation
Real-Time Performance Monitoring Services Overview on page 3
•
• [edit services rpm] Hierarchy Level on page 9
Configuring RPM Timestamping
To account for latency in the communication of probe messages, you can enable timestamping of the probe packets. You can timestamp the following RPM probe types:
icmp-ping,icmp-ping-timestamp,udp-ping, andudp-ping-timestamp.
On M Series and T Series routers with an Adaptive Services (AS) or Multiservices PIC, and MX Series routers with a Multiservices DPC, and on EX Series switches, you can enable hardware timestamping of RPM probe messages. The timestamp is applied on both the RPM client router (the router or switch that originates the RPM probes) and the RPM probe server and applies only to IPv4 traffic. It is supported on the following:
• Layer 2 services package on all Mulitservices PICs and DPCs.
• Layer 3 service package on AS and Multiservices PICs and Multiservices DPCs.
• Extension-provider services package on M Series, MX Series, and T Series services PICs that support the Extension-Provider packages (In Junos OS releases earlier than 12.3, the extension-provider packages were variously referred to as Junos Services Framework (JSF), MP-SDK, and eJunos.)
• Layer 2, Layer 3, SDK Services, and PFE RPM timestamping interoperate with each other. Here, the RPM client can be on the Layer 3sp-interface and the RPM server can be on an SDK Services package.
NOTE: Hardware timestamping is not supported on PTX Series Packet Transport Routers.
Two-way timestamping is available onsp-andms-interfaces. To configure two-way timestamping on M Series and T Series routers, include thedestination-interfacestatement at the[edit services rpm probeprobe-ownertesttest-name]hierarchy level:
destination-interface sp-fpc/pic/port.logical-unit destination-interface ms-fpc/pic/port.logical-unit
Specify the RPM client router and the RPM server router on the adaptive services logical interface or the multiservices interface by including therpmstatement at the[edit interfacesinterface-nameunitlogical-unit-number]hierarchy level:
rpm(client | server);
The logical interface must be dedicated to the RPM task. It requires configuration of the
family inetstatement and a/32address, as shown in the example. This configuration is also needed for other services such as NAT and stateful firewall. You cannot configure RPM service onunit 0because RPM requires a dedicated logical interface; the same unit cannot support both RPM and other services. Because active flow monitoring requires
unit 0, but RPM can function on any logical interface, a constraint check prevents you from committing an RPM configuration there.
NOTE:If you configure RPM timestamping on an AS PIC, you cannot configure thesource-addressstatement at the[edit services rpm probeprobe-nametest test-name]hierarchy level.
On MX Series routers, on M-320 routers using the Enhanced Queuing MPC, and on EX Series switches, you include thehardware-timestampstatement at the[edit services rpm probeprobe-nametesttest-name]hierarchy level to specify that the probes are to be timestamped in the Packet Forwarding Engine host processor:
hardware-timestamp;
On the client side, these probes are timestamped in the Packet Forwarding Engine host processor on the egress DPC on the MX or M-320 Series router or EX Series switch originating the RPM probes (RPM client). On the responder side (RPM server), the RPM probes to be timestamped are handled by the Packet Forwarding Engine host processor, which generates the response instead of the RPM process. The RPM probes are
timestamped only on the router that originates them (RPM client). As a result, only round-trip time is measured for these probes.
When using thehardware-timestamp, thedata-sizevalue for the probe must be at least 100 bytes smaller than the default MTU of the interface of the RPM client interface (see “Configuring RPM Probes” on page 13).
NOTE: The Packet Forwarding Engine-based RPM feature does not support any stateful firewall configurations. If you need to combine RPM timestamping with a stateful firewall, you should use the interface-based RPM timestamping service described earlier in this section. Multiservices DPCs support stateful firewall processing as well as RPM timestamping.
To configure one-way timestamping, you must also include the
one-way-hardware-timestampstatement at the[edit services rpm probeprobe-owner testtest-name]hierarchy level:
NOTE: If you configure RPM probes for a services interface (sp-), you need to announce local routes in a specific way for the following routing protocols: • For OSPF, you can announce the local route by including the services
interface in the OSPF area. To configure this setting, include theinterface sp-fpc/pic/portstatement at the[edit protocols ospf areaarea-number] hierarchy level.
• For BGP and IS-IS, you must export interface routes and create a policy that accepts the services interface local route. To export interface routes, include thepoint-to-pointandlanstatements at the[edit routing-options interface-routes family inet export]hierarchy level. To configure an export policy that accepts the services interface local route, include theprotocol local,rib inet.0, androute-filtersp-interface-ip-address/32 exactstatements at the[edit policy-options policy-statementpolicy-nametermterm-name from]hierarchy level and theacceptaction at the[edit policy-options policy-statementpolicy-nametermterm-namethen]hierarchy level. For the export policy to take effect, apply the policy to BGP or IS-IS with theexport policy-namestatement at the[edit protocolsprotocol-name]hierarchy level. For more information about these configurations, see the Routing Policy Feature Guide for Routing Devices or the Junos OS Routing Protocols Library for Routing Devices.
Routing the probe packets through the adaptive services or Multiservices PIC also enables you to filter the probe packets to particular queues. The following example shows the RPM configuration and the filter that specifies queuing:
services rpm { probe p1 {
test t1 {
probe-type icmp-ping; target address 10.8.4.1; probe-count 10; probe-interval 10; test-interval 10; dscp-code-points af11; data-size 100;
destination-interface sp-1/2/0.0; }
} } firewall {
filter f1 { term t1 {
from { dscp af11; }
then {
forwarding-class assured-forwarding; }
} } }
interfaces sp-1/2/0 { unit 2 {
rpm client; family inet {
address 10.8.4.2/32; filter {
input f1; }
} } }
interfaces sp-1/2/1 { unit 2 {
rpm server; family inet {
address 10.8.3.2/32; filter {
input f1; }
} } }
For more information about firewall filters, see theRouting Policy Feature Guide for Routing Devices; for more information about queuing, see theJunos OS Class of Service Library for Routing Devices.
Related Documentation
Real-Time Performance Monitoring Services Overview on page 3
•
• [edit services rpm] Hierarchy Level on page 9
• Examples: Configuring Real-Time Performance Monitoring on page 32
Configuring TWAMP
You can configure the Two-Way Active Measurement Protocol (TWAMP) on all M Series and T Series routers that support Multiservices PICs (running in either Layer 2 or Layer 3 mode), and on MX Series routers. Only the responder (server) side of TWAMP is supported.
NOTE: TWAMP is not supported on PTX Series Packet Transport Routers.
For more information on TWAMP, see RFC 5357,A Two-Way Active Measurement Protocol (TWAMP).
To configure TWAMP properties, include thetwampstatement at the[edit services rpm]
hierarchy level:
[edit services rpm] twamp {
server {
client-list list-name { [ address address ]; }
authentication-mode mode; max-connection-duration hours; maximum-connections count;
maximum-connections-per-client count; maximum-sessions count;
maximum-sessions-per-connection count; port number;
server-inactivity-timeout minutes; }
}
The TWAMP configuration process includes the following tasks:
• Configuring TWAMP Interfaces on page 23
• Configuring TWAMP Servers on page 23
Configuring TWAMP Interfaces
To specify the service PIC logical interface that provides the TWAMP service, include the
twamp-serverstatement at the[edit interfaces sp-fpc/pic/portunitlogical-unit-number
hierarchy level:
twamp-server;
NOTE: On MX Series routers that do not include a Multiservices DPC, you can configure thetwamp-serverstatement on any interface (for example, ge-1/0/1.10). It is not necessary to configure this statement on a service interface (sp-orms-) but you do need to include it in the configuration to activate the TWAMP reflector functionality.
Configuring TWAMP Servers
You can specify a number of TWAMP server properties, some of which are optional, by including theserverstatement at the[edit services rpm twamp]hierarchy level:
[edit services rpm twamp] server {
client-list list-name { [ address address ]; }
authentication-mode mode; max-connection-duration hours; maximum-connections count;
maximum-connections-per-client count; maximum-sessions count;
maximum-sessions-per-connection count; port number;
server-inactivity-timeout minutes; }
• To specify the list of allowed control client hosts that can connect to this server, include theclient-liststatement at the[edit services rpm twamp server]hierarchy level. Each value you include must be a Classless Interdomain Routing (CIDR) address (IP address plus mask) that represents a network of allowed hosts. You can include multiple client lists, each of which can contain a maximum of 64 entries. You must configure at least one client address to enable TWAMP.
• You must specify the authentication mode by including theauthentication-mode
statement at the[edit services rpm twamp server]hierarchy level. There is no default value. You can configureauthenticatedorencryptedmode, based on RFC 4656; if there is no authentication or encryptions mode specified, you should set the value tonone. This statement is required in the TWAMP configuration.
• To specify the inactivity timeout period in seconds, include theinactivity-timeout
statement at the[edit services rpm twamp server]hierarchy level. By default, the value is1800; the range is 0 through 3600 seconds.
• To specify the maximum number of concurrent connections the server can have to client hosts, include themaximum-connectionsstatement at the[edit services rpm twamp server]hierarchy level. The allowed range of values is 1 through 1000 and the default value is 64. You can also limit the number of connections the server can make to a particular client host by including themaximum-connections-per-clientstatement. The allowed range of values is 1 through 500 and the default value is 64.
• To specify the maximum number of sessions the server can have running at one time, include themaximum-sessionsstatement at the[edit services rpm twamp server]
hierarchy level. The allowed range of values is 1 through 2048 and the default value is 64. You can also limit the number of sessions the server can have on a single connection by including themaximum-sessions-per-connectionstatement.
• To specify the TWAMP server listening port, include theportstatement at the[edit services rpm twamp server]hierarchy level. The range is 1 through 65,535.
• To specify the server inactivity timeout period in minutes, include the
server-inactivity-timeoutstatement at the[edit services rpm twamp server]hierarchy level. The range is 0 through 30 minutes.
Enabling RPM for the Junos OS extension-provider package
Real-time performance monitoring (RPM), which has been supported on the adaptive services interface, is now supported by the Junos OS extension-provider package. RPM is supported on all platforms and service PICs that support the extension-provider package.
NOTE: In Junos OS releases earlier than 12.3 , the extension provider package was variously known as MP-SDK, Junos Services Framework (JSF), and eJunos.
To enable RPM for the Junos OS extension-provider package on the adaptive services interface, configure theobject-cache-size,policy-db-size, andpackagestatements at the
[edit chassis fpcslot-numberpicpic-numberadaptive-services service-package
extension-provider]hierarchy level. For the extension-provider package,package-name
in thepackagepackage-namestatement isjservices-rpm.
For more information about the extension-provider package, see theSDK Applications Configuration Guide and Command Reference.
The following example shows how to enable RPM for the extension-provider package on the adaptive services interface:
chassis fpc 1 { pic 2 {
adaptive-services { service-package {
extension-provider { control-cores 1; data-cores 1;
object-cache-size 512; policy-db-size 64; package jservices-rpm; syslog daemon any; }
} } } } Related Documentation
Real-Time Performance Monitoring Services Overview on page 3
•
• [edit services rpm] Hierarchy Level on page 9
• Examples: Configuring Real-Time Performance Monitoring on page 32
• destination-interface on page 66
Configuring an RFC 2544-Based Benchmarking Test
You can configure a benchmarking test to detect and measure performance attributes, such as throughput, latency, frame loss, and bursty or back-to-back frames, of network devices. RFC 2544-based benchmarking test is performed by transmitting test packets from a device that functions as the generator or the initiator. These packets are sent to a device that functions as the reflector, which receives and returns the packets back to the initiator.
You must configure a test profile and reference the test profile in a unique test name that defines the parameters for the test to be performed on a certain device. However, the test profile is required when the test mode is configured as initiation and termination. Thetest-profileparameter is disregarded when the test mode is configured as reflection. MX104 routers support only the reflection function in the RFC 2544-based benchmarking tests. A reflection service does not use the parameters specified in the test profile because the reflection service it returns the frames to the initiator.
The following topics describe how to configure a test name for an RFC 2544-based benchmarking test on an MX104 router for Layer 3 IPv4 and Ethernet pseudowire networks:
• Configuring a Test Name for an RFC 2544-Based Benchmarking Test for a IPv4 Network on page 26
• Configuring a Test Name for an RFC 2544-Based Benchmarking Test for an Ethernet Pseudowire: on page 27
Configuring a Test Name for an RFC 2544-Based Benchmarking Test for a IPv4 Network
You can configure a test name by including thetest-nametest-namestatement at the
[edit services rpm rfc2544-benchmarking]hierarchy level. In the test name, you can configure attributes of the test iteration, such as the address family (type of service, IPv4 or Ethernet), the logical interface, and test duration that are used for a benchmarking test to be run.
To configure a test name and define its attributes for an IPv4 network: 1. In configuration mode, go to the[edit services]hierarchy level.
[edit]
user@host#edit services
2. Configure a instance.
[edit services] user@host#edit rpm
3. Configure an RFC 2544-based benchmarking test for the RPM instance.
[edit services rpm]
user@host#edit rfc2544-benchmarking
4. Define a name for the test—for example, test1. The test name identifier can be up to 32 characters in length.
[edit services rpm rfc2544-benchmarking] user@host#edit tests test-name test1
5. Specify the test mode for the packets that are sent during the benchmarking test. The
reflectoption causes the test frames to be reflected on the IPv4 network.
[edit services rpm rfc2544-benchmarking tests test-name test1] user@host#set mode reflect
6. Configure the address type family for the benchmarking test. Theinetoption indicates that the test is run on an IPv4 service.
[edit services rpm rfc2544-benchmarking tests test-name test1] user@host#set family inet
7. Configure the destination IPv4 address for the test packets. This parameter is required only if you configure IPv4 familyinet. If you do not configure the destination IPv4 address, the default value of 192.168.1.20 is used.
[edit services rpm rfc2544-benchmarking tests test-name test1] user@host#set destination-ipv4-addressaddress
8. Specify the UDP port of the destination to be used in the UDP header for the generated frames. If you do not specify the UDP port, the default value of 4041 is used.
[edit services rpm rfc2544-benchmarking tests test-name test1] user@host#set destination-udp-portport-number
9. (Optional) Specify the source IPv4 address to be used in generated test frames. If you do not configure the source IPv4 address forinetfamily, the source address of the interface is used to transmit the test frames.
[edit services rpm rfc2544-benchmarking tests test-name test1] user@host#set source-ipv4-addressaddress
10.Specify the UDP port of the source to be used in the UDP header for the generated frames. If you do not specify the UDP port, the default value of 4041 is used.
[edit services rpm rfc2544-benchmarking tests test-name test1] user@host#set source-udp-portport-number
11. Specify the logical interface on which the RFC 2544-based benchmarking test is run. If you configure aninetfamily and the test mode to reflect the frames back on the sender from the other end, then the logical interface is used as the interface to enable the reflection service (reflection is performed on the packets entering the specified interface). If you not configure the logical interface for reflection test mode, then a lookup is performed on the source IPv4 address to determine the interface that hosts the address.
[edit services rpm rfc2544-benchmarking tests test-name test1] user@host#set test-interfaceinterface-name
Configuring a Test Name for an RFC 2544-Based Benchmarking Test for an Ethernet Pseudowire:
You can configure a test name by including thetest-nametest-namestatement at the
[edit services rpm rfc2544-benchmarking]hierarchy level. In the test name, you can configure attributes of the test iteration, such as the address family (type of serviceIPv4 or Ethernet), the logical interface, and test duration, that are used for a benchmarking test to be run. The test name combined with the test profile represent a single real-time performance monitoring (RPM) configuration instance.
To configure a test name and define its attributes for an Ethernet Pseudowire: 1. In configuration mode, go to the[edit services]hierarchy level.
[edit]
user@host#edit services
2. Configure an RPM service instance.
[edit services] user@host#edit rpm
3. Configure an RFC 2544-based benchmarking test for the RPM instance.
[edit services rpm]
user@host#edit rfc2544-benchmarking
4. Define a name for the test—for example, test1. The test name identifier can be up to 32 characters in length.
[edit services rpm rfc2544-benchmarking] user@host#edit tests test-name test1
5. Specify the test mode for the packets that are sent during the benchmarking test. The
reflectoption causes the test frames to be reflected on the Ethernet pseudowire.
[edit services rpm rfc2544-benchmarking tests test-name test1] user@host#set mode reflect
6. Configure the address type family for the benchmarking test. Thecccoption indicates that the test is run on a CCC or Ethernet pseudowire service.
[edit services rpm rfc2544-benchmarking tests test-name test1] user@host#set family ccc
7. Specify the direction of the interface on which the test must be run. This parameter is valid only for a family. To enable the test to be run in the egress direction of the interface (network-to-network interface (NNI)), use theegressoption. To enable the test to be run in the ingress direction of the interface (user-to-network interface (UNI)), use theingressoption.
[edit services rpm rfc2544-benchmarking tests test-name test1] user@host#set direction egress
8. (Optional) Specify the source IPv4 address to be used in generated test frames. If you do not configure the source IPv4 address for family, the default value of 192.168.1.10 is used.
[edit services rpm rfc2544-benchmarking tests test-name test1] user@host#set source-ipv4-addressaddress
9. Specify the logical interface on which the RFC 2544-based benchmarking test is run.
[edit services rpm rfc2544-benchmarking tests test-name test1] user@host#set test-interfaceinterface-name
Related Documentation
RFC 2544-Based Benchmarking Tests Overview on page 4
•
• Example: Configuring an RFC 2544-Based Benchmarking Test for UNI Direction of Ethernet Pseudowires on page 44
• Example: Configuring an RFC 2544-Based Benchmarking Test for NNI Direction of Ethernet Pseudowires on page 51
• Example: Configuring an RFC 2544-Based Benchmarking Test for Layer 3 IPv4 Services on page 36
Tracing RPM Operations
Tracing operations track all RPM operations and record them in a log file. The logged error descriptions provide detailed information to help you solve problems faster. By default, no events are traced. If you include thetraceoptionsstatement at the[edit services rpm]hierarchy level, the default tracing behavior is the following:
• When the log file reaches 128 kilobytes (KB), it is renamedrmopd.0, thenrmopd.1, and so on, until there are three trace files. Then the oldest trace file (rmopd.2) is overwritten. (For more information about how log files are created, see theJunos OS System Log Messages Reference.)
• Log files can be accessed only by the user who configures the tracing operation. You can change this default behavior by using thetraceoptionsstatements. Changing the defaults is described in the following sections:
1. Configuring the RPM Log File Name on page 29
2. Configuring the Number and Size of RPM Log Files on page 29 3. Configuring Access to the Log File on page 29
4. Configuring a Regular Expression for Lines to Be Logged on page 30 5. Configuring the Trace Operations on page 30
Configuring the RPM Log File Name
By default, the name of the file that records RPM trace output isrmopd. To specify a different file name:
[edit services rpm traceoptions] user @hostset filefilename
Configuring the Number and Size of RPM Log Files
To configure the limits on the number and size of RPM trace files:
[edit services rpm traceoptions]
user@hostset filefilenamefilesnumbersizesize
The number of files can be from 2 through 1000 files. The file size of each file can be from 10 KB through 1 gigabyte (GB).
For example, set the maximum file size to 2 MB, and the maximum number of files to 20 for a log file namedrpmtrace:
[edit services rpm traceoptions]
user@hostset file rpmtrace files 20 size 2MB
When therpmtracefile reaches 2 MB, it is renamedrpmtrace.0, and a new file called
rpmtraceis created. When the newrpmtracereaches 2 MB,rpmtrace.0is renamed
rpmtrace.1andrpmtraceis renamedrpmtrace.0. This process repeats until there are 20 trace files. Then the oldest file (rpmtrace.19) is overwritten byrpmtrace.18.
Configuring Access to the Log File
By default, log files can be accessed only by the user who configures the tracing operation. To specify that any user can read all log files:
[edit services rpm traceoptions]
To explicitly set the default behavior:
[edit services rpm traceoptions]
user@hostset filefilenameno-world-readable
Configuring a Regular Expression for Lines to Be Logged
By default, the trace operation output includes all lines relevant to the logged events. To refine the output by specifying a regular expression (regex) to be matched:
[edit services rpm traceoptions]
user@hostset filefilenamematchregular-expression
Configuring the Trace Operations
By default, if thetraceoptionsconfiguration is present, only important events are logged. You can configure the trace operations to be logged by including the following statements at the[edit services rpm traceoptions]hierarchy level:
flag { all;
configuration; error;
ipc; ppm; statistics }
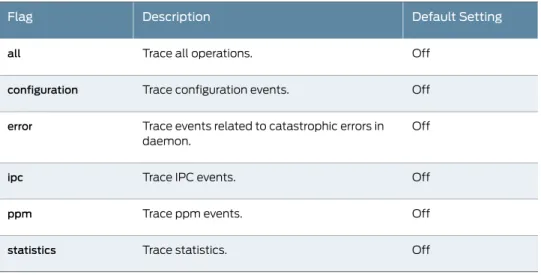
Table 4 on page 30describes the meaning of the RPM tracing flags.
Table 4: RPM Tracing Flags
Default Setting Description
Flag
Off Trace all operations.
all
Off Trace configuration events.
configuration
Off Trace events related to catastrophic errors in daemon.
error
Off Trace IPC events.
ipc
Off Trace ppm events.
ppm
Off Trace statistics.
• Examples: Configuring BGP Neighbor Discovery Through RPM on page 31
• Examples: Configuring Real-Time Performance Monitoring on page 32
• Example: Configuring an RFC 2544-Based Benchmarking Test for Layer 3 IPv4 Services on page 36
• Example: Configuring an RFC 2544-Based Benchmarking Test for UNI Direction of Ethernet Pseudowires on page 44
• Example: Configuring an RFC 2544-Based Benchmarking Test for NNI Direction of Ethernet Pseudowires on page 51
Examples: Configuring BGP Neighbor Discovery Through RPM
Configure BGP neighbor discovery through RPM for all logical systems and all routing instances:
[edit services rpm] bgp {
probe-type icmp-ping; probe-count 5; probe-interval 1; test-interval 60; history-size 10; data-size 255; data-fill 0123456789; }
Configure BGP neighbor discovery through RPM for only the following logical systems and routing instances:LS1/RI1,LS1/RI2,LS2, andRI3:
[edit services rpm] bgp {
probe-type icmp-ping; probe-count 5; probe-interval 1; test-interval 60; history-size 10; data-size 255; data-fill 0123456789; logical-system {
LS1 {
RI1; RI2; } } LS2; }
routing-instance { RI3;
} }
NOTE: Thelogical-systemstatement is not supported on PTX Series Packet Transport Routers.
Configure BGP neighbor discovery through RPM for only the default logical system and default routing instance:
[edit services rpm] bgp {
probe-type icmp-ping; probe-count 5; probe-interval 1; test-interval 60; history-size 10; data-size 255; data-fill 0123456789; logical-system {
null {
routing-instances { default;
} } } } Related Documentation
Real-Time Performance Monitoring Services Overview on page 3
•
• Configuring BGP Neighbor Discovery Through RPM on page 11
• [edit services rpm] Hierarchy Level on page 9
Examples: Configuring Real-Time Performance Monitoring
Configure an RPM instance identified by the probe nameprobe1and the test nametest1:
[edit services rpm] probe probe1{
test test1 {
dscp-code-points 001111; probe-interval 1;
probe-type icmp-ping; target address 172.17.20.182; test-interval 20;