167
One of the most startling economic facts of recent years has been the reversal in the long-standing catch-up of Europe’s productivity level with the United States. American labor productivity growth slowed after the early 1970s Oil Shocks but accelerated sharply after 1995. Although European productivity growth experienced the same slowdown, it has not enjoyed the same rebound (see Figure 1).1 For example, Inklaar, Timmer, and van Ark (2008) show that US GDP per hour growth accelerated from 1.3 percent 1980–1995 to 2.2 percent 1995–2006, whereas in Europe productivity growth slowed from 2.3 percent to 1.4 percent. Although some part of the observed European slowdown may be due to labor market reforms getting less skilled workers into jobs,
1 Examples of early studies include Jorgenson (2001) and Oliner and Sichel (2000). Looking at more recent data, Jorgenson, Ho, and Stiroh (2008) document that average annual US labor productivity growth was similar in the 2000–2006 period to the 1995–2000 period (and well above the 1.5 percent of 1973–1995). Only after 2005 is there any sign of a return to more “normal” levels of productivity growth as IT prices declines have slowed.
Americans Do IT Better: US Multinationals
and the Productivity Miracle
†By Nicholas Bloom, Raffaella Sadun, and John Van Reenen*
US productivity growth accelerated after 1995 (unlike Europe’s), particularly in sectors that intensively use information technologies
(IT). Using two new micro panel datasets we show that US multina-tionals operating in Europe also experienced a “productivity mira-cle.” US multinationals obtained higher productivity from IT than non-US multinationals, particularly in the same sectors responsible for the US productivity acceleration. Furthermore, establishments taken over by US multinationals (but not by non-US multination-als) increased the productivity of their IT. Combining pan-European firm-level IT data with our management practices survey, we find that the US IT related productivity advantage is primarily due to its tougher “people management” practices. (JEL D24, E23, F23, M10, M16, O30)
* Bloom: Department of Economics, Stanford University, 579 Serra Mall, Stanford, CA 94305-6072, Centre for Economic Performance, CEPR, and NBER (e-mail: [email protected]); Sadun: Harvard Business School, Soldiers Field, Boston, MA 02163, Centre for Economic Performance and NBER (e-mail: [email protected]); Van Reenen: London School of Economics, Centre for Economic Performance, Houghton Street, London WC2A 2AE, UK, CEPR, and NBER (e-mail: [email protected]). This is a revised version of NBER Working Paper 13085 “Americans Do I.T. Better: US Multinationals and the Productivity Miracle” and the mimeo “It Ain’t What You Do but the Way that You Do I.T.” We would like to thank our formal discussants (Susanto Basu, Erik Brynjolfsson, Johannes von Biesebroeck, John Fernald, Bart Hobijn, and Stephen Yeaple), Tony Clayton, Chiara Criscuolo, Mary O’Mahony, and Ralf Martin. We would also like to thank the Department of Trade and Industry, and the Economic and Social Research Council for financial support. This work contains statistical data from the Office of National Statistics (ONS) which is Crown copyright and reproduced with the permission of the controller of HMSO and Queens Printer for Scotland. The use of the ONS statistical data in this work does not imply the endorsement of the ONS in relation to the interpretation or analysis of the statistical data.
† To view additional materials, visit the article page at http://dx.doi.org/10.1257/aer.102.1.167. Americans Do IT Better: US Multinationals and the Productivity Miracle† 167
I. Empirical Modeling Strategy 171 A. Basic Empirical Model 171
B. Testing the Model when O is Unobserved 173
C. Testing the Model Using Direct Measurement of Firm Management Practices 176 D. Models of Adjusting Management Practices 177
II. Establishment-Level Panel Data from the UK Census 178 III. Results from the UK Establishment Panel 180
A. Main Results 180
B. Robustness Tests of the Production Function Results 183 C. Estimation of the IT Intensity Equation 187
D. US Multinational Takeovers of UK Establishments 188
IV. Firm-level Panel Data from Seven European Countries 191 V. Results from a Cross-European Firm-Level Panel 193
A. People Management in US Firms Compared to Other Countries’ 193 B. Results 194
VI. Conclusions 197 REFERENCES 199
most analysts agree there was still a substantial gap in productivity growth between the United States and European Union that has persisted. Nor has the recent recession changed this picture: US productivity growth appears to have continued to outstrip that in Europe (Gordon 2010).
Decompositions of US productivity growth show that a large fraction of this recent growth occurred in those sectors that either produce IT (information tech-nologies) or intensively use IT. Closer analysis has shown that European countries had a similar productivity acceleration as the United States in IT-producing sectors (such as semiconductors and computers) but failed to achieve the spectacular levels of productivity growth in the sectors that used IT intensively—predominantly mar-ket service sectors, including wholesale, retail, and financial services (e.g., van Ark, O’Mahony, and Timmer 2008). In light of the credit crunch, the measured produc-tivity gains in finance may prove illusory—which is why we focus on nonfinancial firms in the article—but the productivity gains in other sectors like retail and whole-sale are likely to be real and persistent. Consistent with these trends, Figure 2 shows that IT intensity appears to be substantially higher in the United States than in Europe, and this gap has not narrowed over time. Given the common availability of IT throughout the world at broadly similar prices, it is a major puzzle why these IT related productivity effects have not been more widespread in Europe.
There are at least two broad classes of explanation for this puzzle. First, there may be some “natural advantage” to being located in the United States, enabling firms to make better use of the opportunity that comes from rapidly falling IT prices. These natu-ral advantages could be tougher product market competition, lower regulation, better access to risk capital, more educated2 or younger workers, larger market size, greater
2 For example, if IT is complementary with human capital, then the larger stock of college educated workers in the United States than Europe may mean that productivity grows faster in the United States when IT prices are falling rapidly.
25 30 35 40 45 50
O
ut
pu
t p
er
ho
urs
w
or
ke
d,
2
00
5
U
S$
1980 1985 1990 1995 2000 2005
Year
US Europe
Figure 1. Output per Hour in Europe and the United States, 1980–2005
Notes: Productivity measured by GDP per hour in 2005 US$ PPPs. The countries included in the “EU15” group are: Austria, Belgium, Denmark, Finland, France, Germany, United Kingdom, Greece, Italy, Ireland, Luxembourg, Portugal, Spain, Sweden, and Netherlands. Labor productivity measured as GDP per hour worked in 2005 US$.
geographical space, or a host of other factors. A second class of explanations stresses that it is not the US environment per se that matters but rather the way that US firms are managed that enables better exploitation of IT (“the US management hypothesis”).3
These explanations are not mutually exclusive. In this article we sketch a model that has elements of both (see online Appendix B and Bloom, Sadun, and Van Reenen 2007). Nevertheless, one straightforward way to test whether the US management hypothe-sis has any validity is to examine the IT performance of US owned organizations in a European environment. If US multinationals partially transfer their business models to their overseas affiliates—and a walk into McDonald’s or Starbucks anywhere in Europe suggests that this is not an unreasonable assumption—then analyzing the IT perfor-mance of US multinational establishments in Europe should be informative. Finding a systematically better use of IT by American firms outside the United States suggests that we should take the US management hypothesis seriously. Such a test could not be easily performed with data only on plants located in the United States, because any findings of higher efficiency of plants owned by US multinationals might arise because of the advantage of operating on the multinational’s home turf (“home bias”).4
In this article, we examine the differences in IT related productivity between establishments owned by US multinationals, establishments owned by non-US multinationals, and purely domestic establishments. We exploit two distinct rich
3 Another possibility is international differences in productivity measurement (Blanchard 2004). This is pos-sible, but the careful work of O’Mahony and Van Ark (2003) focusing on the same sectors in the United States and European Union, using common adjustments for hedonic prices, software capitalization, and demand conditions, still finds a difference in US-EU relative productivity growth rates.
4 Doms and Jensen (1998) find that plants owned by US multinationals have higher productivity than those of non-US multinationals. But since this study was based only on those located in the United States, it could just be a reflection of home bias.
0 2 4 6 8
IT capital stock per
hours worked, 2000 US$
1980 1985 1990 1995 2000 2005
Year
US
Europe
Figure 2. IT Capital per Hour in Europe and the United States, 1980–2005
Notes: IT capital stock (in unit dollars) per hour worked. IT capital stock measured using perpetual inventory method and common assumptions on hedonics and depreciation. 2005 US$ PPPs. The countries included in the “EU15” group are: Austria, Belgium, Denmark, Finland, France, Germany, UK, Greece, Italy, Ireland, Luxembourg, Portugal, Spain, Sweden, and the Netherlands. Labor productivity per hour worked in 2005 US$ using PPPs.
Source: Timmer, Ypma, and Ark, “IT in the European Union: Driving Productivity Convergence?” Research Memorandum GD-67, Groningen Growth and Development Centre, October 2003, Appendix Tables, updated June 2005.
and original panel datasets. The first is from the UK Census Bureau (the Office of National Statistics (ONS)) and contains over 11,000 establishments. The UK is a useful testing ground because (a) it has extensive foreign ownership with fre-quent ownership changes and (b) the UK Census Bureau has collected panel data on IT expenditure and productivity in both manufacturing and services since the mid-1990s. The second dataset is a firm-level panel covering seven European coun-tries and combines our own international survey of management practices, a private-sector IT survey, and company accounting data. Although this European dataset is smaller, the use of observable measures of management practices allows a more direct test of the theory.
We report that foreign affiliates of US multinationals appear to obtain higher pro-ductivity than non-US multinationals (and domestic firms) from their IT capital and are also more IT intensive. This is true in both the UK establishment-level dataset and the European firm-level dataset. These findings are robust to a number of tests, including an examination of establishments before and after they are taken over by a US multinational compared to those taken over by a non-US multinational. Using our new international management practices dataset, we then show that American firms have higher scores on “people management” practices defined in terms of promotions, rewards, hiring, and firing.5 This holds true for both domestically based US firms as well as US multinationals operating in Europe. Using our European firm-level panel, we find these management practices account for most of the higher output elasticity of IT of US firms. This appears to be because people management practices enable US firms to better exploit IT.
Our article is related to several other literatures. First, there is a large body of work on the impact of IT on productivity at the aggregate or industry level.6 Second, there is growing evidence that the returns to IT are linked to the internal organization of firms. On the econometric side, Caroli and Van Reenen (2001); Bresnahan, Brynjolfsson, and Hitt (2002); and Crespi, Criscuolo, and Haskel (2007) find that internal organization and other complementary factors, such as human capital, are important in generating significant returns to IT. On the case study side, there is also a large range of evidence.7 Third, in a reversal of the Solow Paradox, the firm-level productivity literature describes returns to IT that are larger than one would expect under the standard growth accounting assump-tions. Brynjolfsson and Hitt (2003) argue that this is due to complementary investments in “organizational capital” that are reflected in the coefficients on IT capital. Fourth, there is a literature on the superior establishment-level productiv-ity of US multinationals versus non-US multinationals, both in the United States and in other countries.8 We suggest that the main reason for this difference is the way in which US multinationals use new technologies more effectively than other multinationals. Finally, our article is linked to the literature on multinationals
5 It is plausible that higher scores reflect “better” management, but we do not assume this. All we claim is that American firms have different people management practices than European firms, and these are complementary with IT.
6 See, for example, Basu et al. (2003) and Stiroh (2002, 2004).
7 Blanchard et al. (2002) discuss a number of industry-specific examples. Baker and Hubbard (2004) is an excel-lent example of applying econometric techniques to a case study of on-board computers in the US trucking industry. 8 See, for example, Doms and Jensen (1998) on US plants; Haltiwanger, Jarmin, and Schank (2003) on German plants; Criscuolo and Martin (2009) on British plants; and Benfratello and Sembenelli (2006) on Italian plants.
and comparative advantage. A recent body of theoretical work emphasizes the importance of firm-level comparative advantage in multinationals.9 In these mod-els firms have some productivity advantage, which their multinationals transplant to their overseas affiliates. Our evidence on the systematically different people management practices of US overseas affiliates provides empirical support for this assumption. Interestingly, these results are also consistent with the litera-ture reporting that US multinationals appear to be earning extremely high rates of return abroad from intangible capital (“dark matter”), particularly since the mid-1990s (e.g., McGrattan and Prescott 2008). Our results suggest one factor could be that the management practices of US multinationals enable them to more effectively use IT.
The structure of this article is as follows. Section I describes the empirical framework, the UK establishment-level data is described in Section II, and the results from this panel are presented in Section III. The European firm-level data is described in Section IV, and the results from this panel are presented in Section V. Section VI offers some concluding remarks. Appendices are all available on the AER website.
I. Empirical Modeling Strategy
We sketch our basic modeling strategy with more formal details in online Appendix B. Here, Section A describes the basic approach, and Section B describes the equa-tions we can estimate when we do not directly observe management practices, as is standard in most economic datasets (this is the case for our UK establishment-level panel). By contrast, Section C describes the equations we are able to estimate when we do directly observe management practices (this can be implemented on our pan-European firm-level panel).
A. Basic Empirical Model
Consider the following production function:
(1) Qit = A it O itα
O
C itα
C+σ O it L
it α L −σ Oit K
it α K M
it α M ,
where Q denotes gross output of establishment (or firm) i in year t. A is a Hicks-neutral efficiency term, M denotes materials/intermediate inputs, L denotes labor, K denotes non-IT capital, C denotes computer/IT capital, and O is a measure of the firms’ management/organizational capital that is complementary with IT capital. This specification of the production function in equation (1) is a simple way of capturing the notion that IT (C) and management (O) are complementary if σ> 0 (Bresnahan et al. 2002). Equation (1) should be regarded as an approximation of a more flexible production function: we examine these more general production functions (such as the translog) in the empirical section and show that equation (1) is consistent with the 9 For example, Helpman, Melitz, and Yeaple (2004); Antras, Garicano, and Rossi-Hansberg (2008); and Burstein and Monge-Naranjo (2009).
empirical results.10 We assume that all the exponents on the factor inputs are bounded by zero and unity to make sure the firm’s optimization problem is well behaved (i.e., 0 ≤{ αL−σO, αC+σO, αK, αM, αO}≤ 1). This means the value of σ, αL , and αC are dependent on the scaling of O, so that, for example, doubling the units on O would halve the units on σ. Note that αO could be equal to zero, so that increasing O would have no direct effect on firm output. Finally, we will generally consider O to be fixed in the short run (Section D relaxes this assumption).
We use lower case letters to indicate that a variable is transformed into natural log-arithms, so q it ≡ ln Q it , etc., and consider parameterizing the establishment-specific efficiency in equation (1) as a it= a i+γ′ z it+ ξkt+ u it , where z are other observable factors influencing productivity—e.g., establishment age, region, and whether the establishment is part of a multiplant group. The ξkt are industry-time specific shocks that we will control for with a full set of three-digit industry (k) dummies interacted with a full set of time dummies.11 Under these assumptions, equation (1) can be written
(2) (q − l )it = αC (c − l )
it + αK (k − l )it + α M (m − l )it + ( αC + αL + α M + αK − 1) l
it
+ σ
[
(c − l )it × O it)]
+ αO ln O it + a i + γ′ z it + ξkt + u it. Note that we choose to normalize on labor, as this makes it straightforward to test for constant returns by examining whether the coefficient on labor in equation (2) is significantly different from zero. In online Appendix C and Bloom, Sadun, and Van Reenen (2007) we consider the nonnormalized version (as in footnote 10) showing similar results.Another implication of the idea that IT capital is complementary with specific types of management practices is that, ceteris paribus, firms with higher levels of O will have a greater demand for IT capital. We consider the IT intensity equation:12
(3) (c − l )it = β O O
it + φ′ w it + ςkt + e it,
where w it are controls, ςkt are the industry-time shocks, e it is an error term, and we expect β O to be positive under complementarity of IT and O. It is worth not-ing that the estimates of equations (2) and (3) embody alternative identification
10 A more flexible translog production relationship would be ln Q = ∑
J={O, M, L, K, C}
α J ln X J + ∑ J={O, M, L, K, C}
(
∑ Z={O, M, L, K, C}α J Z ln X J ln X Z
)
,where a superscript denotes a factor input so X L = L = labor, etc. The second term on the right-hand side of this equation contains the term ln(X O) × ln(X C ), the interaction between management and IT, which we find to be crucial in the empirical work.
11 We also experimented with year-specific four-digit dummies and explicit measures of output prices (up to the five-digit level) which generated very similar results to our baseline model with year-specific three-digit industry dummies.
12 This is a first-order approximation to the nonlinear factor demand equation (B7) for IT in online Appendix B where the factor prices are common across firms in an industry for a given year. If σ> 0 then β O> 0.
assumptions. For example, assume that there is exogenous variation in O i across firms, but no exogenous variation in IT capital. Complementarity will imply that the factor demand equation for IT is a positive, but deterministic, function of O i . Thus, equations of the form of (3) are useful to identify complementarity. By contrast, it will not be possible to identify the coefficient on IT capital (nor σ, the coefficient on its interaction with O i) in the production function because IT capital has no firm-level variation conditional on O i . In practice, however, the production function coef-ficients can be identified from adjustment costs or shocks to IT capital arising from falling prices and optimization errors (see online Appendix C). But examining the IT demand equation is a useful cross check on these results.
A key idea in this article is that _O USA> O _ MNE> O _ dOM, where O _ USA is the mean level of management in US firms, O _ MNE the mean level in non-US multinationals and _O dOM, the mean level in domestic firms. We describe below two different empirical strategies to test this hypothesis, which vary according to the availability of data on O.
B. Testing the Model when O is Unobserved
Basic Production Function.—When O is unobserved, given its complementar-ity with IT, we expect to see systematic differences in the elasticcomplementar-ity of output with respect to IT capital in equation (2) between US and other firms. In order to test this hypothesis we estimate the following production function for different sectors (e.g., IT intensive and non–IT intensive):13
(4) (q − l )it = α C, dOM (c − l )
it + α K (k − l )it + α M (m − l )it + ( α C, dOM + α L + α M + α K − 1) l
it + α C, USA
[
(
c − l) × d USA]
it + α C, MNE
[
(c − l) × d MNE]
it + a i + δUSA d itUSA + δ MNE d MNEit + γ′ z it + ξkt + u it ,
where d itUSA denotes that the establishment is owned by a US firm in year t and d itMNE denotes that the establishment is owned by a non-US multinational enterprise (the omitted base is that the establishment belongs to a nonmultinational domestic firm denoted “dOM”).14 If our model is correct, then empirically when we estimate equation (4) we should find α C, USA> α C, MNE> α C, dOM, i.e., a greater productiv-ity effect of IT in US multinationals than in non-US multinationals or domestic
13 In the robustness section we estimate equation (4) separately across different two- and three-digit industries. 14 We could not reject the hypothesis that UK multinationals had the same productivity and output elasticity of IT capital as other non-US multinationals.
establishments.15 Note that the final inequality ( α C, MNE> α C, dOM) is less of a clean test as domestic firms may be quite different from multinationals on a number of dimensions, whereas non-US multinationals are a more credible “control group” for US multinationals. A related hypothesis is that US multinationals are more produc-tive than non-US multinationals and domestic firms, i.e. δ C, USA+ α C, USA(c− l )
it > δ C, MNE+ α C, MNE(c− l )
it> δ C, dOM
+ α C, dOM(c− l )
it. This has to be evaluated at a particular level of IT intensity, but since the overall mean of ln(C/L) is close to zero, a test of the equality of the multinational dummies is presented at the base of every table.
Another implication of the idea that US firms have an advantage in the use of IT is that, ceteris paribus, they will have a greater demand for IT capital. Consequently, we estimate the IT intensity equation equivalent to equation (3):
(5) (c − l )it = β USA d it
USA + β MNE d it
MNE + φ′ w
it + ςkt + e it ,
where w it are controls, ςkt the industry-time shocks, and e it is an error term. The hypothesis of interest is, of course, whether β USA> β MNE> 0 with a focus on the first inequality, β USA> β MNE.
Since the significance of the US × ln(C/L) interaction (the α C, USA coefficient in equation (4)) may capture unobservable factors beyond managerial differences, we perform an extensive range of tests to check the robustness of our results. These are detailed below.
Subsample of Establishments that are Taken Over.—One concern with our empiri-cal strategy is that US firms may “cherry pick” the establishments with the highest IT productivity. This would generate a higher IT coefficient for American firms, but this would only be due to positive selection. To tackle this issue we focus on a subsample of UK establishments that have been taken over at some point in the sample period. Prior to the takeover we find no evidence of differential coefficients on IT in establish-ments subsequently targeted by US firms versus non-US firms. But after the takeover we find that establishments acquired by US firms have significantly higher IT produc-tivity than those taken over by other firms.
Unobserved Heterogeneity.—In all specifications, we choose a general structure of the error term that allows for arbitrary heteroskedasticity and autocorrelation over
15 A more general form of the production function is one where we allow all the factor inputs ( x it
J) to differ by ownership status:
qit= ∑ J={M, L, K, C}
α J, dOM x it
J + ∑ J={M, L, K, C}
α J, USA d it USA x
it
J + ∑ J={M, L, K, C}
α J, MNE d it MNE x
it J + a
i
+ δ USA d it
USA + δ MNE d it MNE + γ′ z
it + ξkt + u it .
Note that although we will estimate this equation in some specifications, empirically the interactions between the non-IT factor inputs and ownership status are not significantly different from zero. The one interaction that does stand out is between the US ownership dummy and IT capital: the coefficient on IT capital is significantly higher for US establishments than for other multinationals or domestic establishments. We also cannot reject the hypothesis that all ownership types have the same return to scale parameter so we generally impose this.
time. But there could still be establishment-specific unobserved heterogeneity. So, we also generally include a full set of establishment-level fixed effects (the “within-groups” estimator). The fixed-effects estimators are more demanding, as they con-trol for unobservable omitted variables correlated with IT that generate an upward bias for the coefficient on IT capital.
One aspect of unobserved heterogeneity is establishment-specific prices that will not be fully controlled for by the fixed effects and the industry dummies interacted with time dummies (see Foster, Haltiwanger, and Syverson 2008). Empirically, the dependent variable in equation (4) is revenue, not physical units, so we are estimat-ing “revenue productivity” equations rather than physical productivity equations, and we should interpret the coefficients on the factor inputs as reflecting both the technological parameters and a mark-up term.
To investigate this, we will estimate the “revenue productivity function,” allow-ing for monopolistic competition followallow-ing Klette and Griliches (1996) and De Loecker (2011). Essentially this implies including additional terms for four-digit output interacted by ownership type to the empirical analog of equation (4). Note, however, differential mark-ups for American firms cannot easily explain one of our findings that the coefficient on IT is significantly larger for US firms, but the other factor coefficients appear to be the same across multinationals types. If US firms are able to command a higher output price for IT capital, this is consistent with the idea that IT improves quality (rather than simply increasing output) by more for American multinationals than other multinationals. This higher IT-related quality would be reflected in a firm-specific higher mark-up for IT-intensive US firms. This is consistent with our theoretical story.
Endogeneity of the Factor Inputs.—We take several approaches to check the robustness of our results to the endogeneity issue, accepting that there is no “magic bullet” to this problem, which is still an active area of econometric research (see Ackerberg et al. 2008, for a survey). In particular, we present results using a version of the Olley-Pakes estimator (1996) allowing for multiple capital inputs, and the “System GMM” estimator of Blundell and Bond (1998, 2000). In both cases we find a much higher IT coefficient for US firms in the production function. We also pres-ent IT intensity equations derived from the first-order conditions of the model and find that US firms have significantly higher IT capital intensities than other firms, especially in the IT-intensive sectors.
Heterogeneity in the Coefficients by Industry.—We allow for considerable hetero-geneity by including fixed effects and industry effects interacted with time dummies. But the fact that the gap in US-EU productivity growth is so concentrated in the so-called “IT-intensive sectors” suggests breaking down the regression estimates along these lines. We follow exactly the same classification as Stiroh (2002) to divide our sample into those which intensively use IT versus the rest of the sample (he based these on the flow of IT services in total capital services). These are predominantly service sectors such as wholesale, retail, and business services but also include sev-eral manufacturing sectors such as printing and publishing (see online Table A1). We interpret this sectoral breakdown as indicating which sectors in Europe have the greatest potential (i.e., highest σ) to benefit from IT enabled innovations if firms are
able to adopt the appropriate complementary organizational practices.16 Blanchard
(2004) and Blanchard et al. (2002) give many examples of these
from various
in-depth
case studies. One could argue, for example, whether or not Stiroh was correctin classifying retail in the IT-intensive sector, but this is beside the point—retail is a sector that had fast productivity growth in the United States post-1995, and not in Europe. Our hypothesis is that part of this difference was due to different management practices which enabled US retailers to efficiently exploit IT enabled innovations in retail.17 If that was the case, then estimating equation (4) by differ-ent industry sectors should reveal a much stronger US × ln(C/L) interaction in the “IT-intensive sectors” than in the other industries. We also go further, estimating the production functions separately by each two-digit sector, in particular breaking down the IT-intensive sector into subindustries such as retail and wholesale.
C. Testing the Model Using direct Measurement of Firm Management Practices
A more direct way to test whether US firms have higher levels of O (i.e., O _USA > O _MNE) is to use explicit measures of management. For this purpose, we collected our own data on management practices based on the methodology in Bloom and Van Reenen (2007). We empirically measure O by an index of the “people management” in the firm which combines indicators of best practice in hiring, promotions, pay, retention, and removing underperformers (see below and online Appendix A). We focus on these people management aspects of firm organization because the econo-metric and case-study evidence suggest that these features are particularly important for IT. The successful deployment of IT requires substantial changes in the way that employees work, including the ability to decentralize decision making so employees can experiment. High outcomes on our people management scores will reflect this.18
We show that this index of people management is higher in US multinationals than in non-US multinationals (and domestic firms). In particular, US firms tend to be more aggressive in promoting and rewarding high performing workers and remov-ing underperformremov-ing workers.19 We combine the measures of people management with firm-level panel data from accounting information and an alternative source
16 We think this division is most appropriate as it does not rely on our subjective judgement. We consider other sectoral breakdowns such as using the industry level IT services share in Europe rather than the US and the IT to value added ratio. We obtain similar results from this. We also looked at a finer level of disaggregation by industry
(such as splitting out retail and wholesale—see Section III).
17 Retailing has shifted from a low-tech industry focused on shifting boxes from producer to consumer to an industry whose main activity is trading information by matching goods to consumer demand on a near continuous basis, where IT is an integral part of this process.
18 For example, the organizational measure in Bresnahan, Brynjolfsson, and Hitt (2002) covers six measures which relate to the way that employees are managed (three questions on teamwork, two on decentralization over pace and methods of work, and one on employee involvement).
19 The econometric and case-study evidence suggest that these features of people management are particularly important for IT. The successful deployment of IT requires substantial changes in the way that employees work, which is highly intensive in people management. For example, Hunter et al. (2001) describe how IT radically changed the organization of US banks in the 1980s. The introduction of ATMs substantially reduced the need for tellers. At the same time PCs allowed staff to locate on the bank floor and directly sell customers mortgages, loans, and insurance, replacing bank managers as the primary sales channel for these products. IT also enabled regional managers to remotely monitor branches. This led to a huge reduction in branch-level management, an extensive realignment of job responsibilities, and major human-resources reorganization for senior bank managers. We dis-cuss in more detail the empirical measures in the online Data Section.
of IT data described below. Using this new European firm-level panel database we estimate an augmented form of equation (4):
(6) (q − l )it = αC , dOM (c − l )
it + αK (k − l )it + α M (m − l )it + σ
[
(c − l )it × O i)]
+ αO ln O i+
(
αC , dOM + α L + αK + α M − 1)
l it+ αC , USA
[
(c − l) × d USA)
]
it + αC , MNE
[
(c − l) × d MNE]
it + a i + δUSA dit
USA + δMNE d it
MNE + γ′ z
it + ξkt + u it . If our hypothesis is correct that the higher coefficient on IT in the production function for US multinationals is due to their management practices, then we would predict that σ > 0 and that αC , USA, the coefficient on the interaction between IT intensity and the US multinational dummy, [(c− l) × d USA) ]
it, would be insignificant once we condi-tion on [(c− l )it× O i)]. We will show that this is indeed the case in our European panel dataset. Note that this does not imply that management is unimportant without IT, nor that management matters only in certain sectors. Rather we are arguing these practices may be particularly important when combined with IT enabled innovations in the high productivity growth sectors of the “productivity miracle” period.
D. Models of Adjusting Management Practices
To what extent does O change over time at the firm level? There is limited empiri-cal evidence here, but many case studies suggest that management practices are difficult to change for incumbents. Microeconometric studies of responses to exter-nal shocks such as deregulation (e.g., Olley and Pakes 1996) or trade liberalization (e.g., Pavcnik 2002) suggest that much aggregate change in productivity is driven by reallocation, entry, and exit rather than simply incumbent plants increasing their productivity. Some theoretical models are built on the assumption that the efficiency of establishments is fixed at birth (e.g., Jovanovic 1982; Melitz 2003). So, in the short run, the assumption of quasi-fixed management practices seems plausible, and we exploit this in our estimation.
In the longer run, however, management practices are variable to some degree. Online Appendix B discusses some formal models where we allow management practices to be endogenously chosen by the firm. The first extension is to allow practices to be transferred when one firm takes over another firm. As with recent trade theory (e.g., Antras, Garicano, and Rossi-Hansberg 2008), we assume that a multinational can transfer its management practices overseas (subject to some cost). This generates predictions of a distinctive dynamic pattern for the productivity-IT relationship for establishments taken over by US multinationals, which we find in the takeover subsample (see Section IB).
Online Appendix B also discusses allowing management practices to be adjust-able even for establishments that are not taken over (with and without adjustment costs) and shows that the key predictions are robust to this extension. We also dis-cuss how our modeling structure relates to Basu et al. (2003), who also consider a formal model of productivity dynamics when there is complementarity between IT and organization.20
II. Establishment-Level Panel Data from the UK Census
We use two main datasets in the article which are drawn from several sources. A full description of the datasets appears in online Appendix A. The first is an origi-nal UK establishment-level panel constructed from combining multiple datasets within the UK Census Bureau. We present results from this data in Section III. The second is a firm-level panel dataset across seven European countries. This com-bines our own survey of management practices, an establishment-level IT panel, and European firm-level accounting data. We describe the data in detail in Section IV and present the results in Section V. Both datasets are unbalanced panels—i.e., we do not condition on the subsample of firms that are alive throughout the time period.
The basis of the UK data is a panel of establishments covering all sectors of the UK private sector called the Annual Business Inquiry (ABI). It does not include financial services, which is a virtue given the difficulty of measuring productivity in these sectors, as the financial crisis has amply demonstrated. The ABI is similar in structure and content to the US Annual Survey of Manufacturing (ASM), and it contains detailed information on revenues, investment, employment, and material/ intermediate inputs. However, unlike the US ASM, it also covers the nonmanufac-turing sector from the mid-1990s onward. This is important, because the majority of the sectors responsible for the US productivity acceleration are outside manu-facturing, such as retailing and wholesaling.21 We were also able to obtain access to several surveys of establishment-level IT expenditure conducted annually by the UK Census Bureau, which we then matched into the ABI using the establishment’s reference number. The dataset is unique in containing such a large sample of estab-lishment-level longitudinal information on IT and productivity.
We build IT capital stocks from IT expenditure flows using the perpetual inven-tory method and following Jorgenson (2001), keeping to US assumptions about depreciation rates and hedonic prices. We considered several experiments by changing our assumptions concerning the construction of the IT capital stock using alternative assumptions over depreciation rates and initial conditions.22
20 In Appendix B of Bloom, Sadun, and Van Reenen (2007) we show how IT adjustment costs could help ratio-nalize these TFP dynamics. See also Basu et al. (2003).
21 The new US Longitudinal Business Database includes services but does not have information on IT or non-IT investment (see Davis et al. 2006).
22 First, because there is uncertainty over the exact depreciation rate for IT capital, we experimented with a number of alternative values. Second, we do not know the initial IT capital stock for ongoing establishments the first time they enter the sample. Our baseline method is to impute the initial year’s IT stock using as a weight the establishment’s observed IT investment relative to the industry IT investment. An alternative is to assume that the plant’s share of the industry IT stock is the same as its share of employment in the industry. All methods gave similar results.
Furthermore, we present results using an entirely different measure of IT usage based on the number of workers in the establishment who use computers (taken from a different survey, the E-Commerce Survey). Qualitatively similar results were obtained from all methods.
Our final dataset runs from 1995 through 2003, but there are many more observa-tions after 1999. After cleaning, we are left with 21,746 observaobserva-tions with positive values for all the factor inputs. The results are robust to conditioning on three con-tinuous time series observations per firm but are weaker if we start conditioning on many more observations as we induce increasing amounts of selection bias.
There are many small and medium-sized establishments in our sample23—the median establishment employs 238 workers. The establishments are larger than average for the UK economy because the sampling frames for the ABI and, in par-ticular, the IT surveys, deliberately oversample larger units. We did not find evidence that this causes any sample selection bias for a comparison of US multinationals to non-US multinationals.24 Average IT capital is about 1 percent of gross output at the unweighted mean (1.5 percent if weighted by size) or 3 percent of value added. These estimates are similar to the UK economywide means in Basu et al. (2003).
We have large numbers of multinational establishments in the sample. We can identify ownership using the Annual Foreign Direct Investment registry, which we also use to identify takeovers (from changes in ownership). About 8 percent of the establishments are US owned, 31 percent are owned by non-US multinationals, and 61 percent are purely domestic. Multinationals’ share of employment is even higher, and their share of output higher still. Table 1 presents some descriptive statistics
23 Online Table A2 sets out the basic summary statistics of the sample.
24 See Section A8 in online Appendix A. There was some evidence that response rates were lower for small domestic firms, however, suggesting we have a disproportionate number of the larger domestic firms. Since these larger establishments are likely to be more productive, it will be harder to reject our hypothesis that domestic establishments have lower productivity than multinationals. Nevertheless, we are more confident in the comparison within the multinational set (i.e., US versus non-US) than between multinationals and domestic establishments.
Table 1—UK Descriptive Statistics Broken Down by Multinational Status
(normalized to 100 for the 3-digit SIC and year average)
Employment
Value added per employee
Gross output per employee
Non-IT capital per employee
Materials per employee
IT capital per employee US multinationals
Mean 162.26 127.96 123.63 129.61 123.81 152.13
Standard deviation 297.58 163.17 104.81 133.91 123.35 234.41
Observations 569 569 569 569 569 569
Other multinationals
Mean 148.58 113.71 115.22 120.65 116.02 119.58
Standard deviation 246.35 107.87 86.50 126.83 107.63 180.34
Observations 2,119 2,119 2,119 2,119 2,119 2,119
UK domestic
Mean 68.78 89.86 89.69 86.33 89.29 83.95
Standard deviation 137.72 104.50 102.09 127.16 129.37 188.30
Observations 4,433 4,433 4,433 4,433 4,433 4,433
Note: These are 2001 values from our sample of 7,121 establishments in the UK data (ABI matched with IT data from QICE, BSCI, and FAR).
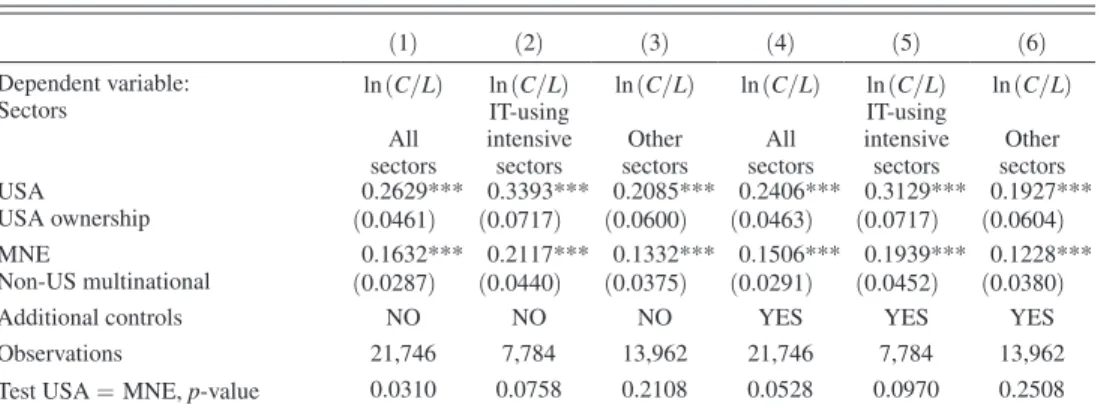
for the different types of ownership, all relative to the three-digit industry aver-age. Labor productivity, as measured by output per employee, is 24 percent higher than average for US multinational establishments and 15 percent higher than aver-age for non-US multinational establishments. This suggests a 9 percentaver-age point productivity premium for US establishments as compared to other multinationals. But US establishments also look systematically larger and more intensive in their non-labor input usage than other multinationals. US establishments have 14 percent-age points more employees, use about 8 percentpercent-age points more intermediate inputs per employee, and 9 percentage points more non-IT capital per employee than other multinationals. Most interesting for our purposes, though, the largest gap in factor intensity is for IT: US establishments are 32 percentage points more IT intensive than other multinationals. Hence, establishments owned by US multinationals are notably more IT intensive than other multinationals in the same industry.
III. Results from the UK Establishment Panel A. Main Results
In Table 2 we examine the output elasticity of IT in the standard production function framework described in Section II (these are all different implementations of equation (4)). Column 1 estimates the basic production function, including dummy variables for whether or not the plant is owned by a US multinational (“USA”) or a non-US multi-national (“MNE”) with domestic establishments being the omitted base. US establish-ments are 7.1 percent more productive than UK domestic establishestablish-ments, and non-US multinationals are 3.9 percent more productive. This 3.2 percent (= 0.0712 − 0.0392) difference between the US and non-US multinationals coefficients is also significant at the 5 percent level (p-value = 0.021) as reported at the base of the column.25
The second column of Table 2 includes the IT capital measure. This enters positively and significantly and reduces the coefficients on the ownership dum-mies. US establishments are more IT intensive than other establishments, but this accounts for only about 0.2 percentage points of the initial 3.2 percent pro-ductivity gap between US and non-US multinational establishments. Column 3 includes two interaction terms: one between IT capital and the US multinational dummy, and the other between IT capital and the non-US multinational dummy. These turn out to be very revealing. The interaction between the US dummy and IT capital is positive and significant at conventional levels. According to col-umn 3, doubling the IT stock is associated with an increase in productivity of 6.3 percent (= 0.0428 + 0.0202) for a US multinational but only 4.6 percent (= 0.0428 + 0.0036) for a non-US multinational. Note that non-US multination-als are not significantly different from domestic UK establishments in this respect: we cannot reject the possibility that the coefficients on IT are equal for domestic UK establishments and non-US multinationals. It is the US establishments that are distinctly different. The reported US × ln(C/L) interaction tests for significant
25 This implies that about two-thirds (6 percentage points of the 9 percentage point gap) of the observed labor productivity gap between US and other multinationals shown in Table 1 can be accounted for by our observables, such as greater non-IT capital intensity in the US establishments, but a significant gap remains.
differences in the output-IT elasticity between US multinationals and UK domes-tic establishments. The key test, however, is whether the IT coefficient for US multinationals is significantly different from the IT coefficient for other multi-nationals. The row at the bottom of Table 3 reports the p-value of tests on the equality between the US × ln(C/L) and the MNE × ln(C/L) coefficient (i.e., H0: αC , USA= αC , MNE), showing that the coefficients are significantly different at the 5 percent level.
To investigate the industries that appear to account for the major-ity of the productivmajor-ity acceleration in the United States we split the sam-ple into “IT using intensive sectors” in column 4 and “Other sectors” in column 5. Sectors that use IT intensively account for most of the US pro-ductivity growth between 1995 and 2003. These include retail, wholesale, business services, and high-tech manufacturing like printing/publishing. The US interaction with IT capital is much stronger in the IT-using sectors, and it is not significantly different from zero in the other sectors (even though we
Table 2—Estimates of the UK Production Function Allowing the IT Coefficient to Differ by Ownership Status
ln (Q/L) ln (Q/L) ln (Q/L) ln (Q/L) ln (Q/L) ln(Q/L) ln (Q/L) ln (Q/L)
Dependent variable: (1) (2) (3) (4) (5) (6) (7) (8)
Sectors sectorsAll sectorsAll sectorsAll
IT using intensive
sectors sectorsOther sectorsAll
IT using intensive
sectors sectorsOther
Fixed effects NO NO NO NO NO YES YES YES
USA × ln (C/L) 0.0202*** 0.0380*** 0.0120 0.0093 0.0368***−0.0060 USA ownership × IT capital
per employee (0.0072) (0.0128) (0.0084) (0.0085) (0.0144) (0.0098)
MNE × ln (C/L) 0.0036 −0.0011 0.0062 0.0010 −0.0003 0.0008
Non-US multinational × IT
capital per employee (0.0045) (0.0062) (0.0060) (0.0042) (0.0064) (0.0053) ln (C/L) 0.0457*** 0.0428*** 0.0373*** 0.0457*** 0.0152*** 0.0123** 0.0157*** IT capital per employee (0.0024) (0.0029) (0.0038) (0.0039) (0.0030) (0.0051) (0.0036)
ln (M/L) 0.5575*** 0.5474*** 0.5477*** 0.6216*** 0.5067*** 0.4031*** 0.5018*** 0.3606*** Materials per employee (0.0084) (0.0083) (0.0083) (0.0142) (0.0104) (0.0178) (0.0279) (0.0210)
ln (K/L) 0.1388*** 0.1268*** 0.1268*** 0.1106*** 0.1459*** 0.0900*** 0.1056*** 0.0666*** Non-IT capital per employee (0.0071) (0.0068) (0.0068) (0.0093) (0.0092) (0.0159) (0.0228) (0.0209)
ln (L) −0.0052* −0.0112***−0.0111***−0.0094** −0.0121***−0.1986***−0.1279***−0.2466*** Labor (0.0027) (0.0027) (0.0027) (0.0037) (0.0036) (0.0217) (0.0319) (0.0279)
USA 0.0711*** 0.0641*** 0.0733*** 0.0440** 0.0892*** 0.0214 0.0451 −0.0070 USA ownership (0.0140) (0.0135) (0.0144) (0.0213) (0.0189) (0.0224) (0.0366) (0.0242)
MNE 0.0392*** 0.0339*** 0.0372*** 0.0149 0.0441*** 0.0081 0.0173 −0.0008 Non-US multinational (0.0079) (0.0078) (0.0093) (0.0134) (0.0124) (0.0103) (0.0172) (0.0126)
Observations 21,746 21,746 21,746 7,784 13,962 21,746 7,784 13,962
Test USA × ln (C/L) = MNE
× ln (C/L), p-value 0.0320 0.0035 0.5272 0.3622 0.0094 0.5210
Test USA = MNE, p-value 0.0206 0.0232 0.0113 0.1755 0.0151 0.5545 0.4301 0.8145
Notes: The dependent variable in all columns is the log of gross output per employee. The time period is 1995–2003. The estimation method in all columns is OLS. Columns 6 to 8 include establishment-level fixed effects. Standard errors in brackets under coefficients in all columns are clustered by establishment (i.e., robust to heteroskedasticity and autocorrelation of unknown form). All columns include a full set of three-digit industry dummies interacted with a full set of time dummies and as additional controls: dummies for establishment age (interacted with a manu-facturing dummy), region, multiestablishment group (interacted with ownership type), and a dummy for IT survey. See online Table A1 for definition of IT using intensive sectors. “Test USA × ln(C/L) = MNE× ln(C/L)” is a test of whether the coefficient on USA × ln(C/L) is significantly different from the coefficient on MNE × ln(C/L), etc.
*** Significant at the 1 percent level.
** Significant at the 5 percent level.
have twice as many observations in those industries). The final three columns include a full set of establishment fixed effects. The earlier pattern of results is repeated; in particular, column 7 demonstrates that US establishments appear to have a significantly higher coefficient on their IT capital stocks than other
Table 3—Robustness Tests of the UK Production Function
(1) (2) (3) (4) (5) (6)
Experiment specificationBaseline addedValue All inputs interacted Alternative IT measure Full “translog” interactions EU and non-EU MNEs Dependent variable: ln (Q/L) ln (VA/L) ln (Q/L) ln (Q/L) ln (Q/L) ln (Q/L)
USA × ln (C/L) 0.0368** 0.0681** 0.0328** 0.0672** 0.0334** 0.0376*** USA ownership × IT capital per employee (0.0144) (0.0319) (0.0141) (0.0258) (0.0140) (0.0145)
MNE × ln (C/L) −0.0003 −0.0179 0.0002 0.0070 −0.0012
Non-US multinational × IT capital per employee (0.0064) (0.0166) (0.0065) (0.0126) (0.0062)
Ln (C/L) 0.0123** 0.0290*** 0.0126** 0.0262*** 0.0330 0.0120**
IT capital per employee (0.0051) (0.0110) (0.0050) (0.0082) (0.0460) (0.0051)
USA × ln (M/L) 0.0334
USA ownership × materials per employee (0.0376)
MNE × ln (M/L) 0.0080
Non-US multinational × materials per employee (0.0236)
USA × ln (K/L) 0.0241
USA ownership × non-IT capital per employee (0.0368)
MNE × ln (K/L) −0.0142
Non-US × non-IT capital per employee (0.0134)
EU MNE 0.0063
EU ownership (0.0198)
Non-EU MNE −0.0603
Non-EU-non-USA ownership (0.0489)
EU MNE × ln (C/L) 0.0016
EU ownership × IT capital per employee (0.0064)
Non-EU MNE × ln (C/L) −0.0140
Non-EU-non-USA × IT capital per employee (0.0157)
Observations 7,784 7,784 7,784 2,155 7,784 7,784
Test USA × ln (C)= MNE × ln (C), p-value 0.0094 0.0103 0.0224 0.0216 0.0138
Test USA = MNE, p-value 0.4301 0.9638 0.3620 0.2244 0.3852
Test on joint significance of all the interaction
terms, excluding IT interactions (p-value) 0.3752
Test on joint significance of all the US interaction
terms, excluding IT per employee (p-value) 0.6216
Test on all the other MNE’s interaction terms,
excluding IT per employee (p-value) 0.2723
Test on additional “translog” terms, p-value 0.0000
Test USA = EU, p-value 0.3216
Test USA = non-EU, p-value 0.0815
Test [USA × ln (C/L)]=[EU × ln (C/L)], p-value
0.0120 Test [USA × ln(C/L)]=[non-EU × ln (C/L)],
p-value
0.0123
Notes: The dependent variable in all columns is the log of gross output per employee, except (2) which is value-added per employee. All columns are for only the sectors that use IT intensively (see online Appendix A1). The time period is 1995–2003. The estimation method is OLS. All columns also include (the log of) non-IT capital per worker
(K/L), materials per worker (M/L) and labor (L). All columns except 4 include establishment fixed effects. Standard errors in brackets under coefficients are clustered by establishment (i.e., robust to heteroskedasticity and autocor-relation of unknown form). All columns include a full set of three-digit industry dummies interacted with a full set of time dummies and as additional controls: dummies for establishment age (interacted with a manufacturing sector dummy), region, multiestablishment group (interacted with ownership type), and IT survey (except column 4). The IT measure in column 4 is the ln(fraction of workers using computers). Column 5 includes all the pairwise interac-tions of materials, labor, IT capital, and non-IT capital, and the square of each of these factors. “Test USA × ln (C/L) =MNE × ln (C/L)” is a test of whether the coefficient on USA × ln (C/L) is significantly different from the coef-ficient on MNE × ln (C/L), etc.
*** Significant at the 1 percent level.
** Significant at the 5 percent level.
multinationals (and domestic firms).26 A doubling of the IT capital stock is associ-ated with 1.2 percent higher productivity for a domestic or non-US multinational, but 4.9 percent higher productivity for an establishment owned by a US multinational.27
Quantification.—The results in column 7 of Table 2 report a US coefficient on IT capital stock that is about 3.7 percent higher than for domestic firms or non-US multinationals. Given that IT intensity over the period of 1995 to 2004 was rising at about 22 percent per year in both the US and EU (Timmer and van Ark 2005), this implies a faster growth rate of labor productivity of US establishments in the IT-intensive sector of about 0.81 percentage points per year (= 0.22 × 3.7 percent). IT-intensive industries account for about half of aggregate employment so that this higher coefficient—if applied to the US economy—would imply that aggregate US labor productivity would rise at about 0.4 percent a year faster than in Europe (= 0.5 × 0.81) between 1995 and 2004. Since actual US labor productivity growth over this period was at least 0.8 percent higher than in Europe, this coefficient would suggest that about half of the US productivity miracle was related to the stronger relationship between productivity and IT in the US than in Europe.
B. Robustness Tests of the Production Function Results
Table 3 presents a series of tests showing the robustness of the main results—we focus on the fixed effects specification, which is the most demanding, and on the IT intensive sectors, which we have shown to be crucial in driving our result. The first column represents our baseline production function results from column 7 in Table 2. The results are similar if we use value-added-based specifications (see col-umn 2), so we stay with the more general specification using gross output as the dependent variable.
Transfer Pricing and Mark-Ups.—Since we are using multinational data, could transfer pricing be a reason for the results we obtain? If US firms shifted more of their accounting profits to the United Kingdom than other multinationals this could cause us to overestimate their productivity. But this would suggest that the factor coefficients on other inputs, particularly on materials, would also be systematically different for US establishments (see the discussion on establishment-specific prices above). To test this, column 3 estimates the production function with a full set of interactions between the US multinational dummy and all the factor inputs (and the non-US multinational dummy and all the factor inputs). None of the additional non-IT factor input interac-tions are individually significant, and the joint test at the bottom of the column of the additional interactions shows that they are jointly insignificant.28 We cannot reject the
26 We were also concerned that the IT interaction could be driven by the presence of labor in the denominator of both the dependent variable and the interaction, so we reestimated without normalizing any of the variables by labor. The US interaction with IT was still significantly different from the non-US multinational interaction with IT
(p-value = 0.040). See also the results in Bloom, Sadun, and Van Reenen (2007).
27 At the overall sample mean of IT intensity, the implied productivity premium of US multinationals over non-US multinationals is 2.6 percent, but this rises to 5.0 percent when evaluated at the IT intensity of the average non-US multinational establishment.
specification of equation (4) in column 1 of Table 3 as a good representation of the data versus the more general interactive models of column 3.29 This experiment also rejects the general idea that the productivity advantage of the United States is attribut-able to differential mark-ups, because then we would expect to see significantly differ-ent coefficidiffer-ents on all the factor inputs, not just on the IT variable.
As a second test of differential mark-ups we follow Klette and Griliches (1996) and De Loecker (2007) by controlling for four-digit industry output (disaggregated by ownership type). The estimated mark-ups (inverse elasticities of demand) were significantly higher for multinationals than domestic firms, but the US multination-als did not have significantly higher mark-ups than nonmultinationmultination-als (p-value of difference = 0.404). More importantly, the US IT coefficient remained significantly greater than the non-US multinational coefficient (p-value of difference = 0.010).30
Mismeasurement of IT Capital Stock?—One concern is that we may be underes-timating the true IT stock of US multinationals and this could generate a positive coefficient on the interaction term, because of greater measurement error for the US establishments. For example, US multinationals may pay lower prices for IT than non-US multinationals. To tackle this issue we turn to an alternative IT survey (the E-commerce Survey, see online Appendix A) that has data on the proportion of work-ers in the establishment who are using computwork-ers. This is a pure “stock” measure so it is unaffected by the initial conditions concern.31 In column 4 we replace our IT capital stock measure with a measure of the proportion of workers using a computer. Reassuringly, we still find a positive and significant coefficient on the US interaction with computer usage.
Functional Forms.—We tried including a much broader set of interactions and higher order terms (a “translog” specification), but these were generally individually insignificant. Column 5 shows the results of including all the pairwise interactions of materials, labor, IT capital, and non-IT capital and the square of each of these factors. The additional terms are jointly significant, but the key US interaction with the IT term remains basically unchanged (it falls slightly from 0.0368 in the baseline specification to 0.0334) and remains significant.
Stronger Selection Effects for US Multinationals because of Greater distance from the UK?—A further issue is that US firms may be more productive in the United Kingdom because the United States is geographically further away than the average non-US multinational (in our data most foreign multinationals are European if they are not American). This would generate a strong US selection bias if only 29 The p-value = 0.38 on this test. We also investigated whether the coefficients in the production function regressions differ by ownership type and sector (IT intensive or not). Running the six separate regressions (three ownership types by two sectors) we found that the F-test rejected at the 1 percent level the pooling of the US mul-tinationals with the other firms in the IT-intensive sectors. In the non–IT-intensive sectors, by contrast, the pooling restrictions were not rejected. Details are available from the authors on request.
30 See online Appendix Table A7.
31 The initial conditions concern is that our estimate of the initial IT capital stock could be systematically incor-rect for US multinationals relative to other multinationals. Our IT capital stock measure is theoretically more appropriate as it is built analogously to the non-IT stock and is comparable to best practice existing work. The E-Commerce Survey is available for three years (2001 to 2003), but the vast majority of the sample is observed only for one period, so we do not control for fixed effects.