ANNOTATION OF THE UNDERSTUDIED KINOME AND PRELIMINARY TESETING OF KINASE INHIBITOR COMBINATIONS
Claire Reisig Hall
A thesis submitted to the faculty at the University of North Carolina at Chapel Hill in partial fulfillment of the requirements for the degree of Master of Science in the Joint Program of Biomedical Engineering in
the School of Medicine.
Chapel Hill 2017
ABSTRACT
Claire Reisig Hall: Annotation of the Understudied Kinome and Preliminary Testing of Kinase Inhibitor Combinations
(Under the direction of Shawn Gomez)
A technique utilizing multiplexed inhibitor beads and mass spectrometry (MIB/MS) detects functional protein kinases in breast cancer cell lines. Data from this technique was used to shed light on the understudied kinome, a portion of which is captured by the MIB/MS method. Regression analysis was performed to find correlations in kinase activity. The functional linkages were then used to annotate the understudied kinases. Annotations revealed new possible functions and disease relations for many understudied kinases.
TABLE OF CONTENTS
LIST OF TABLES ... vi
LIST OF FIGURES ... vii
INTRODUCTION ... 1
Cancer and treatment ...1
Protein kinases and inhibitors ...2
Understudied kinases ...3
Multiplexed inhibitor beads/mass spectrometry ...4
Goals ...5
CHAPTER 1: REGRESSION AND ANNOTATION ... 6
Introduction ...6
Regression ...7
Annotation ...9
Results and discussion ...10
ADCK1 ...11
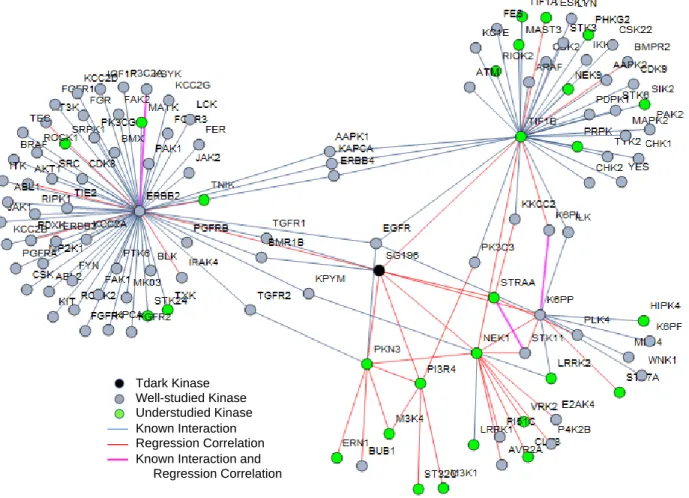
SG196 ...12
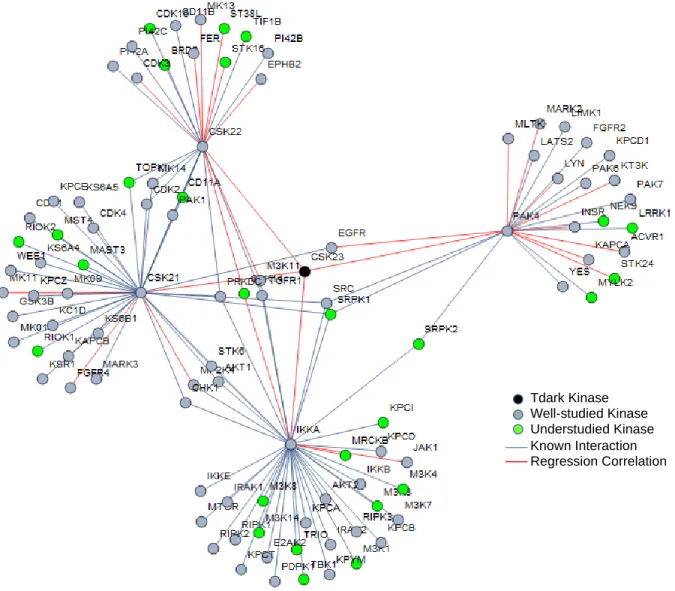
CSK23 ...13
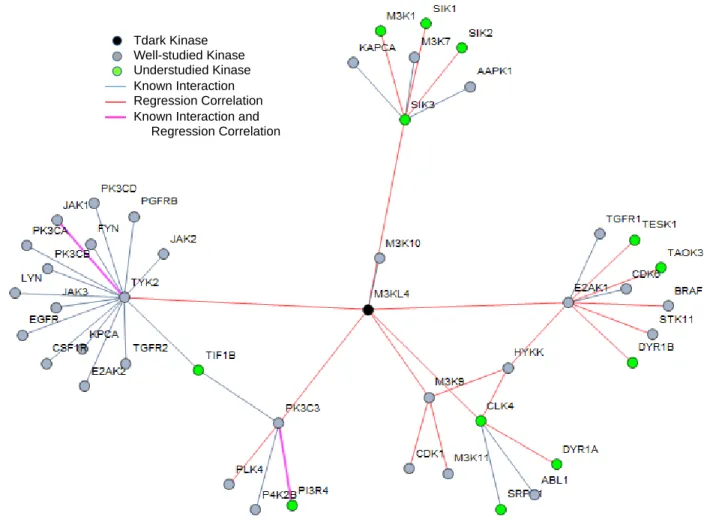
M3KL4 ...14
Conclusions ...15
CHAPTER 2: KINASE INHIBITOR COMBINATIONS ... 16
Methods ...17
Results and discussion ...18
Conclusions ...20
FIGURES AND TABLES ... 22
LIST OF TABLES
LIST OF FIGURES
Figure 1. Overlay of understudied kinases on phylogenetic kinome tree ... 22
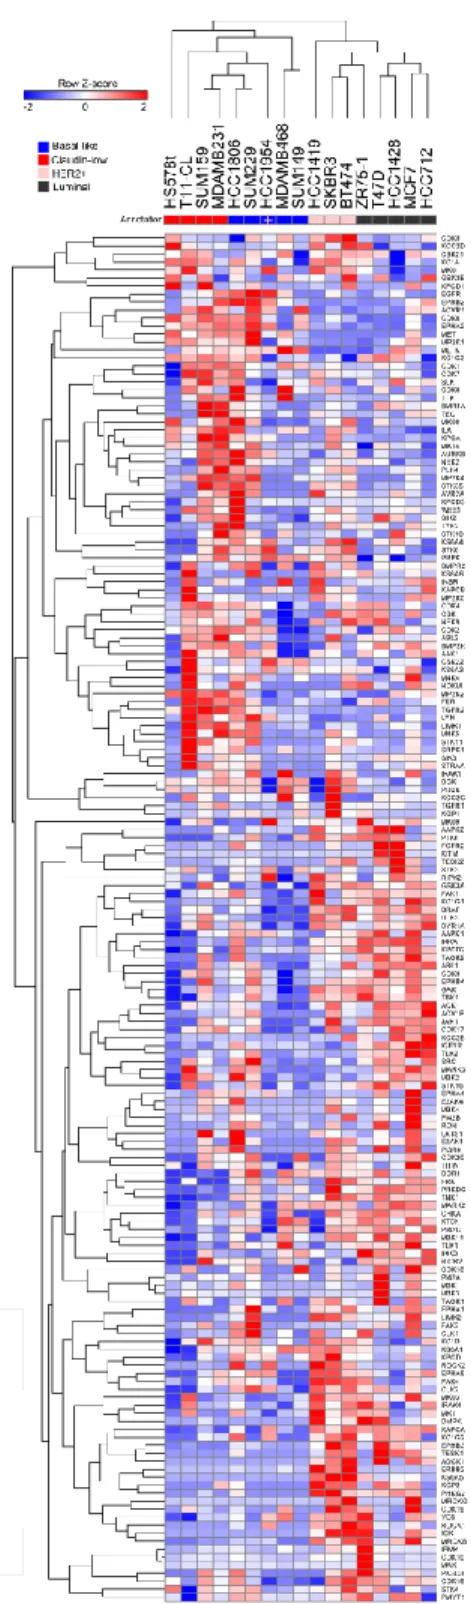
Figure 2. Heat map of normalized MIB/MS data ... 23
Figure 3. Flowchart of methods for lasso regression and annotations... 24
Figure 4. List of annotations occuring most frequently for understudied kinases ... 26
Figure 5. Subnetwork for ADCK1 ... 27
Figure 6. Subnetwork for SG196 ... 28
Figure 7. Subnetwork for CSK23 ... 29
Figure 8. Subnetwork for M3KL4 ... 30
Figure 8. PCA plot of kinome changes in MIB/MS data of treated breast cancer cell lines ... 31
Figure 10. Ideal dose curve and ideal growth assay ... 32
Figure 11. Dose curves for calculating IC30’s used in initial growth assay ... 33
Figure 12. First growth assay for Lapatinib, Dasatinib, Trametinib, and BEZ235 ... 34
Figure 13. Compilation of dose curves for BEZ235, Dasatinib, and Trametinib ... 35
INTRODUCTION Cancer and treatment
Cancer, a widespread and destructive disease with over 100 different types, is the second highest cause of death in the United States [1]. Breast cancer is the most common type of cancer, and is predicted to occur in over 250,000 new cases throughout the year 2017 [1]. For women, breast cancer has the second highest death rate behind lung cancer, meriting further research for understanding and treating the disease [1]. Breast cancer is separated into subgroups, emphasizing the heterogeneity of this type of cancer. Subsequently, treatment is also heterogeneous, depending on the subtype and progression of the disease. From a clinical standpoint the subtypes are divided into luminal (further subdivided into luminal A and luminal B), HER2-enriched, and triple-negative [2]. These three major subtypes are classified via the presence or absence of three receptors, estrogen (ER), progesterone (PR) and human epidermal growth factor receptor 2 (HER2) [2]. Localized treatments include surgery and radiation therapy. Systemic treatments are composed of drugs which circulate throughout the body via the bloodstream. These treatments include chemotherapy, hormone therapy, or targeted therapy, and are often dependent on subtype. Commonly, a combination of localized treatments and systemic treatments is used for combating breast cancer.
the cancer cells thus minimize the side effects, but the available targets are dependent on the presence of receptors, and consequently, the subtype of breast cancer. The luminal subgroup of cancer has at least one of the ER or PR receptors present and therefore hormone therapy is an effective form of treatment. Hormone therapy inhibits the production or reception of hormone molecules, resulting in signal cascades within the cell causing cell cycle arrest or apoptosis. The luminal subtype has the most optimistic prognosis [2]. HER2-enriched subtypes are also able to be targeted. Drugs that target the HER2-enriched subtype, in most cases, competitively inhibit the binding site or activation site on the HER2 receptor. [3]. This again causes signaling within the cell to halt cell growth and/or begin apoptosis. The HER2-enriched subtype has a somewhat poorer prognosis than the luminal subtype primarily due to higher rates of recurrence [2]. Triple-negative breast cancers do not express the ER, PR, or HER2
receptors. Due to the lack of these receptors, no targeted therapies are currently FDA approved for triple-negative types of breast cancer, contributing to the very poor prognosis for this subgroup [3,2].
Protein kinases and inhibitors
One approach to targeted therapy of HER2-enriched breast cancer is through the use of a HER2 kinase inhibitor. HER2, also known as ERBB2, is a receptor tyrosine kinase [3]. Kinases are proteins heavily involved in signal transduction by means of phosphorylating substrate proteins. By
by inhibition. Kinase inhibitors can affect a large range of kinases, spanning from very selective, targeting only a select few kinases, to broadly inhibiting many kinases. Those which hit broadly are known to be more toxic in clinical settings, while those having a limited set of targets are generally more tolerable. Despite these treatment options, the cell can redirect signaling through the kinome to circumvent the effects of the drug, referred to as reprogramming, and can result in drug resistant cancers [5]. Resistance can occur through different mechanisms, those that involve the kinome are generally a signaling pathway being reactivated via bypassing, parallel signaling, feedback reactivation or loss of negative feedback [6]. Other forms of resistance stem from the heterogeneity of cancers, not all cells in a tumor express the same proteins or kinases making it more difficult to kill all cancer cells with only one type of drug. Chemotherapies and targeted therapies that work initially may lose effectiveness due to heterogeneity or reprogramming of the kinome. Drugs with multiple targets, or drugs used in unison to attack multiple targets, may also fail due to the kinome’s ability to reprogram.
Understudied kinases
Of over 500 known protein kinases, up to half could be considered understudied depending on the set of criteria used. Multiple elements are used in defining a kinase as having an understudied, or untargeted, status. A definition set by Dr. Gary Johnson and collaborators at UNC-Chapel Hill designates 229 protein kinases as being understudied due to lack of confirmed function, lack of disease and
pharmacology association, and absence of direct biological tools to explore the kinase’s function
experimentally [7]. Figure 1 depicts an overlay of the understudied kinases on a phylogenetic tree of the kinome. This gives a visualization of how the understudied kinases are spread throughout the kinome, spanning all different kinase families.
different criteria, some of which correspond with understudied kinases. IDG classifies 31 kinases as Tdark due to the limited information available about them, including lack of publication, small molecule inhibitors, and gene references to functionality [8]. The program labels 163 kinases as Tbio, which means these kinases have more known of their function or phenotype than Tdark proteins but still do not have small molecules or drugs that adequately target them [8]. Tclin is composed of kinases known to be involved in disease and that are targeted by at least one FDA approved drug. Tchem kinases have small molecule inhibitors available which target them and have documented functional studies
concerning involvement in diseases [8]. The Tdark and Tbio categories along with the 229 understudied kinases defined by the Johnson lab will be explored further in this study as more needs to be understood about their function in the kinome and in disease states.
Multiplexed inhibitor beads/mass spectrometry
Commonly, protein presence is determined from gene expression profiling. However, this method can be misleading in the context of functioning or activated proteins, as is the case for kinases [9]. In this case, characterization of the level and activation state of proteins in the cell through
different kinase inhibitors. The system, called multiplexed inhibitor beads (MIB), extract functional kinases by binding them to the specific inhibitors, which are then distinguished using mass spectrometry (MS) [11]. By utilizing a specific combination of kinase inhibitors, over 360 different kinases are
captured by the beads. Goals
The aim of this investigation was to uncover functional linkages and associated annotation between understudied kinases from data acquired though MIB/MS. In this work, the MIB/MS method gives a picture of the functional kinases present in normally cultured breast cancer cells, unperturbed by drugs, with a portion being kinases whose roles in the kinome are not fully known. To utilize this data and shed light on the understudied kinome, regression analysis was performed to find correlations in kinase activity. Regression correlations were used to provide annotations for understudied, Tdark, and Tbio kinases. Annotations revealed new possible functions for many kinases and also matched previously known annotations for some kinases.
Secondly, kinase inhibitor combinations suggested by principle components analysis (PCA) results performed on MIB/MS data from treated breast cancer cell lines were preliminarily tested for signs of effectiveness. This would be an improvement on current methods of choosing kinase inhibitor combinations, which show promise for cancer treatment. Dose curves and growth assays were performed to compare drug combinations in the SKBR3 cell line. The interpretation of in vitro
CHAPTER 1: REGRESSION AND ANNOTATION Introduction
To investigate the function and disease relation of understudied kinases, the MIB/MS method was used to collect functional kinase data from 15 different breast cancer cell lines, with 2 or 3 replicate samples of each. These cell lines were untreated and covered the three subtypes of breast cancer, luminal, HER2-enriched, and triple-negative. Of the 360 kinases detected by MIB/MS, 254 passed filtering for adequate presence in samples. This represents approximately 70% of the kinases expressed in breast cancer, with 89 of the captured kinases being understudied, Tbio, and/or Tdark [7]. A small portion of this raw data can be seen in Table 1, with each column being a specific cell line and the rows being the MIB/MS value for the corresponding kinase. A full representation of this data is portrayed in Figure 2 as a heat map, showing the data after normalization. Each column is an average of the replicates of the 15 different breast cancer cell lines. Each row is one of the 254 kinases which passed filtering. The color represents the relative MIB/MS value for each specific kinase in each cell line with blue being minimum values and red maximum values.
A key part of understanding all kinases’ functions is to learn the interactions connecting them in the signaling network. Although not all kinase interactions are known, those documented in online databases were collected [7]. Protein-protein interactions involving kinases were acquired from HIPPIE, I2D, PhosphoSitePlus, and Reactome. From the compiled data, 53 of the understudied kinases have zero reported known interactions, and almost two-thirds have less than five known interactions.
interactions were used to annotate the understudied kinases, uncovering possible functions and relations to disease.
Regression
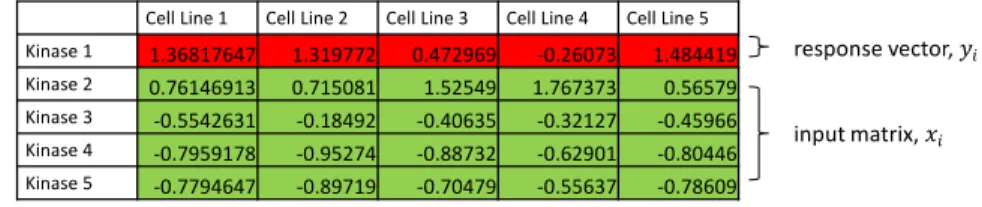
Regression analysis is used to create a model which estimates relations between variables. In this case, a single kinase’s MIB/MS data represents the dependent variable (response vector), while the
remaining kinase data composes the independent variables (input matrix). The goal of estimating the relationship between kinases is to find the kinases associated by similar functional presence as portrayed through the MIB/MS data. With a large set of data more than one viable relationship between the variables may exist. Therefore, regression models can lead to over or under-fitted equations that do not accurately portray associations between variables [12]. Another difficulty is the presence of multicollinearity, or a high correlation between a subset of independent variables [12].
Regression models have been developed to address the problems of multicollinearity and over-fitting by penalizing the coefficient sizes and regularization [12]. Common models include lasso, elastic net, and ridge regression. Differences lie in the penalties used by each model. Lasso (Least Absolute Shrinkage and Selection Operator) regression adds an L1 penalty, also referred to as L1 norm, which limits the coefficient sizes. The L1 penalty reduces some coefficients to zero, eliminating variables [13]. Ridge regression adds an L2 penalty reducing all coefficients by the same scale [13]. Elastic net
significance of those pose a greater issue when creating a regression model primarily for its predictive power. In this case, the primary goal of the regression model is to apply feature selection.
Using the glmnet package in R software, elastic net and lasso were tested on normalized MIBs/MS data. For both cases, the following equation was solved:
𝑚𝑖𝑛𝛽0,𝛽 1
𝑁∑ 𝑙
𝑁
𝑖=1 𝑤𝑙(𝑦𝑖, 𝛽0+ 𝛽𝑇𝑥𝑖) + 𝜆[
(1−𝛼)||𝛽||22
2 + 𝛼||𝛽||1] Equation 1. [13]
Where 𝑦𝑖 represents the vector of dependent variable data. Figure 3A contains an example array of
MIB/MS data, with the response vector, or 𝑦𝑖 highlighted in red. The matrix of independent variables
data forms 𝑥𝑖 and is highlighted in green in Figure 3A. In equation 1, the variableβ is the result matrix of
coefficients, highlighted yellow in Figure 3B. The equation is solved for a set of values for λ, the tuning parameter which controls the overall strength of the penalty [13]. The penalty appears in the brackets to the right of λ. The variable α controls the penalty in that an α of 1 performs a lasso regression while
an α of 0 performs a ridge regression [13]. An α of 1 imposes a penalty equal to the absolute value of
the magnitude of the coefficients. An α of 0 introduces a penalty equaling the square of the magnitude
of the coefficients. All values of α between 0 and 1 create a combination of both penalties for elastic net
regression. 𝑙(𝑦, 𝜂) is the log-likelihood function, Gaussian by default, 1
2(𝑦 − 𝜂)
2 [13].
elastic net was observed as expected, meaning all features in the lasso regression results were included in the elastic net regression results for each kinase. Because lasso regression produces the most concise number of features, it was executed on each of the 254 kinases in the dataset by iteration as depicted in Figure 3C.
Annotation
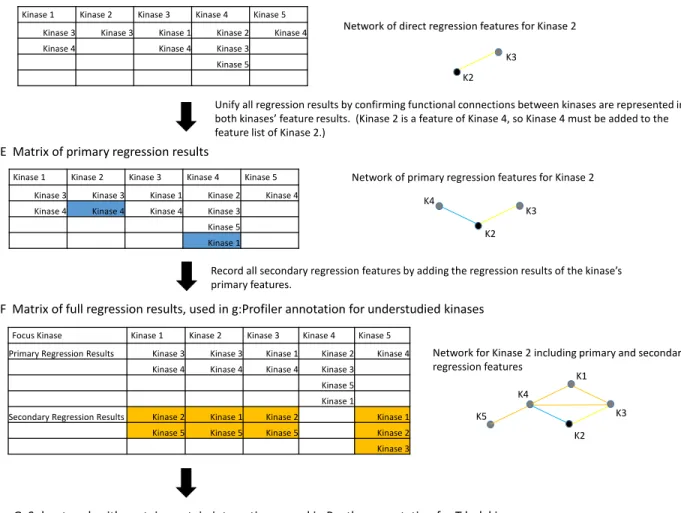
After finding the features for all kinases, annotation was desired for the understudied kinases as detailed previously. To evaluate functional enrichment of a specific kinase, a group around the kinase was created using the results of the regression correlations. The group for an understudied kinase consists of two parts. The first portion is the regression features of the focus kinase, an example can be seen in Figure 3D. By unifying regression results, the kinases in which the focus kinase was found as a regression feature are also included, portrayed in Figure 3E. These together are referred to as primary features. The second portion is composed of the primary feature kinases’ respective regression
features, referred to as secondary features, seen in Figure 3F. The group, formed of both primary and secondary features, was then entered into g:Profiler, an online server designed for analyzing sets of genes and providing gene ontology and pathway analysis/enrichment [15]. From the g:Profiler server, g:GOSt was used for evaluating enrichment tests. Databases used are GO, KEGG, Reactome, miRBase, TRANSFAC, CORUM, BioGRID, HPA, HPO, and OMIM [15]. Collectively, these resources represent molecular pathways, target sites of miRNAs, target sites of transcription factors, protein complexes, protein-protein interaction networks, protein expression data, and physiological and disease
background g:GOSt allows for the user to enter a unique background list of genes. This was tested by entering the full list of kinase protein genes. The relatively small groups being analyzed for each kinase against the full list of kinases resulted in very few significantly enriched functions. Instead, the default list of all human genes was used. This did produce redundant and non-specific enrichments pertaining to general kinase function, such as signal transduction. To avoid the majority of these non-helpful enrichments, only those found in the KEGG and Reactome pathways were further examined.
In a final step, protein-protein interactions were added to the primary features of the networks created for Tdark kinases, example in Figure 3G. The primary and secondary features along with any additional kinases associated by protein-protein interactions were entered into Panther for annotation. A list of 570 human kinase genes was used as a background list compared to the subnetworks of the Tdark kinases to find statistically overrepresented GO biological processes via Panther. Panther is based on a cumulation of phylogenetic trees which allows useful annotations to be made for inquiry genes based on functions of other associated genes [16]. The gene set overrepresentation tool utilizes these annotations made from phylogenetics along with functional annotations available from the Gene Ontology Consortium [17]. A binomial test is applied to determine statistical over or under representation.
Results and discussion
The results of each 254 kinase’s lasso regression can be found in the Supplemental Data File S5
from KEGG and Reactome found in all of the results. These varied in regards to specificity of molecular function, pathways, or broad associations with disease. Six kinases had no statistically enriched pathway annotations, and 23 had five or fewer annotations. Many of these kinases had groups of regression features saturated with other understudied kinases; therefore the g:Profiler annotation tool was unable to recognize enough kinases to achieve statistical significance in annotations. The average number of annotations per kinase was 41. The most number of annotations for any kinase was 193 for CDK14. Annotations occurring for more than 25 kinases are shown in Figure 4, for example the common MAPK signaling pathway was an annotation result in 43 of the 89 kinases. A brief portrayal of the range of annotations associated with many of the kinases can be viewed in Figure 4. Although it only represents 10% of the 363 different annotations, the combined frequencies, or total occurrence explained in Figure 4, cover almost 30% of the total annotations across all understudied kinases.
Despite the addition of kinases associated by protein-protein interactions to the Tdark subnetworks, the Panther annotation resulted in fewer statistically overrepresented functions due to the use of a kinase specific background list. There were 34 different annotations in the results for the four Tdark kinases. With ADCK1 having no annotations and SG196 having 24. To illustrate more in-depth results, four kinases from the Tdark category, present in the MIB/MS data, will be explored here.
ADCK1
Aarf domain containing kinase 1, ADCK1, is an understudied and Tdark kinase. Current Knowledge
Annotations via regression
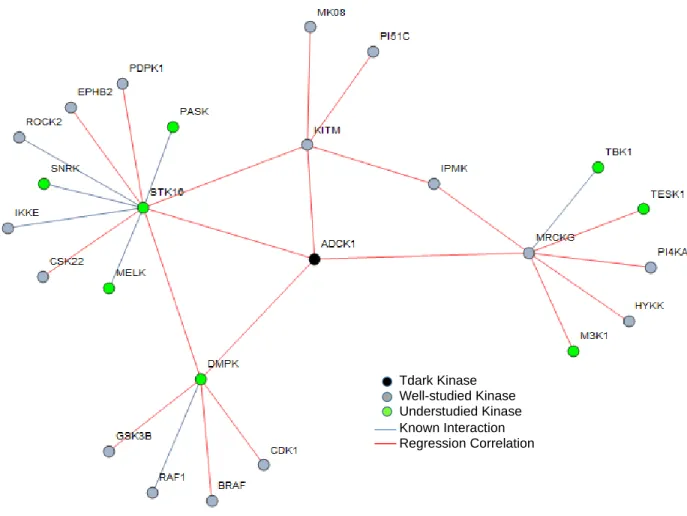
ADCK1 had four primary regression features, shown in Table 2, along with 16 second order regression correlations. This list of kinases was submitted to g:Profiler to uncover possible functional enrichment as discussed previously in the section. From GO’s biological process and molecular function sources both protein serine/threonine kinase activity and transferring phosphorous-containing groups were annotated matching those previously known from genecards. A visual of the connections for ADCK1 can be seen in Figure 5. This subnetwork includes the list of regression linkages for ADCK1 from Table 2 and the protein-protein interactions of ADCK1’s primary regression features. Additional
statistically enriched annotations were neurotrophin signaling, insulin signaling, ErbB signaling pathway, FCER1 signaling pathway, colorectal cancer, endometrial cancer, prostate cancer, and the M phase of the cell cycle. Panther annotation was performed on the full subnetwork list compared against the background list of 570 human protein kinases. No statistically enriched annotations were uncovered. ADCK1’s subnetwork illustrates the sparse knowledge of kinase interactions. Many of the regression
correlations are with other understudied kinases. This demonstrates the difficulty in annotating kinases when so little is known about them and the kinases they are linked to.
SG196
Another Tdark kinase also falling in the understudied category is SG196, Sugen kinase 196 or Protein O-mannose kinase.
Current Knowledge
interactions with proteins TGFR1 and BMR1B. Annotations via regression
This kinase had seven primary regression features and 30 second order correlations, listed in Table 2. These linkages can be seen in Figure 6, along with known interactions of SG196 and its primary regression features. Significantly enriched in the regression features g:Profiler annotation were
different aspects of metabolism, and various signaling pathways, such as: toll-like receptor, insulin, AMPK, IGF1R,PKB-mediated, and PI3K-Akt. In agreement, ERBB2, a SG196 regression feature, dimerizes with other ERBB kinase proteins to form receptors involved in the PI3K-Akt pathway. SG196 has only two known interactions, which in turn have known interactions with ERBB2. Overlap of a known protein-protein interaction and a regression linkage between the same kinases, such as between K6PP and K6PL, is seen in SG196’s subnetwork (Figure 6). Both of these proteins are involved in glycolysis [18]. Entrez suggests K6PP has a role in cancer via metabolic reprogramming [18]. A specific g:Profiler annotation for SG196 is central carbon metabolism in cancer.
Panther annotation was performed on the list of regression features and protein-protein interactions involved in SG196’s subnetwork. The resulting statistically overrepresented biological
processes include ERBB signaling, MAPK signaling, and cellular response to stimulus. CSK23
Also seen in Table 2 is Tdark kinase CSK23, Casein kinase II subunit alpha 3. Current Knowledge
Annotations via regression
The kinase’s four primary regression linkages and 22 secondary feature linkages are listed in Table 2. Although CSK23 had no direct known interactions, an additional 80 proteins were added to its subnetwork seen in Figure 7 via protein interactions with primary regression features. Through
regression features, Wnt signaling was statistically overrepresented for CSK23 as was mentioned in its current knowledge above. Other annotations were toll-like receptor, Ras, PI3K-Akt, and TNF signaling pathways. Genecards reports the paralog gene for CSK23 to be CSK21, which is also a primary
regression feature. Both g:Profiler and Panther annotations showed NF-kappa B signaling as overrepresented along with immune related functions. Both methods also had statistical
overrepresentation in regulation of gene expression and condensation of prometaphase chromosomes which correlate to casein kinase’s involvement with DNA repair and cell cycle.
M3KL4
M3KL4 is a Tdark kinase, also known as MLK4, MAP3K21, or Mitogen-activated protein kinase kinase kinase 21.
Current Knowledge
M3KL4 has only one known protein interaction with M3K10 and is reported via Genecards to be a paralog of M3K9. The only annotations associated with M3KL4 currently are negative regulation of TLR4 signaling and non-activation of Jnk1/MAPK8 pathway, p38/MAPK14, or ERK2/MAPK21 [18].
Annotations via regression
The regression features include six primary, 18 secondary connections, and 25 protein-protein interactions. The regression features of M3KL4 are seen in Table 2 and its subnetwork is shown in Figure 8. Panther and g:Profiler annotations revealed connections with MAPK pathways and immune system functions. Other regression feature annotations were insulin signaling and synthesis of
regression, relating to the paralog connection stated from Genecards. Conclusions
The ability to effectively understand and then perturb the kinome via targeted therapies is a promising and favorable route for cancer treatment. To do this, more information concerning understudied kinases and the intricate signaling pathways of the kinome is necessary. Functional presence of kinases involved in breast cancer was measured via MIB/MS methods for 32 samples of cell lines. Lasso regression was performed on these data as a succinct feature selection tool to find
functional linkages between kinases. These linkages were then used in an online annotation tool, g:Profiler, to find statistically overrepresented functions, pathways, and involvement in disease for understudied kinases present in the data. The annotations were compiled to give better understanding and access to the results. Additionally, known protein-protein interactions were added to the functional networks of four Tdark kinases. The list of kinases in the subnetworks was used for annotation in Panther, compared against a list of 570 human kinases, to uncover statistically overrepresented GO biological functions. This method showed correlation with annotations made from g:Profiler and with the few previously reported functions and annotations for the Tdark kinases.
Overall the associated gene ontology annotations previously known for understudied kinases, concerning serine, threonine, or tyrosine kinase activity and transferase activity were consistently matched by the annotations performed with regression features. After examining details of four Tdark kinases’ results and comparing known interactions, functions and previously made annotations, there
are positive indications that the regression linkages and annotations are functionally relevant and can be valuable in further exploration. Commonalities also existed when considering known protein
interactions associated with the Tdark kinases’ regression features. New statistically significant
CHAPTER 2: KINASE INHIBITOR COMBINATIONS Introduction
Targeting cancers with drug combinations using kinase inhibitors is thought to increase efficacy of treatment and reduce likelihood of reprogramming of the kinome. Current methods of choosing drug combinations select a second drug based in its ability to target the upregulated kinases after
perturbation from an initial drug [19]. This trial and error method of choosing drug combinations is inefficient and can be improved upon by using a more direct approach along with proteomic data instead of genomic data.
NVP-BEZ235 and Dactolisib. BEZ235 has been reported as a highly toxic and non-effective drug in renal cell carcinoma, but has been indicated by research as a possible combination treatment breast cancer [21, 22]. BEZ235 targets PI3K and mTOR kinases [20]. GSK1120212 (Trametinib) altered a similar set of kinases to BEZ235, albeit less strongly, on the PC1 axis. Trametinib is a low toxicity drug, targeting MEK1 (MAP2K1) and MEK2 (MAP2K2) [20]. It is an approved treatment for melanoma and non-small cell lung cancer. These four drugs were focused on to provide a proof of concept experiment as they portrayed the clearest changes in kinome signatures compared to control samples.
Using MIB/MS and then PCA on treated samples could reveal optimal drug combinations by highlighting which inhibitors change the functional kinome in the strongest and most dynamic way. In this case Lapatinib and BEZ235 are thought to be an effective drug combination based on results in Figure 9. Experiments were performed using the same breast cancer cell line, HER2-enriched SKBR3, and kinase inhibitors Lapatinib, Dasatinib, BEZ235, and Trametinib. Dose curves and growth curves were performed to evaluate the possible combinations of these drugs on SKBR3 cells.
Methods
performed after IC30’s for each drug has been found.
Growth assays were completed to compare the growth of cells after treatment with different drug combinations giving preliminary assessment as to whether the MIB/MS and PCA method will be an improvement in determining optimal drug combinations. Growth curves were completed in 96 well plates, SKBR3 cells were plated at 1000 cells/well with biological replicates of three for each sample. Samples consisted of each drug by itself and pairings of Lapatinib with each of the three other drugs. The IC30 dose for each drug was used in an individual sample and added to the IC30 of another drug for all combination samples. The cells were treated, imaged and counted on Days 0, 2, 4, and 6. Then the cells were imaged and counted on the final day, Day 8. The ideal result for a growth curve using the drugs previously mentioned, can be seen in Figure 10B. Percent growth, calculated by the average number of cells for a sample divided by the average number of cells for that sample on Day 0, is tracked every two days. The key components of this ideal graph are that the single drug samples all grow approximately at the same pace and are close to 30% less than the DMSO sample on Day 4, expected due to the IC30 at day 4 from dose curves. Secondly, the goal of the growth assay is to observe noticeable differences in drug combination samples, so as to determine if any of the combinations are more efficient at inhibiting growth than others. Based on the PCA results of kinome changes in SKBR3 cells after treatment with the four drugs (Figure 9) the combination of Lapatinib and BEZ235 is expected to inhibit growth the most, specifically compared to Lapatinib and Dasatinib which had similar kinases upregulated to a different degree, in contrast to Lapatinib and BEZ235 which alter different kinases. If the Lapatinib and BEZ235 combination causes more efficient inhibition and therefore less growth, the methodology of using MIB/MS and PCA for choosing drug combinations may be a promising
improvement on current trial and error methods. Results and discussion
The IC30 doses are displayed in the titles for each graph and were used for the first growth curve. The growth curves produced using these IC30 doses are shown in Figure 12. Although the individual drug samples of Lapatinib, Trametinib and Dasatinib did not inhibit growth to 70% exactly on Day 4, the growth trends were similar and comparable. The individual drug sample for BEZ235 caused significantly more inhibition in the growth of the cells, causing the comparisons of drug combinations to be
inaccurate. Although the Lapatinib and BEZ235 combination did inhibit growth more than the other combinations, this observance is non-conclusive as the dose for BEZ235 caused similar inhibition by itself. Because the IC30’s acquired from the previous dose curves did not produce the expected growth
inhibition in the growth assay, the dose curve experiments were repeated.
Figure 13B illustrates the six repetitions of the dose curve for Dasatinib. The IC30 doses ranged from 230 nM to 2 uM. Contrary to the case of BEZ235’s dose curves, all of Dasatinib’s dose curves follow a
similar shape. An initial IC30 dose of 600 nM was used which caused an appropriate growth of 65% on Day 4 (Figure 12). In a following growth assay the same dose was used again causing growth of 88% on Day 4 (Figure 14). Two of the five dose curves performed for Trametinib did not cause enough inhibition at the highest dose to calculate an IC30, shown in Figure 13C. The first growth assay used an IC30 of 30 nM for Trametinib, causing 86% growth at Day 4 (Figure 12). The second assay used 50 nM, causing 83% growth at Day 4 (Figure 14). These doses are appropriate but are in stark contrast to results of 10 uM causing over 70% growth in previous dose curves.
The second growth assay performed can be seen in Figure 14. Again, the Lapatinib and BEZ235 combination inhibited growth by the most percentage as is expected, but comparisons of the drug combinations are inexact due to low growth of BEZ235, and the high growth of Dasatinib and Trametinib. The discrepancy between inhibition caused by IC30 doses in dose curves versus growth assays could stem from experimental errors in preparing drug solutions or the difference in plating concentration and length of the experiments.
Conclusions
experiments in order to compare the suggested combinations.
PCA was performed on MIB/MS data consisting of SKBR3 cells treated with various kinase inhibitors. The resulting changes in the functional kinome produced differences in the samples in PCA, showing that Lapatinib and BEZ235 had different sets of kinases upregulated. This suggests that the combination of Lapatinib and BEZ235 would inhibit growth of SKBR3 cells more than other combinations such as Lapatinib and Dasatinib which, to varying degrees, had a similar set of kinases changed. To explore these drug combinations, dose curves and growth assays were performed. Dose curves were used to compare a range of doses to percent growth measured against a DMSO control sample. From this curve, IC30, a dose inhibiting growth by 30%, was calculated. The IC30 doses were then used for individual drug samples and in combination samples for growth assays. With all individual drug samples causing similar inhibition of growth the drug combinations can be compared by growth percent.
Because of inaccurate and inconsistent inhibition by IC30 doses, directly comparing the growth of drug combinations was not possible.
FIGURES AND TABLES
Figure 3 (D-G). Flowchart of methods for lasso regression and annotations. (D) Matrix of direct
Figure 5. Subnetwork of regression features and protein interactions for ADCK1. Well-studied kinases, 16, are shown in gray and understudied, 9 including ADCK1, in green. Known interactions are portrayed via a gray connecting line and regression linkages with red lines. ADCK1 has no confirmed protein-protein interactions and little known concerning its molecular or biological function other than its classification as a kinase. By utilizing the regression linkages, signaling such as insulin and ErbB were found to be statistically over represented in kegg pathways. Involvement in colorectal, endometrial, prostate cancer and M phase of the cell cycle were also results of the annotations.
Figure 6. Subnetwork of regression features and protein interactions for SG196. SG196 has 37
regression correlations, shown in red, and an additional 91 kinases in its subnetwork pictured above in grey, from known protein-protein interactions. A linkage between the same kinases by regression and protein-protein interactions is shown in pink. Previously documented annotations for SG196 show involvement with muscle dystrophy diseases, abnormal neuron generation, and a connective protein alpha-dystroglycan. SG196’s annotations via regression linkages and protein interactions include ErbB2 signaling, PI3K-Akt signaling, IGF1R signaling, and mechanisms in metabolism.
Figure 7. Subnetwork of regression features and protein interactions for CSK23. CSK23’s subnetwork consists of 26 regression linkages and 80 known interactions. Known functions of CSK23 relate the protein to Wnt signaling, DNA repair in the cell cycle, and development of influenza A and lung cancer. Annotations using the subnetwork shown above reveal statistically overrepresentations in Ras, PI3K-Akt signaling, gene expression and condensation of prometaphase chromosomes, relating to the previously mentioned involvement in cell cycle.
Figure 8. Subnetwork of regression features and protein interactions for M3KL4. This subnetwork is composed of 24 regression linkages and 25 additional known interactions. M3KL4 has been shown to negatively regulate TLR4 signaling, and does not activate specific pathways within the MAPK system. Annotations statistically overrepresented for M3KL4 were function in immune system, insulin signaling, and synthesis of PIPs.
Figure 10 (A-B). (A) Ideal dose curve for a kinase inhibitor. Average growth of samples treated with different doses on a log scale are compared against the growth of a DMSO control sample. The log curve can then be reverted to a linear equation to predict a dose causing 30% inhibition (IC30) for use in growth assays. (B) Ideal growth assay for combinations between Lapatinib, Dasatinib, Trametinib and BEZ235. All single drug samples show similar percent growth. Lapatinib and BEZ235 combination expected to cause most inhibition or least percentage growth compared to a DMSO control.
0 1 2 3 4 5 6
day 0 day 2 day 4 day 6 day 8
% G ro w th DMSO Lapa nib Dasa nib Trame nib BEZ235
Lapa nib + Dasa nib Lapa nib +Trame nib Lapa nib + BEZ235
0 20 40 60 80 100 120
0 1 3 10 30 100 300 1000 3000 10000
Figure 11 (A-D). Dose curves used for calculating IC30’s for each drug used in the first growth assay. Dose curve experiments were repeated until a reasonable shape and dose resulted. (A) Lapatinib, IC30 of 9 nM. (B) BEZ235, IC30 of 50 nM. (C) Trametinib, IC30 of 30 nM. (D) Dasatinib, IC30 of 600 nM.
100 98 94 94 65 57 16 11 5 4 0 20 40 60 80 100 120
0 0.3 1 3 10 30 100 300 1000 3000
% D M SO Dose (nM) 100 111 113 91 79 61 54 40 40 31 0 20 40 60 80 100 120 140
0 1 3 10 30 100 300 1000 3000 10000
% D M SO Dose (nM) 100 91 85 76 70
61 60 61 57 41 0 20 40 60 80 100 120
0 1 3 10 30 100 300 1000 3000 10000
% D M SO Dose (nM) A B C D
Lapa nib IC30 = 9 nM BEZ235 IC30 = 50 nM
Trame nib IC30 = 30 nM Dasa nib IC30 = 600 nM
100
112 108 112
109 105 83 54 43 36 0 20 40 60 80 100 120 140
0 1 3 10 30 100 300 1000 3000 10000
%
D
M
SO
Figure 12. First growth assay for Lapatinib, Dasatinib, Trametinib and BEZ235. Because of the low growth of BEZ235 (starred), the drug combinations concerning Lapatinib and BEZ235 were unable to be directly compared. Although the most inhibitive was the combination of Lapatinib and BEZ235 this result was inconclusive as not all single dose samples caused similar growth.
0 1 2 3 4 5 6
day0 day2 day4 day6 day8
%
G
ro
w
th
DMSO
Lapa nib
Dasa nib
Trame nib
BEZ235
Lapa nib+Dasa nib
Lapa nib+Trame nib
Figure 13 (A-B). Compilation of dose curves which were repeated for each of the drugs. Each dose curve is represented by a separate line/color, with the legend detailing the date the curve was performed and its resulting IC30 dose. (A) Compilation of dose curves completed for BEZ235. (B) Compilation of dose curves completed for Dasatinib.
0 20 40 60 80 100 120 140
0 1 3 10 30 100 300 1000 3000 10000
% o f D M SO co n tr o l Dose (nM)
Dasa nib
6/13 IC30 [600]
6/24 IC30 [2030]
7/17 IC30 [1520]
7/25 IC30 [2560]
8/5 IC30 [2060]
8/18 IC30 [237] 0 20 40 60 80 100 120
0 1 3 10 30 100 300 1000 3000 10000
% o f D M SO co n tr o l Dose (nM)
BEZ235
6/13 IC30 [6540]
6/18 IC30 [8990]
6/24 IC30 [50]
7/25 IC30 [17]
20 40 60 80 100 120 % o f D M SO co n tr o l
Trame nib
6/13 IC30 [30]
7/25 IC30 [N/A]
8/5 IC30 [N/A]
8/18 IC30 [240]
9/25 IC30 [6300]
A
B
Figure 13 (C). Compilation of dose curves which were repeated for each of the drugs. Each dose curve is represented by a separate line/color, with the legend detailing the date the curve was performed and its resulting IC30 dose. (C) Compilation of dose curves for Trametinib.
0 20 40 60 80 100 120 140
0 1 3 10 30 100 300 1000 3000 10000
% o f D M SO co n tr o l Dose (nM) Dasa nib
6/13 IC30 [600]
6/24 IC30 [2030]
7/17 IC30 [1520]
7/25 IC30 [2560]
8/5 IC30 [2060]
8/18 IC30 [237] 0 20 40 60 80 100 120
0 1 3 10 30 100 300 1000 3000 10000
% o f D M SO co n tr o l Dose (nM) BEZ235
6/13 IC30 [6540]
6/18 IC30 [8990]
6/24 IC30 [50]
7/25 IC30 [17]
0 20 40 60 80 100 120
0 1 3 10 30 100 300 1000 3000 10000
% o f D M SO co n tr o l Dose (nM) Trame nib
6/13 IC30 [30]
7/25 IC30 [N/A]
8/5 IC30 [N/A]
8/18 IC30 [240]
9/25 IC30 [6300]
A
B
Figure 14. Second growth assay performed for Lapatinib, Trametinib, BEZ235 and Dasatinib after dose curves were repeated for more accurate IC30 doses. Despite repetition of dose curves for improved IC30 dose, drug combinations remained incapable of comparison due low growth of BEZ235 and high growth of Trametinib and Dasatinib (starred). Again, the combination of Lapatinib and BEZ235 did produce the most growth inhibition but was not a significant result.
0 1 2 3 4 5 6 7 8 9
day0 day2 day4 day6 day8
%
G
ro
w
th
DMSO
Lapa nib
Trame nib
BEZ235
Dasa nib
Lapat+Tramet
Lapat+BEZ
Table 1. Example matrix of raw MIB/MS data from four cell lines and only 30 out of the 254 kinases. The uniprot name of each kinase is located in the left column with each other column being a different cell line sample. Each subtype of cancer is represented here including triple-negative (tnbc), HER2-enriched, and luminals.
claudin basal her2 luminal
tnbc tnbc her2/luminal her2/luminal
Uniprot SUM159_1 HCC1806_1 SKBR3_1 MCF7_1
AAK1 4626000000 1217000000 2230000000 13230000000
AAPK1 3446000000 981500000 2708000000 23970000000
AAPK2 891300000 348800000 2262000000 8639000000
ABL1 421400000 55820000 176400000 2271000000
ABL2 452800000 72080000 173400000 1638000000
ACK1 307100000 50920000 156200000 753500000
ACV1B 78780000 34060000 733200000 727000000
ACVR1 1405000000 39050000 0 2002000000
ADCK1 0 0 28790000 252700000
ADCK4 0 0 0 0
ADCK5 0 0 0 0
ADK 1050000000 319400000 1891000000 4209000000
AGK 49460000 0 0 355000000
AKT1 224000000 70780000 95020000 1631000000
AKT2 172800000 18600000 0 1516000000
AKT3 0 21180000 0 0
ARAF 369600000 78680000 222700000 1051000000
ATM 25470000 0 16870000 0
ATR 17570000 0 0 0
AURKB 485700000 121600000 614900000 289600000
AVR2A 46520000 13690000 0 0
BCKD 295400000 88940000 0 0
BLK 0 0 0 0
BMP2K 2460000000 384900000 528100000 3530000000
BMPR2 80890000 60040000 56590000 497200000
BMR1A 453100000 54480000 47360000 0
BMR1B 115100000 0 0 0
BRAF 407600000 103100000 339900000 2643000000
BRD2 11450000 0 0 0
Table 2. Gene name, classification, and regression features of four Tdark kinases: ADCK1, CSK23, M3KL4, and SG196. Information for the kinases listed is located in the Supplemental Data File S5 from Collins, et al, columns C, T, AM, and BK respectively [7].
Name AarF domain
containing kinase 1
Casein kinase II subunit alpha 3
Mitogen-activated protein kinase
kinase kinase
Protein O-mannose kinase
Uniprot ID ADCK1 CSK23 M3KL4 SG196
Gene Name ADCK1 CSNK2A3 MAP3K21 POMK
Classification Tdark/Understudied Tdark Tdark Tdark/Understudied
Primary MRCKG CSK21 CLK4 SIK3 NEK1 ERBB2
Regression DMPK IKKA E2AK1 TYK2 PI3R4 K6PP
Features KITM PAK4 M3K9 PKN3 TIF1B
STK16 CSK22 PK3C3 STRAA
2nd Order BRAF TESK1 ACVR1 MK13 BRAF STK11 AKT1 NEK1
Regression CDK1 CDK14 MLTK CDK1 TAOK3 AVR2A P4K2B
Features CSK22 CDK3 MP2K4 CHK1 TESK1 BMPR2 PDXK
DMPK EGFR MRCKB DYR1A BUB1 PI3R4
EPHB2 EPHB2 ST38L DYR1B CLK3 PI51C
GSK3B FER STK16 HYKK E2AK4 PK3C3
HYKK FGFR4 STK24 JAK1 ERN1 PKN3
IPMK INSR M3K1 IRAK4 PLK4
KITM JAK1 M3K11 K6PL ST17A
M3K1 KAPCA MLTK K6PP ST32C
MK08 KT3K PI3R4 KKCC2 STK11
PDPK1 LYN PKN2 KSYK TESK1
PI4KA M3K11 PLK4 KT3K TIF1B
PI51C MARK2 SIK1 M3K1 TNIK
REFERENCES
[1] R. L. Siegel, K. D. Miller, A. Jemal, “Cancer statistics, 2017,” CA: A Cancer for Journal for Clinicians,
vol. 67, pp. 7-30, Jan. 2017.
[2] The Cancer Genome Atlas Network, “Comprehensive molecular portraits of human breast tumors,”
Nature, vol. 490, no. 7418, pp. 61-70, Oct. 2012.
[3] L. N. Harris, N. Ismaila, L. M. McShane, F. Andre, D. E. Collyar, A. M. Gonzalez-Angulo, E. H. Hammond, N. M. Kuderer, M. C. Liu, R. G. Mennel, C. V. Poznak, R. C. Bast, D. F. Hayes, “Use of Biomarkers to Guide Decisions on Adjuvant Systemic Therapy for Women with Early-Stage Invasive Breast Cancer,” Journal of Clinical Oncology, vol. 34, no. 10, pp. 1134-1150, 2016.
[4] G. Manning, D. B. Whyte, R. Martinez, T. Hunter, S. Sudarsanam, “The Protein Kinase Complement of the Human Genome,” Science, vol. 298, no. 5600, pp, 1912-1934. Dec. 2002.
[5] J. S. Duncan, M. C. Whittle, K. Nakamura, A. N. Abell, A. A. Midland, J. S. Zawistowski, N. L. Johnson, D. A. Granger, N. V. Jordan, D. B. Darr, J. Usary, P.-F. Kuan, D. M. Smalley, B. Major, X. He, K. A. Hoadley, B. Zhou, N. E. Sharpless, C. M. Perou, W. Y. Kim, S. M. Gomez, X. Chen, J. Jin, S. V. Fyre, H. S. Earp, L. M. Graves, G. L. Johnson, “Dynamic Reprogramming of the Kinome in Response to Targeted MEK Inhibition in Triple-Negative Breast Cancer,” Cell, vol. 149, no. 2, pp. 307-321, Apr. 2012. [6] L. G. Ahronian, R. B. Corcoran, “Strategies for monitoring and combating resistance to combination
kinase inhibitors for cancer therapy,” Genome Medicine, vol. 9, Apr. 2017.
[7] K. A. L. Collins, T. J. Stuhlmiller, J. S. Zawistowski, M. P. East, T. T. Pham, C. R. Hall, D. R. Goulet, S. M. Bevill, S. P. Angus, S. H. Velarde, N. Sciaky, L. M. Graves, G. L. Johnson, S. M. Gomez, “Proteomic Analysis Defines Kinase Taxonomies Specific for Subtypes of Breast Cancer,” bioRxiv beta, preprint, Apr. 2017.
[8] D.-T. Nguyen, S. Mathias, C. Bologa, S. Brunak, N. Fernandez, A. Gaulton, A. Hersey, J. Holmes, L. J. Jensen, A. Karlsson, G. Liu, A. Ma’ayan, G. Mandava, S. Mani, S. Mehta, J. Overington, J. Patel, A. D. Rouillard, S. Schurer, T. Sheils, A. Simeonov, L. A. Sklar, N. Southall, O. Ursu, D. Vidovic, A. Waller, J. Yang, A. Jadhav, T. I. Oprea, R. Guha, "Pharos: Collating Protein Information to Shed Light on the Druggable Genome," Nucleic Acids Research, vol. 45, no. D1, pp, 995-1002, Nov. 2016.
[9] A. Franks, E. Airoldi, N. Slavov, “Post-transcriptional regulation across human tissues,” Plos Computational Biology, 13(5): e1005535, May 2017.
[10] B. Zhang, J. Wang, X. Wang, J. Zhu, Q. Liu, Z. Shi, M. C. Chambers, L. J. Zimmerman, K. F. Shaddox, S. Kim, S. R. Davies, S. Wang, P. Wang, C. R. Kinsinger, R. C. Rivers, H. Rodriguez, R. R. Townsend, M. J. C. Ellis, S. A. Carr, D. L. Tabb, R. J. Coffey, R. J. C. Slebos, D. C. Liebler, NCI CPTAC Investigators, “Proteogenomic characterization of human colon and rectal cancer,” Nature, vol. 513, no. 7518, pp. 382-387, Mar. 2015.
[11] T. J. Stuhlmiller, H.S. Earp, G. L. Johnson, “Adaptive Reprogramming of the Breast Cancer Kinome,”
[12] J. O. Ogutu, T. Schulz-Streeck, H.-P. Piepho, “Genomic selection using regularized linear regression models: ridge regression, lasso, elastic net and their extensions,” BioMed Central Proceddings, vol. 6, May 2012.
[13] J. H. Friedman, T. Hastie, R. Tibshirani, “Regularization Paths for Generalized Linear Models via Coordinate Descent,” Journal of Statistical Software, vol. 33, no. 1, Feb. 2010.
[14] R. Tibshirani, “Regression Shrinkage and Selection via the Lasso,” Journal of the Royal Statistical Society: Series B, vol. 58, no. 1, pp. 267-288, 1996.
[15] J. Reimand, T. Arak, P. Adler, L. Kolberg, S. Reisberg, H. Peterson, J. Vilo, “g:Profiler-a web server for functional interpretation of gene lists (2016 update),” Nucleic Acids Research, vol. 44, pp. W83-W89, July 2016.
[16] H. Mi, X. Huang, A. Muruganujan, H. Tang, C. Mills, D. Kang, and P. D. Thomas, “PANTHER version 11: expanded annotation data from Gene Ontology and Reactome pathways, and data analysis tool enhancements,” Nucleic Acids Research, Nov. 2016.
[17] H. Mi, A. Muruganujan, J. T. Casagrande, P. D. Thomas, “Large-scale gene function analysis with the PANTHER classification system,” Nature Protocol, July 2013.
[18] G. Stelzer, N. Rosen, I. Plaschkes, S. Zimmerman, M. Twik, S. Fishilevich, T. I. Stein, R. Nudel, I. Lieder, Y. Mazor, S. Kaplan, D. Dahary, D. Warshawsky, Y. Guan-Golan, A. Kohn, N. Rappaport, M. Safran, D. Lancet, “The GeneCards Suite: From Gene Data Mining to Disease Genome Sequence Analyses,” Current Protocols in Bioinformatics, vol. 54, Jun. 2016.
[19] S. Kummar, H. X. Chen, J. Wright, S. Holbeck, M. D. Millin, J. Tomaszewski, J. Zweibel, J. Collins, and J. H. Doroshow, “Utilizing targeted cancer therapeutic agents in combination: novel approaches and urgent requirements,” Nature Reviews Drug Discovery, vol. 9, pp. 843-856, Oct. 2010.
[20] National Center for Biotechnology Information. PubChem Compound Database; CID=208908, https://pubchem.ncbi.nlm.nih.gov/compound/208908 (accessed Nov. 7, 2017).
[21] M. I. Carolo, A. M. Molina, Y. Lakhman, S. Patil, K. Woo, J. DeLuca, C-H. Lee, J. J. Hsieh, D. R. Feldman, R. J. Motzer, and M. H. Voss, “A Phase Ib Study of BEZ235, a Dual Inhibitor of
Phosphatidylinositol 3-Kinase (PI3K) and Mammalian Target of Rapamycin (mTOR), in Patients With Advanced Renal Cell Carcinoma,” The Oncologist, Apr. 2016.
[22] Y. W. Yi, J. S. Park, S. J. Kwak, and Y. S. Seong, “Co-treatment with BEZ235 Enhances Sensitivity of BRCA1-negative Breast Cancer Cells to Olaparib,” Anticancer Research, Jul. 2015.
![Figure 1. Overlay of understudied kinases, shown in red, on the phylogenetic kinome tree [23]](https://thumb-us.123doks.com/thumbv2/123dok_us/8289395.2195109/29.918.175.715.176.927/figure-overlay-understudied-kinases-shown-phylogenetic-kinome-tree.webp)