THE RELATIONSHIP BETWEEN TRAINING LOAD, CORTISOL AWAKENING RESPONSE AND ORTHOSTATIC HEART RATE
Travis Anderson
A thesis submitted to the faculty of the University of North Carolina at Chapel Hill in partial fulfillment of the requirements for the degree of Masters of Arts in the Department of Exercise
and Sport Science (Exercise Physiology).
Chapel Hill 2016
Approved by:
ABSTRACT
TRAVIS ANDERSON: The Relationship Between Training Load, Cortisol Awakening Response and Orthostatic Heart Rate
(Under the direction of Anthony C. Hackney)
The cortisol awakening response (CAR) is used as a marker of stress, however it is unknown whether CAR will vary in response to acute training load. The orthostatic heart rate test (OHR) is commonly used by athletes, but the evidence for its use is not well established.
ACKNOWLEDGEMENTS
TABLE OF CONTENTS
LIST OF TABLES ... vii
LIST OF FIGURES ... viii
LIST OF ABBREVIATIONS ... ix
INTRODUCTION ... 1
Statement of Purpose ... 4
Research Questions ... 4
Research Hypotheses ... 5
Assumptions ... 5
Definition Of Terms ... 5
Delimitations ... 6
Limitations ... 6
Significance ... 6
REVIEW OF LITERATURE ... 8
Hypothalamic- Pituitary-Adrenal Axis ... 8
Autonomic Nervous System ... 9
Overtraining ... 10
Hypothalamic Hypothesis ... 15
Autonomic Nervous System Hypothesis ... 19
METHODOLOGY ... 29
Participants ... 29
Instrumentation ... 30
Procedures ... 30
Research Design and Statistical Analysis ... 34
RESULTS ... 36
Subject Characteristics ... 36
Training Loads ... 37
Biomarker Analysis ... 38
Correlational Analysis ... 40
Exploratory Analysis ... 42
DISCUSSION ... 43
Athlete Characteristics ... 43
Cortisol Awakening Response ... 44
Orthostatic Heart Rate ... 48
Limitations ... 49
Strengths ... 52
Future Research ... 54
Conclusion ... 55
APPENDIX 1. WRITTEN INFORMED CONSENT FORM ... 56
APPENDIX 2. MEDICAL HISTORY QUESTIONNAIRE ... 60
APPENDIX 3. RECOVERY-STRESS QUESTIONNAIRE ... 63
APPENDIX 5. SALIVA COLLECTION PROCEDURES ... 71
APPENDIX 6. OHR PROCEDURES ... 72
APPENDIX 7. BORG RATING OF PERCEIVED EXERTION ... 73
APPENDIX 8. REST-Q RATIONALE ... 74
LIST OF TABLES
Table 1. Subjects characteristics and training history (means±SD) ... 37
Table 2. Training characteristics of high and low training days (mean±SD) ... 37
Table 3. Relationships between CAR and TRIMP ratio and difference scores ... 40
Table 4. Relationships between OHR and TRIMP ratio and difference scores ... 41
LIST OF FIGURES
Figure 1. Main effect of cortisol responses across the study immediately
after waking (C0) and after 30 minutes (C30) (means±SD) ... 38
Figure 2. The cortisol awakening responses following high and low
training load days (means±SD) ... 39
LIST OF ABBREVIATIONS
ACTH Adrenocorticotropic Hormone ANS Autonomic Nervous System
AUCg Area Under the Curve relative to the ground AUCi Area Under the Curve relative to the increase CAR Cortisol Awakening Response
CRF Corticotropin-Releasing Factor
ELISA Enzyme Linked Immunosorbent Assay FOR Functional Overreaching
HFP High-frequency Power
HPA-axis Hypothalamic-Pituitary-Adrenal axis
HR Heart Rate
HRmax Maximal Heart Rate LFP Low-frequency Power
NFO Non-functional Overreaching OHR Orthostatic Heart Rate
OR Overreaching
OT Overtraining
OTS Overtraining Syndrome
PNS Parasympathetic Nervous System RPE Rate of Perceived Exertion SNS Sympathetic Nervous System
CHAPTER ONE
Introduction
Endurance running is one of the oldest and most enjoyed sports worldwide. Within the United States of America, the number of participants completing endurance running events has increased 300% since 1990 (2015 State of the Sport - U.S. Race Trends, 2015). In 2013, a peak participation rate in endurance running events ranging from 5 km to the marathon was observed, with over 19 million finishers, followed by a growth in participation rates in 2014 in both the half and full marathon distances (2015 State of the Sport - U.S. Race Trends, 2015). The demographics competing in these are of course separated from the elite, world-class runners, who have been consistently breaking endurance running records, and separate again from the ultra-endurance athletes competing in events such as the Leadville Trail 100 mile event.
training day, or short training block (Meeusen et al., 2013). Exhaustion and fatigue will result in cellular adaptations (or mal-adaptations), but with adequate rest can result in adaptations that result in improved performances (Fry, 2005).
If the degree of overload is too great and insufficient time is granted to the recovery (adaptation) process, an athlete may experience the overtraining syndrome (OTS) (Urhausen & Kindermann, 2002). Colloquially, the term overtraining is often used to denote any period with an accumulation of training volume that results in reduced performances (Kreher & Schwartz, 2012). However, the terminology used by Kreider, Fry, and O’Toole (1998) have been widely adopted for the discussion of the overtrained state developing and consists of distinctions between functional (FOR) and non-functional overreaching (NFO), overtraining (OT) and OTS. Importantly, overtraining (OT) and overreaching are terms that refer to processes, whereas OTS is the resultant condition (Fry et al., 2005) and has been estimated to occur in up to 60% of elite endurance runners throughout their careers (Morgan, O'Connor, Sparling, & Pate, 1987).
There is an inherent definitional limitation in determining whether an athlete is in the FOR or NFO or OT stage, due to the need to measure the duration of rest required to achieve previous performance levels. This is clearly a less than ideal situation, as withdrawing an athlete from training and competition to assess their recovery results in an extensive and cumbersome testing procedure and loss of training time. Therefore, a biomarker that is only detectable once an athlete is overtrained serves no practical purpose for the prevention of OTS; rather it only serves as a measure of confirmation that an individual is overtrained. As such, there is a need for a test that can identify increased risk of OTS as a function of training load to serve as an early
adaptations, biomarkers must be sensitive enough to detect small day-to-day training load variations and provide information regarding the physiological state of the athletes. A useful biomarker for the assessment of overtraining must therefore be specific, sensitive, accurate, reliable and predictive. Whilst having a single all encompassing test to diagnose OTS would be ideal, and many researchers continue this quest for the ‘holy grail’ of biomarkers, the variable nature of OTS lends itself towards multiple tests (Meeusen et al., 2013) and a potential OTS risk factor composite score being necessary.
The Hypothalamic Hypothesis is perhaps one of the most studied hypotheses of overtraining (Fry et al., 2005) and contends that OT results in a dysregulation of the
hypothalamic-pituitary-adrenal axis (HPA-axis). This is evidenced by a multitude of studies that demonstrated changes in adrenocorticotropic hormone, cortisol and testosterone in OTS.
Unfortunately, multiple studies show contradictory responses in these variables, both in direction and magnitude of response, which is likely due to the lack of consistency in defining the state of overreaching (FOR/NFO) or OT observed (Meeusen et al., 2013). One method of assessing the HPA-axis is known as the cortisol awakening response (CAR) and is a marker of the change in cortisol concentrations from the time of awakening to 30-45 minutes post-awakening
(Hucklebridge, Mellins, Evans, & Clow, 2002). Although this marker has been often used in HPA-axis activity in psychological research (Clow et al., 2010), there are limited reports of its use in measuring the physical stress associated with physical training.
A second overtraining hypothesis is known as the Autonomic Nervous System
heart rate measurements prior to and following an orthostatic stress provides a simple and easily accessible method for the assessment of ANS activity. Currently employed by many athletes and coaches, the use of orthostatic heart rate measurements (OHR) in athletes are less well
documented in the scientific literature.
Statement of Purpose
With the above points in mind, the purpose of this study was to assess whether training loads observed during regularly scheduled training periods in endurance athletes can be assessed via the cortisol awakening response or orthostatic heart rate. Furthermore, this study will provide insight into the relationship between the cortisol awakening response and autonomic nervous system activity as assessed via the orthostatic heart rate test in response to variable training loads.
Research Questions
RQ1. Does the cortisol awakening response correlate with acute training loads, during a regular two week training period, as measured and expressed as:
a. Area under the curve; or b. Magnitude of change?
RQ2. Does the orthostatic heart rate test correlate with training load changes, during a regular two-week training period?
RQ3. Does the orthostatic heart rate test correlate with cortisol awakening responses, expressed as:
Research Hypotheses
H1. The cortisol awakening response will be positively correlated with training loads, measured as both area under the curve and magnitude of change.
H2. The orthostatic heart rate test will be positively correlated with training load, measured as area under the curve and magnitude of change.
H3. The cortisol awakening response and orthostatic heart rate test will be positively correlated for all variables.
Assumptions
Since this study employed no intervention or manipulation of training loads, many assumptions were made. Firstly, it was assumed that participants were accurately and honestly recording their training session information, including their rate of perceived exertion. It is also assumed that participants were in compliance and strictly adhering to saliva collection and heart rate assessment procedures and specimen storage protocols.
Definition Of Terms
Cortisol – The major glucocorticoid hormone in humans, released from the adrenal cortex. Cortisol Awakening Response – The increase in cortisol concentration that accompanies the awakening process.
Heart Rate Variability – The variation in beat-to-beat heart rate measurements, often used as a measure of cardiac autonomic regulation.
Heart Rate Reserve – The difference between maximal and resting heart rate values.
Delimitations
Participants were delimited to endurance trained runners, with a competitive running history of >1 year who were currently training for and competing in endurance running events >5 km. Participants were delimited to runners who train regularly (>5 days per week) and
consistently alternate training loads. An attempt was made to recruit only athletes who are willing to have several training sessions in the two-week period of sessions considered to be ‘hard’ (>15) based on the 6-20 Borg Rate of Perceived Exertion.
Limitations
Due to the observational nature of the study design, there were clear, inherent limitations. Firstly, since training volume was not manipulated, variation existed, both in the timing, duration and intensity of the training sessions that were considered to be ‘hard’ by participants. Secondly, due to individual variation in competition schedules, stage of training or periodization model, participants were in varying phases of fitness development and have varying degrees of training history, both acutely and chronically. Although participants were asked to maintain their regular consistent diet throughout the course of the study, the manipulation of dietary factors may have affected the cortisol awakening responses.
Significance
CAR and the relationship with training load, measured by both objective and subjective measures.
CHAPTER TWO
Review of Literature
The following review of literature will begin by addressing the physiological systems of particular interest to this research project; namely, the hypothalamic-pituitary-adrenal axis of the endocrine system and the autonomous nervous system. The review will then discuss the current state of overtraining research, followed by a more detailed analysis of the Hypothalamic
Hypothesis and ANS Hypothesis. The review will then conclude with an assessment of the current state of the proposed monitoring procedures: the cortisol awakening response and orthostatic heart rate test.
Hypothalamic- Pituitary-Adrenal Axis
Metabolic functions within the body are controlled by multiple interacting biological systems. One such system is the neuroendocrine system, which is responsible for regulating the production and secretion of hormones from endocrine glands. These hormones act throughout the body to perform specific functions at multiple sites and are often grouped by their structure and/or function. One group of hormones are known as the glucocorticoids, named after their effect on blood glucose, release by the adrenal cortex and their steroidal carbon structure
and stimulates the adrenal cortex to secrete cortisol; this interaction is known as the
hypothalamus-pituitary-adrenal (HPA) axis. Cortisol secretion follows a diurnal pattern, often related with mealtime increases, with the greatest resting concentrations being present early in the morning at approximately 0800 (Hellman et. al 1970). One mechanism for activating the cascade for cortisol release is lowered blood glucose levels. During exercise, as glucose is progressively removed from the blood for subsequent energy liberation, blood glucose levels begin to decline. Proceeding exercise, cortisol has been shown to remain elevated for almost two hours into recovery (Duclos, Corcuff, Rashedi, Fougere, & Manier, 1997), but the time of this post-exercise elevation is highly dependent on the duration (Viru, Karelson, & Smirnova, 1992) and intensity of the exercise (Davies & Few, 1973; Hackney, 2006; Hill et al., 2008). Moreover, the age and fitness capacity of the individual (Traustadottir, Bosch, & Matt, 2005) and the presence of a competitive environment (Obminski et al., 2002; Viru et al., 2007) will also impact the level of cortisol release. Of course, due to the naturally occurring cyclical changes in resting cortisol levels, the duration of cortisol elevation recovery is also related to the time of day the exercise occurs (Brandenberger & Follenius, 1975) as well as potential seasonal influences that lead to variations in cortisol concentrations (Gouarné, Groussard, Gratas-Delamarche,
Delamarche, & Duclos, 2005). During the recovery process, the continued elevation in cortisol concentration is thought to be a dominant contributor to restore blood glucose (Brooks et al., 1996).
Autonomic Nervous System
rate, vasodilation and vasoconstriction, smooth muscle contractility, lung airway dilation, endocrine release (e.g. pancreas and adrenal medulla control) and hepatic
gluconeogenesis/glycogenolysis (Freeman, Dewey, Hadley, Myers, & Froelicher, 2006). The ANS can be divided into two separate branches, distinct from each other both anatomically and physiologically (Freeman et al., 2006). The parasympathetic nervous system (PNS) branch is mostly implicated in the digestion and recovery processes and is primarily facilitated by the tenth cranial nerve, known as the Vagus nerve (Brooks et al., 1996). All preganglionic axons in the ANS utilize the neurotransmitter acetylcholine (ACh) in signal transmission at neural synapses. The postganglionic nerve fibers within the PNS also utilize ACh as a neurotransmitter to affect the target tissue. In contrast, the sympathetic nervous system (SNS) is involved in the classic “flight or fight” response (Curtis & O'Keefe, 2002) and primarily utilizes the neurotransmitter norepinephrine (NE) in the postganglionic fibers to affect changes at the target. Most ANS controlled organs are under control of both the parasympathetic and sympathetic branches and the action at the particular site is a result of both predominance of one branch and relative proportion of receptors types. The balance between PNS and SNS activity is termed vagal tone and it has been proposed that exercise induced bradycardia in athletes is partially due to an increased Vagal tone to the sinus node (Achten & Jeukendrup, 2003). During exercise,
sympathetic action will predominate and at the cessation of exercise, sympathetic activation will decrease over time (inversely proportional to fitness level), in favor of greater parasympathetic activity (Freeman et al., 2006).
Overtraining
The first phase of overtraining syndrome (OTS) development is a phase known as
state, but these decrements can be mediated and reversed with sufficient rest within a two-week period (Meeusen et al., 2013). If the athlete is unable to regain their pre-overreached
performance within the two weeks of rest, they are then deemed to be in the non-functional overreaching (NFO) phase (Meeusen et al., 2013). The continuation of training beyond the NFO phase will continue to see performances decrease and more severe decrements in psychological afferent state, immune function and other manifestations. Although difficult to categorize, and no current definition contains strict parameters for declaring an athlete has entered this stage,
athletes with the aforementioned condition are deemed to be in the overtrained state (OT). The process of OT will result in the condition known as OTS. This condition can often require weeks or months of rest and recovery prior to the athlete being able to return to training. As Meeusen et al. (2013) recognizes, the use of the term ‘syndrome’ indicates that this condition is a result of multiple factors and not solely based on exercise (i.e. psychology, capacity to resist fatigue etc. will contribute to the condition). OTS has previously been labeled as the ‘unexplained
underperformance syndrome’ due to the inability to identify a plausible cause; this implies that other factors must be ruled out that may explain the underperformance of persons, including disease states (Meeusen et al., 2013). Although not an exhaustive list, practitioners must be aware of asthma, thyroid disease, adrenal disease, diabetes or infections which all may explain underperformance (Kreher & Schwartz, 2012), prior to considering OTS.
improvements of 7.9 + 2.4% over pre-training levels, compared to only 3.9 + 4.6% in the control group (Le Meur et al., 2013). However, some researchers advise against this practice due to the inherent unpredictability of developing overtraining symptoms (Brittenham, Cioroslan, & Davis, 1998 via Urhausen & Kindermann, 2002; Urhausen & Kindermann, 2002). Therefore, training blocks aimed at overreaching an athlete must be closely monitored to ensure the athlete does not reach the non-functional overreaching phase.
Clearly there are enormous difficulties in utilizing these definitions, since there seems to be no specific breakpoint between the conditions, and therefore suggests an oversimplification (Meeusen et al., 2013). It may be best to view these conditions on a continuum, with each definition placed at varied points, based on individual physiology and psychology (Fry, Morton, & Keast, 1991).
A further difficulty in defining these terms is the inconsistency in the literature, with some studies reporting changes in certain variables, whilst other studies reveal contradictory findings. This seems to be related to the individual nature of overtraining and the lack of a gold standard measure for diagnosing an athlete with OTS (Meeusen et al., 2013). Since the
withheld until the athlete is no longer incapacitated. For an elite athlete whose life, livelihood and often identity is tied to athletic structure, this seems to present an incredible additional burden and is often rejected by athletes and coaches due to the possibility of detraining (Le Meur et al., 2013). However, there are some potential warning signs associated with the development of overtraining that one may use to identify an athlete at high risk of overtraining. These include but are not limited to: an increased training load without adequate recovery, sleep disturbances, altitude exposure, heat injury episode, a severe ‘bonk’ during training or competition or a high degree of training monotony (Kreher & Schwartz, 2012).
Although the development of our current understanding of overtraining is relatively recent, the concept of excess work leading to reductions in performance or productivity is well known, and has previously been referred to as “burnout, staleness, failure adaptation, under recovery, training stress syndrome and chronic fatigue” (Kreher & Schwartz, 2012). In fact, the modern understanding of burnout shares many similarities with OTS (Selänne, Ryba, &
Leppäluoto, 2013). For example, both burnout and OTS show decreased performance at
work/athletic performances, increases in tiredness and irritability, experience sleep disturbances, increased risk of infection and sickness and cardiovascular changes (Selänne et al., 2013).
performance, increased perceived exertion, unable to participate in physical testing due to illness, increased emotional or somatic symptoms, or a high incidence of absence due to illness
(Tanskanen et al., 2011).
The specific rates of overtraining are difficult to quantify, due to many of the limitations in study design and definitions. However, it has been proposed that >60% of elite male and female runners may experience overtraining throughout their careers (Morgan, O'Connor,
Ellickson, & Bradley, 1988; Morgan, O'Connor, Sparling, & Pate, 1987). Malone (2014) showed that a 6-week intensive basketball training schedule resulted in 50% of the athletes developing symptoms of overtraining, while a study of elite soccer players in Belgium showed 60% of athletes overreaching (Naessens, Chandler, Kibler, & Driessens, 2000). Within this group, 20% of the athletes were diagnosed as being overtrained over the course of the season (Naessens et al., 2000). In a study by Kentta, Hassmen, and Raglin (2001) an overall incidence of staleness in 37% of Swedish youth athletes was recorded, but the authors noted that the rate was varied by sport type. Individual sports showed a higher incidence of overtraining, at 48%, compared to 30% of athletes in team sports (Kentta et al., 2001). The greatest incidence was surprisingly found in badminton players (94%), suggested to be related to the frequency of competition (Kentta et al., 2001).
may prove useful in the exclusion of disease states; a necessary part of OTS diagnosis (Meeusen et al., 2013).
To assess whether an athlete has incurred a performance decrement, oftentimes, physical assessments are proposed. This is logical, since the presence of performance decrements are a requirement of the OTS diagnosis. One such test requires an athlete to complete “two
incremental, maximal exercise tests separated by 4 hours” (Meeusen et al., 2004). When tested by Meeusen et. al in 2004, the researchers showed that the second bout of exercise resulted in a decrease of 3% between bouts prior to the start of a physically intense training camp. This was compared to after the camp, where a 6% decrease was found in NFO athletes and an 11% decrease in the OT athletes. Moreover, the test was able to reveal hormonal differences between NFO and OT athletes that would not have been elucidated in a single exercise bout. In 2010, Schmikli et al. attempted to validate field test use for diagnosing overtraining. The researchers used a multi-stage shuttle test and a Zoladz test on soccer and middle-distance athletes
respectively, and found the athletes with performance decrements (i.e. overreached athletes) also displayed negative mood states and decreased cortisol levels at rest.
There are several hypotheses put forward in an attempt to explain the etiology of OTS. For a more extensive review of each hypothesis, Kreher’s 2012 review article is recommended. Suffice to say however that each hypothesis has associated strengths and weaknesses. Of particular interest to this review and the proposed research study are the biomarkers associated with the Hypothalamic Hypothesis and the Autonomic Nervous System Hypothesis.
Hypothalamic Hypothesis
ACTH stress test (Persson, Larsson, & Lindholm, 1980). Since this early investigation, salivary cortisol levels have been extensively studied in overreaching and overtraining athletes. Soon after this hypothalamic disruption was identified in equine subjects, Barron, Noakes, Levy, Smith, and Millar (1985) investigated the phenomena in overtrained athletes. The researchers studied six marathon competitors, training for a 92 km race. The athletes all followed individual training programs, running between 110-190 km per week. The athletes were tested multiple times over a four-month period, including prior to a standard 42 km race. The researchers found that the four athletes presenting symptoms of OT had significantly lower ACTH, growth
hormone and cortisol levels compared to their non-OT peers following administration of
intravenous insulin. However, these values returned to regular levels within four week of rest and became indistinguishable from the non-OT values (Barron et al., 1985).
As described earlier, NFO and OTS can be differentiated by a two-session exercise testing protocol (Meeusen et al., 2010). The most sensitive measures that were able to
differentiate the two conditions were the ACTH and PRL responses in the second exercise bout, with NFO responses being greater than the blunted responses seen in the OTS athletes (Meeusen et al., 2010). In agreement with this blunted response, a previous investigation demonstrated that exhaustive exercise resulted in a bluntedβ-endorphin pituitary response to exogenous human CRH in well-trained athletes (Keizer, Platen, & Koppeschaar, 1991).
will occur, producing a lower cortisol response to increased levels of ACTH and CRH (Roberts, Wessely, Chalder, Papadopoulos, & Cleare, 2004). The development of OT state has been characterized as a continued decline in cortisol levels, followed by a significant decrease in central endocrine factors (i.e. ACTH) (Steinacker, Lormes, Reissnecker, & Liu, 2004). This is in fact similar to what previous studies have suggested occurs within the autonomic nervous
system.
Researchers have contended that there is a distinct difference between what has been termed the sympathetic (Basedow) and parasympathetic (Addison) overtraining syndrome (Lehmann et al., 1998). Interestingly, sympathetic overtraining syndrome (a predominance of sympathetic nervous system activity), appears to occur more often in anaerobic type sports, although the late Dr. Manfred Lehmann infers this is a more rare occurrence (Lehmann, Foster, & Keul, 1993). This increase in sympathetic activity will increase catecholamine production and secretion, resulting in a down-receptor phenomena decrease in β2 receptor expression and subsequently reduced catecholamine sensitivity (Fry, 2005). Parasympathetic OTS however is characterized as a reduction in sympathetic activation (Lehmann et al., 1998) and has been suggested to occur in endurance athletes more so than strength athletes (Lehmann et al., 1993). This will result in decreased HPA drive, decreased catecholamine secretion and decreased β 2-receptor expression – all resulting in decreased performances (Fry, 2005). This is agreeable with the ACTH and cortisol response variations between OR and OT discussed above and may serve to explain the variations seen in ANS studies.
Meeusen et al. lists several issues with our current method of assessing OTS through hormonal data and among other requirements, suggests that food intake, diurnal responses, menstrual cycle and repeatability need to be addressed.
A study of salivary cortisol has shown elevated levels in collegiate swimmers who experienced overtraining during a regular competitive season (O'Connor, Morgan, Raglin, Barksdale, & Kalin, 1989). However, this investigation occurred at a time prior to a more definitive use of overtraining terminology, and so the criterion for diagnosing OT in this investigation is questionable. Lehmann et al. found small decreases in cortisol and aldosterone levels at rest and following maximal exertion after increases in training volume over the course of 3 weeks (Lehmann et al., 1992). The highly trained athletes did not however present any cortisol changes in response to the change in intensity of training (Lehmann et al., 1992).
Interestingly, only the increase training volume resulted in decreased performances and increases in feelings of exhaustion and fatigue (i.e. overtraining symptoms) whereas the increases in intensity of training did not (Lehmann et al., 1992). This was confirmed in another study by the same research group, when they found greater indices of overtraining with increases in training volume when compared to increases in intensity (Lehmann, Wieland, & Gastmann, 1997).
extended periods has not resulted in decreased T:C (Scanlan, Wen, Tucker, & Dalbo, 2014), although in a recent study of American football players undergoing an intensive weightlifting program that resulted in performance improvements, this ratio did decrease (Wallace, Slattery, & Coutts, 2009). Although some endocrinologists viewed the T:C ratio as an over simplistic
application, this variable does consistently alter as a result of overtraining (Fry et al., 2005) although some have argued that the T:C ratio is only an indicator of physiological strain, rather than a method for determining OTS (Meeusen et al., 2013). Again, differences in testing procedures and sensitivity of the instruments, coupled with definitional differences, have potentially led to inconsistent findings.
Autonomic Nervous System Hypothesis
The ANS Hypothesis states that OTS is a result of an imbalance in the autonomic nervous system (Lehmann et al., 1998). Specifically, an imbalance occurs between the sympathetic and parasympathetic branches of the ANS. One method of assessing autonomic function is to assess the variations in beat-to-beat measurements, termed heart rate variability (HRV). It has been shown in both clinical and experimental settings that parasympathetic activity is a major contributor to the high-frequency power (HFP) component of the HRV power
spectrum, whereas the low power spectrum (LFP) is more controversial, possibly representing sympathetic tone or a combination of parasympathetic and sympathetic influences (Achten &
Jeukendrup, 2003).
sympathetic activity at rest. Likewise, Dishman et al. (2000) demonstrated that individuals with an increased perception of recent emotional stress presented increased vagal modulation. Other psychological research has shown that PTSD patients have an altered autonomic cardiac
response, with higher resting heart rate and lower HRV (Cohen et al., 2000). A specific analysis of the HRV power spectrum revealed decreased parasympathetic activity and increased
sympathetic activation, which is consistent with other psychological stressors (Cohen et al., 2000).
Investigations of ANS changes to exercise stress have shown similar results. In a study of cyclists undergoing a 7-day intensive training period, an increase in HRV was observed (Halson, 2003). This particular disruption of the ANS implied parasympathetic dominance over
sympathetic input. Uusitalo, Uusitalo, and Rusko (2000) investigated cardiovascular changes in female athletes as a result of resistance training. Using HRV measurements, the researchers found increases in the low-power spectrum HRV, suggesting increases in sympathetic activity. Moreover, the HRV in the standing position was shown to decrease after the overtraining period and indicated, “pronounced vagal withdrawal” (Uusitalo et al., 2000). However, this finding was not consistent in the five overtrained athletes from the study, as one athlete showed increases in very-low power spectrum analysis with decreases in the other spectrums.
change in HRV was reversed in this individual, only after a two-month recovery period (Hedelin, Wiklund, Bjerle, & Henriksson-Larsen, 2000). Furthermore, in a study of twelve severely
overtrained male and female athletes, Hynynen and colleagues showed that overtraining led to autonomic disturbances during awakening, but not during sleep (Hynynen, Uusitalo, Konttinen, & Rusko, 2006). Specifically, researchers found a decreased LFP in the overtrained athletes when awakening compared to the control group (Hynynen et al., 2006). The authors recognized that previous investigations have shown hyperactivity of the HPA-axis in burnout patients as a response to awakening (Greaves‐Lord et al., 2007); these results suggest then, that the awakening response could be a key period for the monitoring of ANS activity.
Biomarkers
Cortisol Awakening Response
results demonstrated that CAR was perhaps more related to adrenal function than hypothalamic or pituitary responses.
One of the first investigations of CAR was from Prussner’s research team in 1995, who observed that levels of free cortisol doubled within minutes of waking up (Prussner, Kirschbaum, & Hellhammer, 1995). Then, in 1997, the same research group observed the stability of CAR across several groups (elderly, adult and children) and concluded that CAR is a stable (intra-individual) measure of HPA-activity (Pruessner et al., 1997). Since these early investigations, CAR has often been used in psychobiological research as a measure of HPA-axis activity and status (Clow et al., 2010).
An investigation by Wust et. al (2000) confirmed what was alluded to in previous
standing after waking that affects cortisol, but rather a physiological response to internal stimuli. A recent study by Smyth, Thorn, Hucklebridge, Evans, and Clow (2015) confirmed what was previously termed the latency period in the CAR. This period is characterized by a non-linear rise over approximately the first 10-minute period after waking, prior to a linear increase towards the peak value at approximately 30 minutes after waking (Smyth et al., 2015). Poor adherence to saliva collection practices therefore can influence the results, and provide overestimations of the CAR (Smyth et al., 2015). Given these parameters, it is reasonable to state that CAR, measured with strict reference to the time of awakening, may provide a cost effective, robust, consistent (Wust, Wolf, et al., 2000) and ecologically valid (Smyth et al., 2015) method of assessing HPA-activity.
With the aforementioned commonalities between burnout and overtraining, an analysis of the relationship between CAR and burnout is warranted. Pruessner, Hellhammer, and
(AUC; Grossi et al., 2005). The differences in the methodology for determining burnout and differences in occupation could be at least partially responsible for the reversal of the CAR responses between these two studies, although this may also be reflected in the adrenal
disturbance, adaption, maladaptation progression model that was previously elucidated (Meeusen et al., 2013).
In a critical study by Schlotz and colleagues, a significant difference between CAR on workdays and weekend days was observed (Schlotz, Hellhammer, Schulz, & Stone, 2004). Even when controlling for the time of awakening (i.e. time of collection) weekend days were shown to produce a lower CAR. Moreover, and in contrast to the study by Pruessner et al. (1999), the perceived workloads of participants was correlated with the degree of weekday CAR increases. This suggests that CAR is at least partially representative of both the neuroendocrine stress system’s adaptation to chronic demands, and anticipatory responses to the upcoming demands of the day. In fact, CAR has been described as a “boosting” mechanism, to prepare an individual for the upcoming demands, whilst still reflecting experiences from the prior day (Adam, Hawkley, Kudielka, & Cacioppo, 2006a).
increase in CAR was also significantly increased (12.4 + 2.4 nmol/l pre vs. 16.4 + 3.3 nmol/l post, p=0.004); however, the authors noted that only some participants were classified as CAR responders. The researchers therefore concluded that CAR is a sensitive marker for training induced stress.
Prior to these findings, a study of triathletes conducted by Gouarné et al. (2005) showed a significant effect of training on CAR. However, the authors noted that since the triathletes in their investigation showed a similar pattern of CAR to the OTS participants, it could be
concluded that CAR is not an appropriate measure for the determination of OTS. Although this is plausible, their investigation included only two OTS participants. Moreover, the evaluation of these athletes as having OTS is questionable and does not meet the criteria (time to recovery) as discussed earlier. Strahler, Ehrlenspiel, Heene, and Brand (2010) offered the suggestion of a potential habituation effect, as the martial arts athletes in their study did not show a CAR response commensurate with increased trait anxiety leading up to a major competition (Strahler et al., 2010). This was somewhat confirmed in a recent study of professional swimmers
preparing for a career affecting competition, when they showed no differences between CAR responses on competition and control days, even though the AUC for total cortisol
concentrations in the swimmers were found to be greater on competition days (Díaz et al., 2013). It is possible that the swimming event that occurred later in the day was too far removed from the CAR (0700 h vs. 1400 h), thus leading to non-significant results. Although not statistically significant, the authors did find a negative relationship between mood states and CAR, measured as the area under the curve, relative to the initial value (AUCi;r = -0.55, p = 0.07) and as
Orthostatic Heart Rate Test
Orthostatic tolerance is a measure of the degree of orthostatic stress required to induce arterial hypotension (Hainsworth, 2000). An orthostatic test therefore increases gravitational forces and reduces venous return, thereby reducing stroke volume. Since blood pressure (BP) is proportional to the product of cardiac output and total peripheral resistance (TPR), in order to maintain BP, an increase in either heart rate (HR) or TPR is required.
It is well known that increases in HR can be due to either vagal withdrawal or increased sympathetic activity (Allen & Crowell, 1989). In a fascinating study using pharmacological interventions to blunt sympathetic and parasympathetic responses, researchers confirmed that heart rate is a significant contributor to the maintenance of blood pressure during orthostatic tests (Convertino & Sather, 2000). Moreover, the researchers suggest that sympathetic activation, rather than parasympathetic withdrawal, is a predominate contributor to the maintenance of blood pressure during an orthostatic stress test (Convertino & Sather, 2000). The monitoring of HR changes during orthostatic tests can therefore provide insight into ANS activity.
The vasovagal response (i.e. the dilation of arterials and slowing of heart rate) has been observed to occur in response to severe emotional stress (van Lieshout, Wieling, Karemaker, & Eckberg, 1991). This is often clinically observed through an orthostatic test, sometimes resulting in syncope, which some researchers have suggested may be an important test for affects of patients who have previously been abused (Rice & Records, 2006). In fact, physically abused pregnant women, a state with obvious emotional stress, showed an altered vagal response to an orthostatic challenge test (Rice & Records, 2006).
greater orthostatic intolerance in those patients with chronic fatigue syndrome when compared to healthy controls. The authors note that this was likely due to either sympathetic predominance, withdrawal of parasympathetic control, or both (Wyller et al., 2014). These confirm the results from previous investigations of adolescents with chronic fatigue syndrome (Wyller, Barbieri, Thaulow, & Saul, 2008; Wyller, Saul, Amlie, & Thaulow, 2007). Lucini et al. (2002), in the aforementioned study of students preparing for an exam, found that in response to standing, students showed lower sympathetic cardiac control, possibly as a result of increased cortisol levels leading to a permissive action in the periphery (Lucini et al., 2002).
The Olympic Cross Country Skiing Sports Medicine book by Stalder et al. (2016)
discussed the orthostatic heart rate test as a “(simple), cardiac autonomic function test that can be used in the field.” The protocol required athletes to lie supine for 5-10 minutes wearing a digital HR monitor, prior to recording resting HR (HRsupine). The participants would then stand for 3 minutes and record the peak HR (HRpeak, occurring within the first 30 seconds) and average HR of the final 2 minutes of standing (HRstand) (Stalder et al., 2016).
Rusko provides interpretations on the data from the OHR protocol, which is very similar to the protocol employed in the current study. An increased sympathetic drive will present increases in HRsupine and HRstand, whereas parasympathetic dominance will show decreases in these values (Stalder et al., 2016). HRpeak (the HR obtained within 15 seconds of standing) is primarily parasympathetically controlled (i.e. vagal withdrawal) (Stalder et al., 2016). In view of these interpretations, practitioners have a convenient tool available for ANS monitoring and potential early warning system for OR and OT.
conducted an orthostatic heart rate test four times over a thirteen-week period, whilst training volume was consistently increased, resulting in decreased aerobic capacity, measured by
CHAPTER THREE
Methodology
Participants
Prior to this study being conducted, full Institutional Review Board approval was obtained. Competitive endurance trained participants (aged 18-35) were recruited from running teams and clubs from Central North Carolina and surrounding areas. Participants were required to have had at least one year of competitive endurance running experience, and were required to be currently training >5 days per week for endurance running events >5 km in distance.
Participants were also required to complete all of their training with a digital, chest strap heart rate monitor. At the first meeting, participants were informed of the benefits and risks of the study, and signed a Written Informed Consent Form (Appendix 1) after having it verbally
reviewed with them to ensure adequate understanding of the study requirements. All participants then completed a full Medical History Questionnaire (Appendix 2). Exclusion criteria included participants who are currently or may begin smoking, a history of endocrine disorders (e.g.,
Addison's Disease, Cushing's Syndrome etc.), currently taking or undergoing hormone therapy or
using anti-inflammatory medication during the course of the investigation. Attempts were made
to recruit subjects who were performing a wide variety of training loads to allow for a
heterogeneous data sample.
Power Analysis
nmol/l, 16.4+3.3 nmol/l) published in a study by Minetto et. al (2008), effect size of 0.5, a power of 0.80 and alpha level of 0.05, a sample size of 27 was calculated. The addition of thirteen additional participants allows for a 32.5% subject mortality and non-compliance (Wahbeh, Kishiyama, Zajdel, & Oken, 2008).
Instrumentation
The height (cm) and weight (kg) of each of the participants was determined using a stadiometer (Perspective Enterprises, Portage, MI) and digital scale (Health-o-meter, McCook, IL). Psychological stress was measured by the 52 question Recovery-Stress Questionnaire for Athletes (REST-Q, Appendix 3) (Kellmann, 2001). Rate of perceived exertion was measured during the training period using the Borg RPE 6-20 Scale (Borg, 1970). Heart rate (HR) was constantly monitored throughout the individual training sessions using an individually owned and commercially available heart rate monitor. Saliva samples were collected via the passive drool technique, using sterile polypropylene scintillation vials. Biochemical analysis were conducted using Enzyme Linked Immunosorbent Assays (ELISA) (American Laboratory Products Company, Salem, NH, USA). Data was recorded and organized using Microsoft Excel 2011 (Microsoft Corporation, Seattle, WA, USA). All statistical procedures were performed with SPSS Statistics (version 21.0; IBM, Armonk, New York, USA).
Procedures
Subjects were asked to report to the Applied Physiology Laboratory (APL) for the initial visit, where participants had the opportunity to read and hear the Informed Consent form
Each participant was then given time to complete a full Medical History Questionnaire. Subjects had their height and weight recorded, prior to starting the instructional process, which included a comprehensive review of the data collection forms that were provided to each subject (Appendix 4). Subjects were instructed on proper guidelines for saliva collection and conducting the OHR test (Appendix 5 and 6 respectively). The subjects were then required to demonstrate proficiency of these techniques, by actively demonstrating a simulated waking process and data recording. In addition, subjects were asked to complete a food frequency questionnaire, which asked questions relative to the types and frequency of foods eaten over the previous month. Exercise Training
Throughout the duration of the study, participants were asked to maintain their current, regular diet. No intervention into their current training regime was employed, however subjects were asked to limit monotony in their training. Subjects completed three, baseline days, in which they were asked to collect all data but refrain from exercising. From thereon, subjects underwent their regularly scheduled training and competitions, completing each with a commercially available digital heart rate monitor (chest strap). Subjects were asked to record their training and competition data, by recording the time of exercise, the duration of exercise, distance covered, average HR over the session, and session rate of perceived exertion (RPE) based on the Borg 6-20 scale (Appendix 7) on the training record form provided (Appendix 4). Subjects were also asked to record any illness or unusual dietary changes throughout the two-week period, as well as any non-running related exercise.
Cortisol Awakening Response
asked to, immediately upon waking and prior to standing (C0), produce a 1 mL saliva sample via the passive drool technique. Participants, during the instructional period within the initial visit, were verbally told to, and visually shown a 1 mL sample size, prior to being asked to produce a 1 mL sample.
Participants were then asked to complete their regular morning routine, until they produce a second, 1 mL sample 30 minutes after the first sample (C30). No eating, drinking or brushing of the teeth was permitted during this 30 minute time period. Participants were asked to record the time of awakening and time of saliva collection on the provided data collection sheets. The saliva samples were stored in a commercial freezer at approximately -4 °C. Subjects
returned the samples to the Applied Physiology Laboratory at UNC Chapel Hill, no more than 48 hours after collection. Therefore, subjects returned samples every two days, for the course of the two-week period.
Orthostatic Heart Rate
The area under the curve will be determined geometrically relative to the ground (i.e. relative to a 0 value; AUCg) and relative to OHRsupine (i.e. increase measure; AUCi).
Recovery-Stress Questionnaire
Subjects were asked to complete a Recovery-Stress Questionnaire for Sport (REST-Q Sport) at the conclusion of the baseline period, and twice each training week i.e. day 3, 6, 10, 13 and 17. Subjects were asked to answer questions related to: general stress, emotional stress, fatigue, and physical recovery, amongst others, in relation to the previous three days. Decreases in affective state scores, as given by the REST-Q, may reveal OR or OTS and therefore require further scrutiny for that particular individual (Appendix 8).
Biochemical Analysis
Once received in the APL at UNC, saliva samples were processed and stored at -80 °C until analysis. Saliva samples were centrifuged at 23 °C at 3000 rpm for 1 minute. Samples were analyzed in duplicate for cortisol concentration via Enzyme Linked Immunosorbent Assay (ELISA) (American Laboratory Products Company, Salem, NH). Standard data reductions were employed that satisfy manufacture standards.
CAR was calculated using both magnitude of change (CARΔ) and AUC. CARΔ was calculated
as:
CARΔ = [C30] – [C0]
Research Design and Statistical Analysis
Statistical analysis was performed by computer-based statistical software (SPSS; version 21). Means and standard deviations for age, height, weight, years of running experience and total training distance were calculated. This study is a single group, quasi-observational design. The significance level for all statistical procedures was set a-priori at α < 0.05. Training loads were assessed via training impulse based on heart rate reserve (Equation 1).
Equation 1. Calculation of Training Load
Training Load = Exercise Duration x [(HRave - HRrest)/(HRmax – HRrest)]
RQ1. Does the cortisol awakening response correlate with training load changes, during a regular two week training period, as measured by:
a. Area under the curve; or b. Magnitude of change?
For each subject, the greatest and lowest training loads (excluding rest days) each week were selected for analysis. The high and low training loads were required to be separated by >5 RPE points to be considered valid for analysis. The difference scores and ratios between these high and low training loads were calculated for each week and then averaged between the two weeks of training. For each day selected, the saliva samples for the following day were analyzed. Again, a difference score and ratio between the associated high and low loads CAR responses (CARΔ , AUCg, AUCi ) were averaged across the two weeks. The training load and CAR
RQ2. Does the orthostatic heart rate test correlate with training load changes, during a regular two-week training period?
Training loads were selected as in RQ1. For each day selected, the OHR (SupineΔ,
StandΔ, AUCg and AUCi) for the following day were analyzed. A difference score and ratio
between each response was averaged across the two weeks. The training load and OHR ratios were analyzed via Pearson-Product moment correlation.
RQ3. Does the orthostatic heart rate test correlate with cortisol awakening responses, measured as:
a. Area under the curve; or b. Magnitude of change?
CHAPTER FOUR
Results
Subject Characteristics
In the recruitment for this study, 14 running clubs and groups from central North Carolina were contacted, and disseminated information about the study, as well as several exercise science classes at UNC; with the addition of study advertisements, which resulted in approximately 4500 endurance running athletes being exposed to the information on the study. In addition, approximately 150 endurance athletes were recruited directly and in-person,
occasionally multiple times. From these recruitment avenues, 59 athletes who met the
inclusion/exclusion criteria expressed direct interest and were contacted to set up initial sessions. Due to the relatively high subject burden, study length (17 days), and specific exclusion criteria, 20 subjects were enrolled in the study, with 15 subjects completing the study requirements. One subject dropped out due to sustaining an injury prior to the start of the study protocol, 2 subjects dropped out due to logistical constraints, and 2 subjects were excluded due to excessive
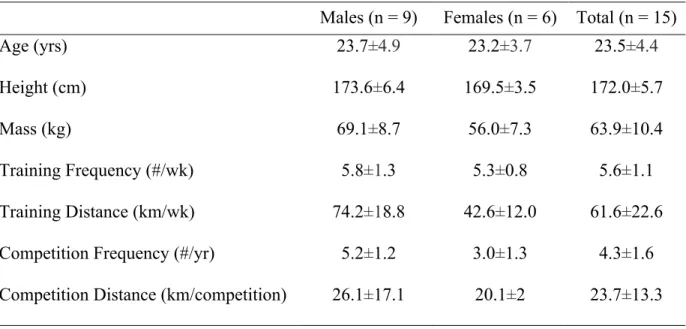
Table 1. Subjects characteristics and training history (means±SD)
Males (n = 9) Females (n = 6) Total (n = 15)
Age (yrs) 23.7±4.9 23.2±3.7 23.5±4.4
Height (cm) 173.6±6.4 169.5±3.5 172.0±5.7
Mass (kg) 69.1±8.7 56.0±7.3 63.9±10.4
Training Frequency (#/wk) 5.8±1.3 5.3±0.8 5.6±1.1
Training Distance (km/wk) 74.2±18.8 42.6±12.0 61.6±22.6
Competition Frequency (#/yr) 5.2±1.2 3.0±1.3 4.3±1.6
Competition Distance (km/competition) 26.1±17.1 20.1±2 23.7±13.3
Training Loads
Subjects showed great inter-variability between training sessions, in both duration and distance (range: 17-340.2 mins; 3.2 – 50.1 km). Means (±SD) for training duration, distance, RPE and average HR (HRave) between high and low training days are displayed in Table 2. Calculated TRIMP scores on high and low training days were significantly different from each other (p < 0.001). Although one athlete competed during the study period (5 km event), that day was not selected for analysis as either a high or low training load day.
Table 2. Training characteristics of high and low training days (mean±SD)
Biomarker Analysis
Cortisol Awakening Response Analysis
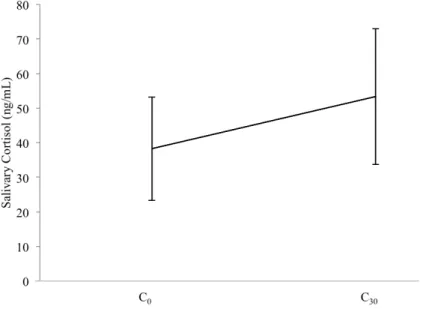
All biochemical assays were completed with an analysis of intra-assay coefficient of variations of < 2.4% and all control samples within manufacturers acceptable ranges. The inter-assay coefficient was calculated at 6.7%. Salivary samples were all collected at the proposed time intervals (C0: immediately after waking; C30: thirty minutes after initial sample; ±1 min). CAR responses across the study were typical and expected; salivary cortisol was significantly elevated at C30 relative to C0 (38.2±18.4 ng/mL vs. 52.4 ±20.4 ng/mL; p < 0.001).
Figure 1. Main effect of cortisol responses across the study immediately after waking (C0) and after 30 minutes (C30) (means±SD)
Figure 2. The cortisol awakening responses following high and low training load days (means±SD)
No significant differences were observed between CAR AUCg or AUCi (see Methods chapter, page 33; 1356.9±494.0 vs. 1360.7±528.5 ng/mL p=0.965; and 241.1±265.3 vs.
182.8±289.2 ng/mL p=0.355, respectively), or between CARΔ (16.1±17.7 ng/mL vs. 12.2±19.3
ng/mL; p=0.355) scores between high and low training days. Orthostatic Heart Rate Analysis
As displayed in Figure 3, both high and low training days showed a significant increase at OHRpeak compared to OHRsupine (high: 54.4±7.8 bpm vs. 68.7±10.9 bpm; low: 54.4±7.6 vs. 66.7±11.1 bpm; p<0.001), with no difference between OHRpeak and OHRstand following high (66.5±10.5 bpm; p = 0.237) or low (66.8±10.9 bpm; p = 0.914) training days.
Figure 3. Orthostatic heart rate following high and low training days (means±SD)
No significant differences were observed for OHR AUCg (p=0.710) or AUCi (p=0.778). Neither SupineΔ or StandΔ were significantly different between high and low training load days
(p=0.277 and p=0.098 respectively).
Correlational Analysis
CAR responses to high and low training load days, as measured by AUCg, did not show a significant relationship with TRIMP, either as a ratio (p = 0.228) or difference score (p = 0.579). When measured as AUCi, CAR was again not significantly related to TRIMP as a ratio (p = 0.303) or difference score (p = 0.201). No relationship was observed between CARΔ and TRIMP
as a ratio (p = 0.303) or difference score (p = 0.201) (see Table 3).
Table 3. Relationships between CAR and TRIMP ratio and difference scores
Ratio Difference
r p r p
AUCg -0.227 0.288 -0.105 0.579
AUCi -0.194 0.303 -0.240 0.201
No relationships were observed between OHR AUCg or AUCi and TRIMP when analyzed as ratios (p = 0.430, p = 0.511) or difference scores (p = 0.602, p = 0.344). Neither SupineΔ or StandΔ were significantly related to TRIMP as ratios (p = 0.905, p = 0.872) or
difference scores (p = 0.387, p = 0.463, see Table 4).
Table 4. Relationships between OHR and TRIMP ratio and difference scores
Ratio Difference
r p r p
AUCg -0.150 0.430 -0.099 0.602
AUCi -0.125 0.511 0.179 0.344
SupineΔ -0.023 0.905 0.164 0.387
StandΔ -0.035 0.872 -0.139 0.463
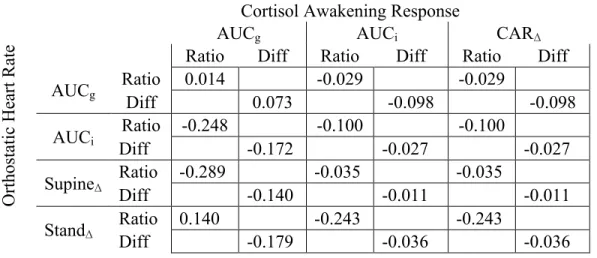
CAR and OHR were also not significantly related for any variables (Table 5).
Table 5. Relationships between the CAR and OHR ratio and difference scores
O rt hos ta ti c H ea rt Ra te
Cortisol Awakening Response
AUCg AUCi CARΔ
Ratio Diff Ratio Diff Ratio Diff
AUCg Ratio 0.014 -0.029 -0.029
Diff 0.073 -0.098 -0.098
AUCi Ratio -0.248 -0.100 -0.100
Diff -0.172 -0.027 -0.027
SupineΔ Ratio -0.289 Diff -0.140 -0.035 -0.011 -0.035 -0.011
StandΔ Ratio 0.140 -0.243 -0.243
Diff -0.179 -0.036 -0.036
Recovery Stress Questionnaire for Sport
Exploratory Analysis
Due to the novelty of this research, additional exploratory analysis was completed. Independent t-tests revealed significant differences between males and females for C30 following low training days (p = 0.017), and C0 following high training days (p = 0.033), although all cortisol values were trending towards significance (p < 0.109). From this analysis, differences between males and females were also assessed for training load variables, and it was discovered that males ran greater distances, both on high (17.5±10.6 vs. 9.1±4.0 km; p = 0.024) and low training load days (8.1±2.8 vs. 4.5±1.7 km; p < 0.001). Therefore, a partial correlation,
CHAPTER FIVE
Discussion
Introduction
The purpose of this study was to assess the relationships between the cortisol awakening response (CAR) and training loads during a regular two-week training period in endurance runners. The relationship between a practical orthostatic heart rate test and training load and CAR were also assessed. These variables were assessed in an attempt to identify a potential biomarker for assessing physiological readiness in endurance athletes, allowing coaches and athletes to modify training loads to avoid the deleterious effects of the overtraining syndrome. It was hypothesized that the ratio and difference scores of high to low training loads (TRIMP) would be positively related to CAR and OHR, for both the area under the curve relative to the ground (AUCg) and increase (AUCi), as well as the magnitude of change scores for all variables (CARΔ, SupineΔ, StandΔ). However, no significant relationships were found for any variables
with TRIMP, or between CAR and OHR.
Athlete Characteristics
the high (17.5±10.6 km vs. 9.1±4.0 km; p = 0.024) and low (8.1±2.8 km vs. 4.5±1.7 km; p < 0.001) training load days. This variation in distance most likely resulted from the heterogenous sample, with competition distances ranging from 5 km to ultra-marathons, with two male subjects regularly competing in 50 km events, while most female subjects competed in half-marathon (23km) or less. These competitive focus differences would dramatically influence the training distances employed by the athletes.
Cortisol Awakening Response
The cortisol awakening responses observed in the present study were lower to those observed in previous investigations. In 2008, Minetto et. al reported pre-training CARΔ values of
34.2±6.6 prior to a fatiguing week of training and 45.2±9.1 ng/mL post training, compared to CARΔ in this study of 12.1±1.5 ng/mL for the low training days and 16±2.4 ng/mL following
high training load days. Likewise, AUC values in the present study were lower than Minetto et al. (2008) who measured 1412.3±254 ng/mL*30 pre-training, and 1689.3±330.5 ng/mL*30 post-training, compared to the present study: 1356.9±494.9 ng/mL*30 for low training load days and 1360.7 ±528.5 ng/mL*30 for high training load days. However, Wust, Wolf, et al. (2000) examined CAR in 509 adults on two consecutive days, in an attempt to calculate normal values and found concentrations at C0 of 41.7±17.2 ng/mL and C30 of 63.3±25.2 ng/mL, similar to the cortisol concentrations following the baseline days in the present study (C0: 38.6±16.8 ng/mL; C30: 55.4±19.9 ng/mL).
although there is significant agreement that the peak cortisol response tends to occur at
approximately the 30 minute point (Pruessner et al., 1997; Schlotz et al., 2004; Wust, Federenko, Hellhammer, & Kirschbaum, 2000; Wust, Wolf, et al., 2000) with many studies choosing to measure only C0 and C30 (Adam, Hawkley, Kudielka, & Cacioppo, 2006b; Alderling, Theorell, Torre, & Lundberg, 2006; Eller, Netterstrøm, & Hansen, 2006; Gonzalez, Jenkins, Steiner, & Fleming, 2009; Greaves‐Lord et al., 2007; Kallen et al., 2008; O’Donnell et al., 2008; Therrien et al., 2008; Wahbeh et al., 2008; Wichers et al., 2007). Even so, recent recommendations are to sample every 15 minutes for the first hour waking in order to capture the peak response (Stalder et al., 2016). There is clearly a cost-benefit analysis to more frequent sampling, both financially and in terms of dramatically disrupting the normal morning routines of athletes. However, the lack of a relationship, particular between CARΔ and other variables, could also be a result of the
peak cortisol response not being captured by the present sampling methodology.
The lack of a significant relationship between high and low training load day TRIMP scores and CAR was however unexpected. Therefore, it may be appropriate to speculate that CAR is an extremely robust measure of HPA-activity that remains uninfluenced by acute exercise bouts. However, this finding seems to be contradictory to previous investigations that have found variability in CAR in response to several types of global stresses such as chronic fatigue (Roberts et al., 2004), work-related stress (Schulz et al., 1998), burnout (Sonnenschein et al., 2007), and periods of intense exercise (Minetto et al., 2008). Therefore, it is reasonable to suspect a mediating or moderating factor that was previously unaccounted for was resulting in the lack of a significant relationship.
from the physiological load as calculated by TRIMP, was a factor that may have influenced the relationship. External load, defined as “the work completed by an athlete measured
perhaps the uncoupling of the internal and external components could be an indicator of fatigue in athletes (Pyne & Martin, 2011 via Halson, 2014).
To test the hypothesis that external loads were contributing to the responses, a partial correlation between TRIMP ratios and CAR and OHR responses the following day, while controlling for distance, was employed. Consequently, significant moderate to strong
relationships were observed between CAR AUCg ratios and StandΔ difference scores and TRIMP
(see: Chapter IV). It appears therefore, that CAR is not only sensitive to the physiological, internal load of the exercise session as calculated by TRIMP (i.e. duration and heart rate during the exercise), but also the external load of the exercise (i.e. distance). In other words, a high TRIMP that was produced during only a short running distance, or a low TRIMP produced over a greater distance, alters the total load on the athlete and correspondingly affects the CAR response. This is a reasonable suggestion, since acute cortisol responses to exercise are mediated by both the intensity and duration of the training session (McMurray & Hackney, 2000).
Although TRIMP scores accounted for the average HR (intensity) and the duration of the
session, it is likely that the actual intensity, or total training stress, was not captured by these two variables and the training distance also needs to be considered when determining the intensity of the session, even in steady state endurance exercise.
internal load, longer distance training sessions result in a greater variability in terrain,
influencing the neuromechanical demands on the athlete and increasing the total load, which is not subsequently captured by just duration and average HR. Controlling for speed during the training sessions would therefore be an important factor if using CAR to track acute responses to exercise.
Orthostatic Heart Rate
seconds of palpation employed in this study to measure heart rate was; a) not a sensitive enough measure to detect decreases in heart rate following 2 minutes of standing, and/or b) occurred at a time that did not capture the actual peak increases and decreases that were occurring amongst subjects.
Interestingly, as with CAR responses to training load, OHR seems to also be mediated by the distance of the training session. When controlling for distance, the change in HR from
OHRpeak to OHRstand (StandΔ) is negatively correlated with training load from the previous day
(see: Chapter IV). Therefore, as training load increases, the ability of HR to decrease following an initial increase from standing is also diminished. This suggests that following high training loads, athletes present a lower vagal tone and increased sympathetic activity, and that change is detectable by a simple palpated HR test. Again, if OHR is to be utilized as a method of tracking training load, the neuromechanical load (or speed, in endurance runners), is necessary to
consider. There was also a significant difference found between males and females for StandΔ
following both high (p = 0.004) and low (p = 0.024) training load days, but this difference is likely an artifact of the varying distances run by males and females on high and low training days. The lack of a relationship between CAR and OHR suggests that these two phenomena are independent of each other, and although both may be responsive to training load, the
measurements cannot be directly substituted for each other.
Limitations
There were significant limitations encountered throughout this study. Firstly, it must be noted that training loads were calculated as:
This is in comparison to the training load equation presented in Chapter III. The choice to include RPE in the training load equation as opposed to RPE as a method of differentiating high to low training loads was due to; a) a lack of training loads that were separated by >5 RPE points, and b) high/low RPE scores resulting in training load ratios that were inverted. Consequently, two ratios and difference scores were calculated for each subject (Week 1 and Week 2). An initial investigator error in the calculations of training load resulted in the above training load equation being used as opposed to the training load equation based on a percentage of heart rate reserve, as initially proposed. As a consequence, three days selected for the CAR analysis should be considered as the second highest training load from that week, as opposed to the highest, with the average variation between the proposed and actual training load being 0.65%. Even so, clear separation between high and low training loads were achieved. Additionally, TRIMP scores calculated as initially proposed would result in significant
multicollinearity, since OHRsupine would be used to calculate heart rate reserve values. The lack
of variability in OHRsupine throughout the study would result in the same variables being incorporated into both TRIMP and OHR AUCg, AUCi, and SupineΔ, and would result in
interpretation of OHR data difficult compared to the actual TRIMP scores utilized. Even so, when statistically analyzing the results using the initially proposed TRIMP model, no significant differences were observed.
impact this had on biochemical analysis. Additionally, a recent review of the literature has suggested that two-sample CAR protocols (C0 and C30) may lead to “erroneous conclusions” since peak cortisol responses may occur as late as 45 minutes after waking (Stalder et al., 2016). The authors suggest multiple sampling across the waking period in order to appropriately capture the peak response. Unfortunately this recommendation also contributes to increased subject burden and reduces the practicality of such a measure in elite athletes.
A significant limitation of the study was the reliance on subjects to strictly follow saliva and heart rate collection procedures. Subjects were reminded of guidelines at sample collections and given guidance based on individual feedback, but due to the unsupervised nature of this data collection, it is possible that subjects consumed food or drink, or did not adhere to the timeline of saliva collection. Additionally, the food frequency questionnaire data was not analyzed due to lack of Institutional Review Board approval, so it is possible that dietary components influenced the CAR responses.
high load days were perhaps not of a great enough intensity to invoke a large, detectable physiological change,.
Although REST-Q data was collected and analyzed, and no significant changes were observed across the study, it must be noted that each subject was on their own training schedule, making the analysis of the lack of change in REST-Q averages difficult to interpret. Even so, when qualitatively assessing each participants REST-Q scores, no large changes appeared to occur throughout the study, suggesting all athletes were neither over-reaching nor over-training.
Strengths
Even considering the aforementioned limitations, the present study gives valuable insight in the use of both CAR and OHR in monitoring acute training load in athletes. Furthermore, the relationship between CAR and OHR with TRIMP, accounting for external training loads suggests that the incorporation of both of these techniques may be a valuable method of measuring athletes’ responses to specific training loads.