Allosteric Nanobodies Reveal the Dynamic Range and Diverse
Mechanisms of GPCR Activation
Dean P Staus1,*, Ryan T Strachan2,*, Aashish Manglik3,*, Biswaranjan Pani1, Alem W
Kahsai1, Tae Hun Kim4, Laura M Wingler1, Seungkirl Ahn1, Arnab Chatterjee1, Ali Masoudi1, Andrew C Kruse5, Els Pardon6,7, Jan Steyaert6,7, William I Weis3,8, R. Scott
Prosser4, Brian K Kobilka3, Tommaso Costa9, and Robert J Lefkowitz1,10,11
1Department of Medicine, Duke University Medical Center, Durham, North Carolina, 27710, USA
2Department of Pharmacology, University of North Carolina, Chapel Hill, North Carolina, 27599,
USA
3Department of Molecular and Cellular Physiology, Stanford University School of Medicine,
California, 94305, USA
4Department of Chemistry, University of Toronto, UTM, 3359 Mississauga Road North,
Mississauga, Ontario L5L 1C6, Canada
5Department of Biological Chemistry and Molecular Pharmacology, Harvard Medical School,
Boston, Massachusetts, 02115, USA
6Structural Biology Brussels, Vrije Universiteit Brussel, Pleinlaan 2, 1050 Brussels, Belgium
7Structural Biology Research Center, VIB, Pleinlaan 2, 1050 Brussels, Belgium
8Department of Structural Biology, Stanford University School of Medicine, Stanford, California,
94305, USA
9Department of Pharmacology, Istituto Superiore di Sanità, Rome, Italy
10Department of Biochemistry, Duke University Medical Center, Durham 27710, North Carolina,
USA
Users may view, print, copy, and download text and data-mine the content in such documents, for the purposes of academic research, subject always to the full Conditions of use:http://www.nature.com/authors/editorial_policies/license.html#terms
Correspondence and requests for materials should be addressed to R.J.L ([email protected]), B.K.K. ([email protected]), or T.C. ([email protected]).
*Authors contributed equally
Coordinates and structure factors for the β2AR-Nb60-Carazolol complex are deposited in the Protein Data Bank (accession code 5JQH).
The authors declare no competing financial interests. Readers are welcome to comment on the online version of this article at www.nature.com/nature.
Author Contributions D.P.S and R.T.S conceived the project. Pharmacological assessment of the interactions between Nb60 and Nb80 with the β2AR were designed, performed and analyzed by D.P.S., R.T.S, B.P., S.A., and A.C. Formation, purification, and crystallization of the β2AR-Nb60-Carazolol complex was conducted by D.P.S. and A.M. Data collection, refinement, and structural analysis was done by A.M., A.C.K., and A. Masoudi, and W.I.W. NMR spectroscopy was executed by A.M., T.H.K, and supervised by R.S.P. Isothermal titration calorimetry was conducted by A.W.K. Nanobody reagents were provided by E.P. and J.S. Detailed allosteric analysis of radioligand binding data was implemented by T.C. Figures were created by D.P.S., A.M., T.C., L.M.W., R.T.S., and A. Masoudi. Manuscript was written by D.P.S, T.C., R.T.S., L.M.W., A.M., A.K.C, and R.J.L. Overall research was supervised by B.K.K.
HHS Public Access
Author manuscript
Nature
. Author manuscript; available in PMC 2017 January 21.Published in final edited form as:
Nature. 2016 July 21; 535(7612): 448–452. doi:10.1038/nature18636.
A
uthor Man
uscr
ipt
A
uthor Man
uscr
ipt
A
uthor Man
uscr
ipt
A
uthor Man
uscr
11Howard Hughes Medical Institute
Abstract
G-protein coupled receptors (GPCRs) modulate many physiological processes by transducing a variety of extracellular cues into intracellular responses. Ligand binding to an extracellular orthosteric pocket propagates conformational change to the receptor cytosolic region to promote binding and activation of downstream signaling effectors such as G proteins and β-arrestins. It is widely appreciated that different agonists can share the same binding pocket but evoke unique receptor conformations leading to a wide range of downstream responses (i.e., ‘efficacy’)1. Furthermore, mounting biophysical evidence, primarily using the β-adrenergic receptor (β2AR) as
a model system, supports the existence of multiple active and inactive conformational states2–5. However, how agonists with varying efficacy modulate these receptor states to initiate cellular responses is not well understood. Here we report stabilization of two distinct β2AR conformations
using single domain camelid antibodies (nanobodies): a previously described positive allosteric nanobody (Nb80) and a newly identified negative allosteric nanobody (Nb60)6,7. We show that Nb60 stabilizes a previously unappreciated low affinity receptor state which corresponds to one of two inactive receptor conformations as delineated by X-ray crystallography and NMR
spectroscopy. We find that the agonist isoproterenol has a 15,000-fold higher affinity for the β2AR
in the presence of Nb80 compared to Nb60, highlighting the full allosteric range of a GPCR. Assessing the binding of 17 ligands of varying efficacy to the β2AR in the absence and presence of
Nb60 or Nb80 reveals large ligand-specific effects that can only be explained using an allosteric model which assumes equilibrium amongst at least three receptor states. Agonists generally exert efficacy by stabilizing the active Nb80-stabilized receptor state (R80). In contrast, for a number of
partial agonists, both stabilization of R80 and destabilization of the inactive, Nb60-bound state
(R60) contribute to their ability to modulate receptor activation. These data demonstrate that
ligands can initiate a wide range of cellular responses by differentially stabilizing multiple receptor states.
The allosteric behavior of GPCRs is responsible for the complex signaling properties associated with these important regulators of human physiology. GPCR allostery, defined here as a linkage between the extracellular orthosteric ligand pocket and the intracellular G-protein binding pocket, has long been analyzed by pharmacological methods8–10 (see supplemental material for additional information). Conformational changes within a GPCR induced by agonist binding can enhance the affinity and binding of intracellular signaling transducers, such as G-proteins and β-arrestins. Conversely, transducer coupling further enhances agonist affinity, resulting in the formation of the ternary complex of receptor, transducer, and ligand (Fig. 1a). The conceptual framework of the ternary complex model (TCM) equates the magnitude of these affinity changes with the strength of transducer activation in cells11,12, as demonstrated for several GPCR systems13–16. However, the structural basis underlying these allosteric relationships and how they relate to ligand efficacy is not well understood.
Ligand-dependent GPCR activation has traditionally been conceptualized as a conversion between a single inactive and a single active receptor state. However, recent studies utilizing various spectroscopic techniques have identified multiple inactive and active receptor states,
A
uthor Man
uscr
ipt
A
uthor Man
uscr
ipt
A
uthor Man
uscr
ipt
A
uthor Man
uscr
suggesting that the mechanisms underlying receptor activation may be more complex than previously thought2–5. To better understand how ligands with varying efficacies may differentially regulate these conformations, we sought to develop reagents to stabilize specific inactive and active conformations of the β2AR. We and others have previously
utilized Nb80, a Gs mimetic nanobody, to stabilize an active conformation of the β2AR6,7.
Indeed, competition radioligand binding assays using iodinated cyanopindolol ([125I]-CYP) and β2AR reconstituted into high-density lipoprotein (HDL) particles (nanodiscs)
demonstrated that Nb80 increases the affinity of the agonist isoproterenol (ISO) by 75 fold (Fig. 1b), which is similar, but not identical, to the 33 fold increase seen in the presence of purified heterotrimeric Gs (Fig. 1b). To investigate the pharmacological properties of the inactive receptor we identified a nanobody (Nb60) that preferentially bound inverse agonist-bound β2AR7. Remarkably, though the affinity of the receptor for agonist in the absence of
Gs or Nb80 was presumed to reflect the pharmacological properties of the inactive state, the presence of Nb60 reduced agonist affinity by approximately 70 fold (Fig. 1b). The effects of Nb60 and Nb80 on radiotracer affinity were negligible and could not account for the large changes in affinity (Extended Data Table 1).
To further quantitate the allosteric effects of Nb60 and Nb80/Gs on agonist binding, we measured ISO affinity with radioligand competition binding over a range of nanobody/Gs concentrations (Extended Data Figure 1). As the concentration of allosteric modulator increases, the effect on ISO affinity becomes saturable, reaching two opposite plateau values with Nb60 and Nb80/Gs (Fig. 1c). This is a hallmark pattern of true allosteric interactions, with the net log-change in ISO affinity at saturating concentration of nanobody/Gs gauging the extent of cooperativity between nanobody and agonist binding (negative for Nb60 or positive for Nb80/Gs) (see supplemental information). As predicted by the TCM, this coupling energy, termed α, must be constant; i.e. the effect of bound nanobody on agonist binding is reciprocal to the effect of bound agonist on nanobody binding. To verify such a prediction, we measured the affinity of Nb60 for the β2AR in the absence and presence of
agonist (ISO) using isothermal titration calorimetry (Fig. 1d, e). As expected the affinity of Nb60 for β2AR decreased in the presence of ISO. Consistent with its preference for the
inactive state, Nb60 dose-dependently increased binding of the radiolabeled inverse
antagonist [3H]-ICI-118,551 to the β2AR, whereas binding was decreased in the presence of
Nb80 (Fig. 1f). Taken together, these data show that Nb60 and Nb80 are potent allosteric modulators that can be used to stabilize inactive and active β2AR states.
The decrease in ISO affinity observed in the presence of Nb60 reveals a previously unappreciated “very low affinity” state (KVL) in competition binding experiments. The
affinity of agonist for an uncoupled GPCR has traditionally been referred to as the “low affinity” (KL) state; however, our results show that KL values reflect binding of an ensemble
of conformations that exchange rapidly over the course of the binding reaction. This phenomenon is likely conserved among GPCRs as a similar KVL state has been observed
with the A(2A) adenosine receptor using an antibody fragment17. This conformational heterogeneity is consistent with recent spectroscopic and computational studies, which have shown that the β2AR exists in multiple inactive, intermediate, and active conformations that
exchange within milliseconds2–5,18. To assess which receptor state Nb60 stabilizes, we conducted 19F-fluorine NMR spectroscopy of β2AR labeled with a trifluoroacetanilide probe
A
uthor Man
uscr
ipt
A
uthor Man
uscr
ipt
A
uthor Man
uscr
ipt
A
uthor Man
uscr
at the endogenous residue C265 located at the cytoplasmic end of transmembrane 6 (TM6). As shown previously, the unliganded β2AR exists in two equally distributed inactive states
(termed S1 and S2) that exchange on a fast timescale (700 ± 137 µs), and complete
conversion into the active S4 state requires both agonist and transducer binding (Fig. 2a,b)5. Using structural insights from double electron-electron resonance studies, S1 was identified as an inactive state with an interaction between TM3 residue R1313.50 (superscripts indicate Ballesteros-Weinstein numbering for GPCRs19) and E2686.30 in TM65, commonly termed the ionic lock. The ionic lock has previously been shown to be important in maintaining the inactive conformation of β2AR, as charge neutralizing mutations at these positions increase
receptor constitutive activity20. Additionally, the S2 conformation was also identified as an inactive state but with a disengaged ionic lock (Fig 2b). The binding of G-protein or other positive allosteric modulators such as Nb80 lowers the energy of the active receptor states, driving the receptor from S2 towards active conformations5. The 19F-NMR spectra showed that the addition of Nb60 to β2AR bound to the inverse agonist carazolol shifted the S1–S2
equilibrium towards the inactive S2 state (Fig. 2c), providing a mechanism for its negative cooperative effects on ISO affinity. Given the broad NMR line shape (Fig. 3c, red line) of the
β2AR when bound to carazolol and Nb60, we conducted Carr-Purcell-Meiboom-Gill
(CPMG)21 relaxation dispersion measurements to measure potential conformational heterogeneity. Indeed, we found that the β2AR when bound to Nb60 and carazolol
interconverts (860 +/− 530 s−1) between S1 and S2 but is predominantly found (75–90%) in the S2 inactive state (Extended Data Figure 1d).
To further decipher how Nb60 induces a negative cooperative effect on agonist binding, we determined a 3.2Å X-ray crystal structure of a ternary complex comprised of β2AR, Nb60,
and the inverse agonist carazolol (Fig. 2d–f, Extended Data Figure 2, Extended Data Table 2). The complementary determining region 3 (CDR3) of Nb60 inserts into a similar β2AR
allosteric pocket as G-protein and Nb80, located between the cytoplasmic ends of TM3, TM4 and TM6 (Fig. 2d, e). We found that T102 and Y106 in Nb60 bridge an interaction between residues R1313.50 and E2686.30. This interaction does not exist in the absence of Nb60 (PDB ID: 2RH1), indicating that Nb60 stabilizes an inactive conformation through interactions with the β2AR ionic lock (Fig. 2e). However, this polar network appears
“disengaged” compared to the fully closed ionic lock in the β1-adrenergic receptor (PDB ID:
2YCW22) (Fig. 2e), thus supporting the 19F-NMR data showing that Nb60 specifically stabilizes the S2 inactive state. The insertion of Nb60 F103 into a hydrophobic pocket in the
β2AR may also contribute to the affinity and/or negative allosteric properties of Nb60
(Extended Data Figure 2c). Confirming the importance of T102 and F103 for the β2
AR-Nb60 interaction, alanine mutations at these positions inhibited AR-Nb60 binding to the β2AR
and the negative cooperative effects on ISO binding (Extended Data Figure 2e,f). Other than changes within the ionic lock, the overall structure of β2AR bound to Nb60 is highly similar
to the previously determined inactive β2AR structure bound to carazolol alone (RMSD 0.3 Å
for the transmembrane domains and orthosteric binding pocket, Fig. 2f). Taken together, the pharmacological, biophysical, and crystallographic studies show that Nb60 exerts its negative allosteric effect on agonist binding by stabilizing the S2 inactive β2AR
conformation.
A
uthor Man
uscr
ipt
A
uthor Man
uscr
ipt
A
uthor Man
uscr
ipt
A
uthor Man
uscr
Our observation that ISO bound to the Nb80-stabilized active β2AR with approximately
15,000-fold greater affinity than to the Nb60-stabilized inactive β2AR (Fig. 1b and c)
provides a measurement of the full allosteric power of an agonist to activate a GPCR. The large free energy difference (−24 kJ/mol) between these states is likely important for GPCR function, allowing agonist-stimulated activity to be significantly higher than that of the basal activity. As simulated for a full agonist in Figure 3a, the overall affinity shift from inactive to active receptor (black arrow) is comprised of two components, the negative cooperative effects of Nb60 (αNb60, blue) and positive effects of Nb80 (αNb80, red). Given the complexities and limitations of using NMR and crystallography to gain mechanistic insights into ligand activation of a GPCR, we utilized a pharmacological approach to quantify
αNb60 and αNb80 for 17 β2AR ligands of varying efficacy (Fig. 3b, Extended Data Figure
3).
We first identified a significant positive correlation (r = 0.8514, p = 0.004) between αNb80 values (i.e., KL/KH ratios) and the relative intrinsic efficacies (i.e., τ ratios) of various
ligands obtained from cellular G-protein assays (Extended Data Figure 4a–b). This finding provides additional support for the claim that Nb80 exerts allosteric effects that mimic those of a G protein. It also confirms our previous reports that ligand efficacy is not a product of modified downstream signaling events but is rather achieved at the level of ternary complex interactions, reflecting the allosteric interactions between different ligands and
‘transducers’12. Interestingly, we find no significant correlation between αNb60 and ligand efficacy, providing the first evidence that ligands perceive the Nb60 and Nb80 stabilized receptor states differently (Extended Data Figure 4c). Next we observed a significant negative correlation (r = 0.7417, p = 0.0013) between αNb60 and αNb80 values (Fig. 3c) across all ligands, suggesting these nanobodies stabilize functionally opposite
conformations. However, the relationship between αNb60 and αNb80 was unexpectedly complex (Fig. 3b). For example, several full agonists exhibited comparable levels of positive (Nb80) and negative (Nb60) cooperativity (i.e., norepinephrine, epinephrine, and
isoproterenol), while some partial agonists displayed surprisingly discrepant patterns (i.e., clenbuterol, salbutamol, and zinterol) (Fig. 3b). Importantly, for a subset of these ligands we confirmed that the allosteric effects of Nb80 are consistent with those elicited by the physiological transducer heterotrimeric Gs (Extended Data Figure 5a,b), Moreover, the surprisingly divergent, ligand-specific effects of Nb60 were also observed with another inactive state-stabilizing nanobody, A11 (Extended Data Figure 5c). Together, these data indicate that the ligand-specific effects of Nb80 and Nb60 are not nanobody-specific but rather reflect how ligands perceive specific receptor conformations.
We next tested two different allosteric models to try to explain how the different
conformations stabilized by Nb60 and Nb80 can generate the observed cooperativities. First we tested whether the dynamics of receptor states can be sufficiently modeled as a simple interconversion between two allosteric conformations, despite biophysical evidence for multiple inactive and active receptor states. Accordingly we attempted to fit the
experimentally observed αNb60 and αNb80 values for all ligands using the two-state model of receptor activation (Fig. 4a). In this simulation, the equilibrium constant J represents the distribution of inactive (R60) and active (R80) receptor states in the absence of ligand. The
variable β describes the effect that each ligand has on the distribution of receptor states (J),
A
uthor Man
uscr
ipt
A
uthor Man
uscr
ipt
A
uthor Man
uscr
ipt
A
uthor Man
uscr
with agonists displaying larger β values (i.e., they stabilize more R80 relative to R60). As
shown in Figure 4a, the theoretical curve generated by varying β in the two-state model (dotted black line) failed to accurately predict the experimentally determined αNb60 and
αNb80 values for 30% of ligands tested, consisting primarily of partial agonists (dotted red oval). A different equilibrium J constant would be required to explain the cooperativity of these ligands with the same two-state model. These findings argue that ligands must modulate more than these two states to control receptor activation.
Biophysical evidence supports the existence of at least three predominant receptor states; therefore we hypothesized that a three-state model (Fig. 4b) may better explain the
experimentally observed αNb60 and αNb80 values. In this model, the equilibria of R80 (J1)
and R60 (J2) can be regulated separately by ligands, described by the allosteric factors β1 and β2, respectively. We found that the observed cooperativities for 12 ligands (Fig. 4b, class I,
orange), which encompasses all the full agonists, can be predicted if these ligands primarily stabilize the active R80 state while having negligible effects on the inactive R60 state. The
efficacy of these ligands is thus directly proportionally related to their effect on the R80
equilibrium (β1), such that highly efficacious ligands have a large β1 (i.e., epinephrine) while
partial agonists have a lower β1 (i.e., clenbuterol). In contrast, the observed cooperativity of
other partial agonists (classes II and III) could only be predicted by differentially modulating the R80 and R60 equilibria, suggesting these ligands regulate multiple receptor states to
control receptor activation. For example, even though clenbuterol (CLEN, class I), zinterol (ZINT, class II), and procaterol (PROC, class III) are similar partial agonists (Extended Data Figure 4a), the mechanism by which they promote receptor activation varies based on their ability to differentially stabilize and destabilize the active (R80) and inactive (R60) states,
respectively (Fig. 4b). Importantly, divergences in receptor activation mechanisms can only be uncovered by studying ligand effects at both the Nb60- and Nb80-stabilized β2AR states.
The inability to accurately predict efficacy (G-protein activation) based on ligand class supports the notion that molecular efficacy is a complex process that likely involves many more unresolved receptor states.
Our findings significantly reshape current understanding of GPCR activation. For almost 40 years, studies of these receptors have been guided by the understanding that they can exist in two forms, one of high affinity for agonists (active, coupled to G-protein) and one of low affinity (inactive, not coupled to G-protein), which are interconverted by the cooperative interaction of agonists and guanine nucleotides. We used conformationally sensitive
nanobodies (Nb60, Nb80) to reveal that Nb60-bound β2AR has affinity ~100-fold lower than
the previously described low affinity inactive state, which is in fact an “average” of multiple, rapidly interconverting inactive and active states. The implication is that the full allosteric potential of the β2AR is orders of magnitude greater than formerly appreciated. Moreover,
binding cooperativity between ligands of varying efficacy and Nb60 and Nb80 could only be explained by models featuring multiple (at least three) receptor states, which are
differentially stabilized and/or destabilized by various agonists. Thus these data demonstrate a previously unsuspected heterogeneity in the mechanisms by which different agonists stimulate biological responses. In view of the general conservation of GPCR activation mechanisms, and a report of an A2A adenosine receptor “Nb60-like” state, these findings will likely apply to many GPCRs. Given the primacy of GPCRs as therapeutic targets, these
A
uthor Man
uscr
ipt
A
uthor Man
uscr
ipt
A
uthor Man
uscr
ipt
A
uthor Man
uscr
new findings and concepts may also provide a basis for the design of drugs with potentially novel therapeutic properties.
Methods
β2AR reconstitution in HDL particles
Human β2AR containing an amino-terminal FLAG epitope tag, carboxyl-terminal HIS-tag,
and a N187E glycosylation mutation was expressed in Sf9 insect cells using the BestBac baculovirus system (Expression systems; Davis, CA). Cells were infected at a density of 3 × 10⁶ cells/mL and harvested 66 hours thereafter. Functional FLAG-β2AR was purified using
FLAG-M1 antibody and alprenolol affinity chromatography as previously described23. FLAG-β2AR was reconstituted into HDL particles (nanodiscs) according to previously
published methods24. In brief, FLAG-β2AR was incubated with a 50-fold molar excess of
membrane scaffold protein 1 (MSP1) and 8 mM POPC:POPG (3:2 molar ratio) for 1 hour at 4°C. Detergent was removed via biobeads overnight at 4°C, and receptor-containing nanodiscs were isolated using FLAG-M1 chromatography and size exclusion chromatography.
Nanobody and Gs purification
Nanobodies were generated and purified as previously described6. In brief, Nb60 and Nb80 clones were originally obtained from one llama (Lama glama) immunized with β2AR
(truncated at residue 365) reconstituted into liposomes bound to the high affinity agonist BI-167107. Nanobody coding sequences were amplified from isolated lymphocyte RNA and cloned into phage display vector. Conformationally selective nanobodies were isolated using a series of biopanning procedures targeted against native receptor bound to agonist.
Nanobodies were grown in E. coli WK6 cells and purified from the periplasmic extract using nickel-agarose and resource S ion exchange chromatography. Heterotrimeric Gs protein was expressed in and purified from Sf9 insect cells using nickel-agarose and ion exchange chromatography as described previously25.
Radioligand binding assays
Competition binding assays (250 µL) contained 60 pM [125I]-CYP, a serial dilution of competitor, the indicated concentration of nanobody/Gs, and approximately 0.5 ng of β2AR
nanodiscs diluted in assay buffer (50 mM Tris-HCl pH 7.4, 12.5 mM MgCl2, 2 mM EDTA,
0.05% BSA, 1mM L-ascorbic acid). Total binding was determined in the absence of competitor; nonspecific binding was determined using 10 µM propranolol. Following a 90 min incubation at room temperature, binding assays were terminated by rapid filtration onto GF/B glass-fiber filters treated with 0.3% PEI and washed with 8 mL of cold binding buffer using a harvester (Brandel, Gaitherburg, MD). Bound [125I] was quantified using a Packard Cobra Quantum gamma counter (Packard, San Diego, CA) and expressed as specific binding. For [3H]-ICI 118,551 binding, 10 ng of β2AR nanodiscs were incubated with 0.3
nM radioligand and varying concentrations of nanobody and were harvested as described above. [I125]-CYP affinity was determined using saturation binding (Extended Data Table 1). All binding data represent a minimum of three independent experiments with deviation represented as standard error.
A
uthor Man
uscr
ipt
A
uthor Man
uscr
ipt
A
uthor Man
uscr
ipt
A
uthor Man
uscr
Isothermal Titration Calorimetry (ITC)
ITC experiments were carried out using the MicroCal iTC200 system. β2AR and Nb60,
purified as described above, were both dialyzed against a buffer consisting of 20 mM HEPES pH 7.5, 100 mM NaCl, 0.01% Lauryl Maltose Neopentyl Glycol (MNG), and 0.001% cholesteryl hemisuccinate (CHS). Protein concentrations were determined by measurement of the absorbance at 280 nm, using molar extinction coefficient per cm parameters of each protein (ε for β2AR: 66350 cm−1 and Nb60: 21430 cm−1). Nb60 at 100
µM concentration (40 µL) was loaded into the syringe and titrated into the 200 µL sample cell containing β2AR (10 µM) in absence or presence of 200 µM ISO. Titrations were
performed at 25 °C using an initial injection of 0.5 µL, followed by 2.3 µL injections (1 s duration, 300 s spacing, and 5 s filter period). Reference power was set to 10 µcal s−1 and stirring speed to 750 r.p.m. Reference titrations were obtained by injecting Nb60 alone or Nb60 with agonist (ISO) into sample cells containing buffer alone. To obtain the
stoichiometry (N) and association constant (KA) of the interaction, the raw data were
baseline corrected, peak area integrated, and fitted to a one-site non-linear least squares fit model using the Origin®7 software program. Binding experiments were performed at least twice to calculate standard deviations.
Enzyme-linked immunosorbent assay (ELISA) for determining Nb KT
The affinity of each nanobody for the unliganded β2AR (KT) was required for TCM data
analysis. Briefly, 50 ng of carboxypeptidase-treated (to remove His6 tag), biotinylated β2AR
nanodiscs were immobilized per well of a 96-well SigmaScreen Streptavidin plate in binding buffer (20 mM HEPES pH 7.4, 100 mM NaCl, 2 mM EDTA). Following a 3 hr incubation at RT, plates were washed four times with binding buffer and incubated with serial dilutions of nanobody in binding buffer with 0.1% milk for 2 hr at RT. Plates were quickly washed three times with binding buffer and then incubated with polyclonal anti-His HRP-conjugated antibody (1:5000, Abcam) in binding buffer with 0.1% milk for 1 hr at RT. Plates were quickly washed three times with binding buffer and bound nanobody was detected
colorimetrically (OD450nm) on a NovoStar plate reader (BMG Labtech) using TMB Ultra
1-step substrate as described by the manufacturer (Pierce).
Crystallization of β2AR-carazolol-Nb60 complex
For crystallography trials, we utilized a previously described fusion protein of human β2AR
with an amino-terminal T4 lysozyme (T4L) fusion and a truncated intracellular loop three26. The T4L-β2AR fusion protein was expressed and purified as described above. Purified
receptor was incubated with 5- and 2-fold molar excess of carazolol and Nb60, respectively. The β2AR-carazolol-Nb60 complex was incubated overnight at 4°C and further purified by
size exclusion chromatography over a Sephadex S200 column in a buffer comprised of 20 mM HEPES pH 7.5, 100 mM NaCl, 0.01% MNG, and 0.001% CHS. The purified complex was concentrated to 37.5 mg/ml and flash frozen in liquid nitrogen for crystallization trials. We utilized the in meso crystallization method with a 10:1 (w/w) mix of 7.7
monoacylglycerol (MAG 7.7) and cholesterol as the host lipid (Avanti Polar Lipids). Samples were thawed and reconstituted with the host lipid at a 1:1 ratio with the two-syringe mixing method until a clear phase was achieved. The resulting lipidic cubic phase was
A
uthor Man
uscr
ipt
A
uthor Man
uscr
ipt
A
uthor Man
uscr
ipt
A
uthor Man
uscr
dispensed in 35 nL drops onto glass sandwich plates using a GryphonLCP robot (Art Robbins Instruments). Crystals grew in a precipitant solution comprised of 100 mM HEPES pH 7.5, 20 mM EDTA, and 19–23% PEG300. Although crystals appeared in 2–3 days, the best diffraction was obtained from crystals that grew over 30 days. Crystals were harvested with mesh loops (Mitegen) and flash frozen in liquid nitrogen.
Data collection and refinement
X-ray diffraction was collected at the Advanced Photon Source GM/CA beamline 23ID-B. As with previous in meso crystallography of GPCRs, crystals suffered considerable radiation damage during data collection. Typically, 20–60 degree wedges of data were collected using a 20 µm beam. The resulting diffraction data from 10 crystals were processed in
HKL200027. The structure of the β2AR-carazolol-Nb60 complex was solved by molecular
replacement using carazolol-bound β2AR with the T4 lysozyme removed (PDB ID: 2RH1)
and a structure of Nb60 solved to 1.8Å as search models in Phaser28. The model was refined iteratively in Phenix29 with manual rebuilding in Coot30 with and without averaging of non-crystallographic symmetry. The quality of the final model was assessed using MolProbity31 and refinement statistics are presented in Extended Data Table 2. Figures were prepared using PyMOL (Schrödinger). The RMSD analysis for the orthosteric binding pocket was performed in PyMOL by measuting residues within 4Å of the ligand carazolol between
β2AR-Nb60-Cz and 2RH1.
19F-NMR of β
2AR
19F-fluorine NMR studies were conducted as previously described5. Briefly, full-length β2AR with four cysteine mutations (C77V, C327S, C378A, and C406A) was expressed in
Sf9 cells, extracted using dodecylmaltoside, and purified initially by M1 FLAG affinity chromatography. The receptor sample was subsequently labeled with a
bromotrifluoroacetanilide probe at a 5-fold stoichiometric excess and purified by alprenolol-sepharose and M1 affinity chromatography. As done for previous 19F-NMR experiments, the detergent was gradually exchanged to 0.01% lauryl maltose neopentyl glycol (MNG, Anatrace). The final receptor sample was concentrated to 200 µM and a 2.5-fold molar excess of carazolol was added prior to acquisition of NMR data. After acquisition of signal for the β2AR-carazolol complex, Nb60 was added to a 2.5-fold molar excess, and 19F-NMR
spectra were obtained for the β2AR-carazolol-Nb60 complex. NMR studies were performed
at 25°C on a 600 MHz Varian Innova spectrometer equipped with a cryogenic probe capable of 19F-NMR (600 MHz). All spectral processing was performed using Mnova 9.0.0
(Mestrelab Research). Additional information on data processing and line shape simulations are described in detail elsewhere5. 19F CPMG relaxation data were recorded by applying CPMG frequencies ranging from 500 to 5000 Hz at 600 MHz with a constant time of 2 ms. CPMG profiles were fitted to a two state model with Chemex as described elsewhere32. The 19F π/2 pulse width was 19 µs.
Fitting of binding curves with the Ternary Complex Model
The allosteric effect of nanobodies on the binding of receptor ligands is quantified by the cooperatvity factor α. Its magnitude is given by a ratio of dissociation constants (i.e., KL/KH
for Nb80 and KL/KVL for Nb60) determined from the comparison of how each ligand binds
A
uthor Man
uscr
ipt
A
uthor Man
uscr
ipt
A
uthor Man
uscr
ipt
A
uthor Man
uscr
to β2AR in the absence of versus the saturating presence of each Nb (Extended Data Figure
3). However, under conditions in which the nanobody concentration is sub-saturating or the radiotracer α is not exactly 1, experimental Kd ratios may underestimate the size of the cooperativity factor. To improve measurements of Nb/ligand α values, we fitted the binding curves with a mathematical function derived from TCM. This entails solving the following nonlinear system of equations that yield the concentration of free species for a binding reaction consisting of one receptor (R), one Nb (N) and n ligands (Li) at equilibrium:
where subscripts f and t indicate respectively free and total concentrations and the equilibrium binding constants of ligands (K) and nanobody (M) are defined as in
supplemental (analysis of binding cooperativity). Exact numerical solutions were obtained using a globally convergent iterative algorithm33, which was coded as add-in function for MS-Excel34. The built-in optimizer “Solver” was used to minimize the sum of squares difference between predicted and experimental data (choosing the Newton search option and setting convergence threshold at 10−12). Sets of 3 curves representing bound radiotracer as a function of increasing concentrations of unlabeled ligand, obtained in the absence and presence of Nb80 or Nb60, were fitted simultaneously. Known parameters are the M of each Nb (Extended Data Figure 6), the K and α value of [125I]-CYP (Extended Data Figure 1). Unknown fitted parameters are: non-specific tracer binding, receptor concentration and K value of the competing ligand (both shared across the 3 curves), and the individual αNb80,
αNb60 values for each ligand/Nb pair. For data measured in the presence of Gs (the M value of which was not available), all ligands curves were fitted globally and constrained to share a common best-fitting M. This fitted value was close to that experimentally measured for Nb80.
A
uthor Man
uscr
ipt
A
uthor Man
uscr
ipt
A
uthor Man
uscr
ipt
A
uthor Man
uscr
Extended Data
Extended Data Figure 1. Characterization of Nb60 interaction with β2AR
Competition equilibrium binding studies using [125I]-cyanopindolol (CYP), the cold competitor agonist isoproterenol (ISO), β2AR in HDL particles, and the indicated concentration of (a) Nb80, (b) Gs, or (c) Nb60. Dotted vertical line represents logIC50 in absence of modulator, and the change in ligand affinity is depicted with colored arrows. (d)
19F-NMR CPMG relaxation dispersion experiment with β
2AR-Nb60-Carazolol (Cz). Kex –
Exchange Rate. (e) Competition equilibrium binding studies using [125I]-CYP, the non-labeled competitor agonist ISO, β2AR in HDL-particles, and 1 µM Nb60 WT or T102A/ F103A. (f) ELISA depicting capture of β2AR by Nb60 or the T102A/F103A variant. Inset: Coomassie stain of nanobody input. Radioligand binding and ELISA experiments were performed at least three times with deviation shown as standard error.
A
uthor Man
uscr
ipt
A
uthor Man
uscr
ipt
A
uthor Man
uscr
ipt
A
uthor Man
uscr
Extended Data Figure 2. Characterization of β2AR-Nb60-carazolol crystals
(a) Monodispersity of T4L-β2AR-Nb60-carazolol (β2AR-Nb60-Cz) complex as assessed by size exclusion chromatography. Inset: Coomassie stain illustrating presence of β2AR and Nb60 in fractions combined for crystallography. (b) Representative picture of β2 AR-Nb60-Cz lipidic cubic phase (LCP) crystals. (c) Insertion of F103 (green) from Nb60 CDR3 (purple) into hydrophobic β2AR pocket, nitrogen and oxygen shown as blue and red shaded
surfaces, respectively. (d) Example of β2AR-Nb60-Cz crystal lattice. (e) Electron density
2FO-FC map (Sigma: 1) of carazolol binding pocket (top panels) Nb60 CDR3 binding pocket (bottom panels) within β2AR.
A
uthor Man
uscr
ipt
A
uthor Man
uscr
ipt
A
uthor Man
uscr
ipt
A
uthor Man
uscr
Extended Data Figure 3. Differential effects of Nb60 and Nb80 on the affinity of 12 different
β2AR ligands
Competition equilibrium binding studies using [125I]-cyanopindolol (CYP), the indicated non-labeled competitor, β2AR in HDL-particles, and 1 µM of Nb60 or Nb80. Data represent at least three independent experiments with deviation depicted as standard error.
A
uthor Man
uscr
ipt
A
uthor Man
uscr
ipt
A
uthor Man
uscr
ipt
A
uthor Man
uscr
Extended Data Figure 4. Agonist induced G-protein activation in cellulo correlates with the magnitude of affinity change mediated by Nb80 in vitro
(a) Table representing cell signaling and ligand affinity data. Ligand-dependent G-protein
activation was quantified by measuring cAMP levels (GloSensor, Promega) from HEK293 cells over-expressing β2AR. Ligand affinity was measured in membranes prepared from the
same cells as above using competition binding assays with [125I]-CYP. Ligand efficacy (log Tau) was calculated as previously described36. See methods and supplemental material for cooperativity (α) determination. Correlation plot of logTau and αNb80 (b) or αNb60 (c). All data represent at least three independent experiments with deviation shown as standard error.
A
uthor Man
uscr
ipt
A
uthor Man
uscr
ipt
A
uthor Man
uscr
ipt
A
uthor Man
uscr
Extended Data Figure 5. Positive correlation between allosteric properties of Nb80 and Gs
(a) Equilibrium binding studies using HDL-β2AR, [125I]-cyanopindolol, the indicated
unlabeled competitor, and 100 nM purified heterotrimeric Gs-protein. (b) Correlation plot of cooperativity values (α) for Nb80 and Gs. (c) Sequence alignment of Nb60 and NbA11. Radioligand competition binding studies with Nb80, Nb60 or NbA11, [125I]-cyanopindolol, the unlabeled competitor isoproterenol or clenbuterol, and HDL-β2AR. All data represent at least three independent experiments with deviation shown as standard error.
A
uthor Man
uscr
ipt
A
uthor Man
uscr
ipt
A
uthor Man
uscr
ipt
A
uthor Man
uscr
Extended Data Figure 6. Affinity determination for Nb60 and Nb80 for unliganded β2AR ELISA assay detecting capture of increasing concentrations of Nb60 or Nb80 by immobilized HDL-β2AR in the absence of ligand. All data represent at least three independent experiments with deviation shown as standard error.
Extended Data Figure 7. Theoretical framework illustrating the two views of allostery (a) Nested reaction schemes at equilibrium indicating the correspondence (arrowed light-blue shades) between binding site cooperativity (TCM in outer box) and changes of allosteric conformations (inner cubes). Arrows stand for reversible equilibrium interactions. (b) Change of the macroscopic dissociation constant (1/K) of a ligand L (shifting the
A
uthor Man
uscr
ipt
A
uthor Man
uscr
ipt
A
uthor Man
uscr
ipt
A
uthor Man
uscr
equilibrium towards r1) induced by increasing the concentrations of nine different N-ligands
with diverse allosteric effects (γ1, γ2) on receptor states. Simulations were made using a
3-state model based on the parameter values listed on the right side of the plot (curves on the left side are color coded in red/blue tones according to right-side boxes). The change in K (i.e. log difference between presence and absence of N) is calculated from eq. 1 in SI (Analysis of nanobody allostery).
Extended Data Figure 8. Comparison of experimental and theoretical cooperativities predicted according to a 2-state (a–d) or 3-state (e, f) allosteric models
A
uthor Man
uscr
ipt
A
uthor Man
uscr
ipt
A
uthor Man
uscr
ipt
A
uthor Man
uscr
(See also SI, “Analysis of nanobody allostery.”) (a–d d) Theoretical log α values were computed according to a 2-state model for a series of hypothetical ligands (L) (log β1 range: −4/8) and a positive (PAN, log γ1 >>0) or negative (NAN, log γ1 << 0) nanobody. (a) Observed data overlaid on values simulated at J1 = 8.9 × 10⁻⁴ in histogram form (with
experimental bars drawn on the closest theoretical log β1 bin value), or superimposed (b) on
the log αNAN vs. log αPAN relationships predicted for different J1 values. The same data are
replotted as separate graphs for lower J1 (c) and larger J1 (d) values, to show the sigmoid relationships existing between macroscopic log α’s and log β1. (e, f) Simulations made according to the 3-state allosteric model: (e) predicted (lines) and observed (circles) log α
values plotted as functions of log (β1/β2). Three groups of ligands (I to III, defined by the
table of a0 and m parameters) produce increasingly stronger reductions of r2 equilibrium. (f)
Same data plotted as log αNb60 vs. log αNb80 relationships (see fig. 4, main paper). All α
values derived from at least three independent radioligand binding experiments with deviation depicted as standard error.
Extended Data Table 1
Effect of Nb60 and Nb80 on [125I]-Cyanopindolol affinity.
[125l]-Cyanopindolol Affinity Kd Ratio
Kd (pM) SEM Control/Nb SEM
Control 737.3 92.9 ----
----Nb80 315.6 62.4 2.5 0.35
Nb60 663.0 17.7 1.1 0.12
Extended Data Table 2
Data collection and refinement statistics (molecular replacement).
β2AR-Carazolol-Nb60a
Data collectionb
Space group P212121
Cell dimensions
a, b, c (Å) 43.9, 164.5, 218.8
α, β, γ (°) 90.0, 90.0, 90.0
Resolution (Å) 32.9–3.2 (3.30–3.20)
Rmerge (%) 17.5 (89.6)
<I/σI> 5.3 (1.5)
CC1/2 (%) 98.6 (82.4)
Completeness (%) 98.6 (95.5)
Redundancy 5.5 (4.6)
Refinement
Resolution (Å) 32.9–3.2 (3.30–3.20)
Number of reflections 26,778
Rwork/Rfree (%) 24.7/29.0 (38.3/43.9)
A
uthor Man
uscr
ipt
A
uthor Man
uscr
ipt
A
uthor Man
uscr
ipt
A
uthor Man
uscr
β2AR-Carazolol-Nb60a
Number of atoms
Protein 7,703
Ligand (Carazolol) 44
Solvent (lipid, water, other) 56
B-factors (Å2)
Protein 129.81
Ligand (Carazolol) 116.36
Solvent (lipid, water, other) 157.51
R.M.S. deviation from ideality
Bond lengths (Å) 0.003
Bond angles (°) 0.429
Ramachandran statisticsc (%)
Favored 96.8
Allowed 3.2
Outliers 0
a
Diffraction data from 10 crystals were merged into a complete data set. b
Highest resolution shell statistics are shown in parentheses. c
As calculated by Molprobity.
Supplementary Material
Refer to Web version on PubMed Central for supplementary material.
Acknowledgments
We thank Darrell Capel and Xinrong Jiang for technical assistance. Administrative and secretarial support was provided by Victoria Ronk, Katherine Harley, Donna Addison and Quivetta Lennon. We acknowledge support from the National Institute of Health Grants NS028471 (B.K.K), T32HL007101 (D.P.S, L.M.W), HL16037 and HL70631 (R.J.L), from the Stanford Medical Scientist Training Program and the American Heart Association (A.M.), Italian Ministry of Health, grant RF-2011-02351158 (T.C.), and from the Mathers Foundation (B.K.K. and W.I.W.). R.J.L. is an investigator with the Howard Hughes Medical Institute.
References
1. Kahsai AW, et al. Multiple ligand-specific conformations of the beta2-adrenergic receptor. Nat Chem Biol. 2011; 7:692–700. [PubMed: 21857662]
2. Liu JJ, Horst R, Katritch V, Stevens RC, Wuthrich K. Biased signaling pathways in beta2-adrenergic receptor characterized by 19F-NMR. Science. 2012; 335:1106–1110. [PubMed: 22267580] 3. Kofuku Y, et al. Efficacy of the beta(2)-adrenergic receptor is determined by conformational
equilibrium in the transmembrane region. Nature communications. 2012; 3:1045.
4. Nygaard R, et al. The dynamic process of beta(2)-adrenergic receptor activation. Cell. 2013; 152:532–542. [PubMed: 23374348]
5. Manglik A, et al. Structural Insights into the Dynamic Process of beta2-Adrenergic Receptor Signaling. Cell. 2015; 161:1101–1111. [PubMed: 25981665]
6. Rasmussen SG, et al. Structure of a nanobody-stabilized active state of the beta(2) adrenoceptor. Nature. 2011; 469:175–180. [PubMed: 21228869]
7. Staus DP, et al. Regulation of beta2-adrenergic receptor function by conformationally selective single-domain intrabodies. Molecular pharmacology. 2014; 85:472–481. [PubMed: 24319111]
A
uthor Man
uscr
ipt
A
uthor Man
uscr
ipt
A
uthor Man
uscr
ipt
A
uthor Man
uscr
8. Colquhoun D. The quantitative analysis of drug-receptor interactions: a short history. Trends in pharmacological sciences. 2006; 27:149–157. [PubMed: 16483674]
9. Onaran HO, Costa T. Allosteric coupling and conformational fluctuations in proteins. Current protein & peptide science. 2009; 10:110–115. [PubMed: 19355978]
10. Colquhoun D. Binding, gating, affinity and efficacy: the interpretation of structure-activity relationships for agonists and of the effects of mutating receptors. British journal of pharmacology. 1998; 125:924–947. [PubMed: 9846630]
11. De Lean A, Stadel JM, Lefkowitz RJ. A ternary complex model explains the agonist-specific binding properties of the adenylate cyclase-coupled beta-adrenergic receptor. The Journal of biological chemistry. 1980; 255:7108–7117. [PubMed: 6248546]
12. Strachan RT, et al. Divergent transducer-specific molecular efficacies generate biased agonism at a G protein-coupled receptor (GPCR). The Journal of biological chemistry. 2014; 289:14211–14224. [PubMed: 24668815]
13. Wreggett KA, De Lean A. The ternary complex model. Its properties and application to ligand interactions with the D2-dopamine receptor of the anterior pituitary gland. Molecular pharmacology. 1984; 26:214–227. [PubMed: 6237254]
14. Ehlert FJ. The relationship between muscarinic receptor occupancy and adenylate cyclase inhibition in the rabbit myocardium. Molecular pharmacology. 1985; 28:410–421. [PubMed: 4058422]
15. Samama P, Cotecchia S, Costa T, Lefkowitz RJ. A mutation-induced activated state of the beta 2-adrenergic receptor. Extending the ternary complex model. The Journal of biological chemistry. 1993; 268:4625–4636. [PubMed: 8095262]
16. Onaran HO, Rajagopal S, Costa T. What is biased efficacy? Defining the relationship between intrinsic efficacy and free energy coupling. Trends in pharmacological sciences. 2014; 35:639– 647. [PubMed: 25448316]
17. Hino T, et al. G-protein-coupled receptor inactivation by an allosteric inverse-agonist antibody. Nature. 2012; 482:237–240. [PubMed: 22286059]
18. Dror RO, et al. Identification of two distinct inactive conformations of the beta2-adrenergic receptor reconciles structural and biochemical observations. Proceedings of the National Academy of Sciences of the United States of America. 2009; 106:4689–4694. [PubMed: 19258456] 19. Ballesteros JAWH. Integrated methods for the construction of three-dimensional models and
computational probing of structure-function relations in G protein coupled receptors. Meth. Neurosci. 1995; 25:366–428.
20. Ballesteros JA, et al. Activation of the beta 2-adrenergic receptor involves disruption of an ionic lock between the cytoplasmic ends of transmembrane segments 3 and 6. The Journal of biological chemistry. 2001; 276:29171–29177. [PubMed: 11375997]
21. S Meiboom DG. Modified Spin-Echo Method for Measuring Nuclear Relaxation Times. Rev. Sci. Instrum. 1958; 29:688–691.
22. Moukhametzianov R, et al. Two distinct conformations of helix 6 observed in antagonist-bound structures of a beta1-adrenergic receptor. Proceedings of the National Academy of Sciences of the United States of America. 2011; 108:8228–8232. [PubMed: 21540331]
References for Methods section
23. Kobilka BK. Amino and carboxyl terminal modifications to facilitate the production and purification of a G protein-coupled receptor. Analytical biochemistry. 1995; 231:269–271. [PubMed: 8678314]
24. Whorton MR, et al. A monomeric G protein-coupled receptor isolated in a high-density lipoprotein particle efficiently activates its G protein. Proceedings of the National Academy of Sciences of the United States of America. 2007; 104:7682–7687. [PubMed: 17452637]
25. Rasmussen SG, et al. Crystal structure of the beta2 adrenergic receptor-Gs protein complex. Nature. 2011; 477:549–555. [PubMed: 21772288]
26. Ring AM, et al. Adrenaline-activated structure of beta2-adrenoceptor stabilized by an engineered nanobody. Nature. 2013; 502:575–579. [PubMed: 24056936]
27. Otwinowski, ZMW. Methods in Enzymology. Carter Charlles, W., editor. Vol. 276. Academic Press; 1997. p. 307-326.
28. McCoy AJ, et al. Phaser crystallographic software. Journal of applied crystallography. 2007; 40:658–674. [PubMed: 19461840]
29. Adams PD, et al. PHENIX: a comprehensive Python-based system for macromolecular structure solution. Acta crystallographica. Section D, Biological crystallography. 2010; 66:213–221. [PubMed: 20124702]
30. Emsley P, Cowtan K. Coot: model-building tools for molecular graphics. Acta crystallographica. Section D, Biological crystallography. 2004; 60:2126–2132. [PubMed: 15572765]
31. Chen VB, et al. MolProbity: all-atom structure validation for macromolecular crystallography. Acta crystallographica. Section D, Biological crystallography. 2010; 66:12–21. [PubMed: 20057044]
32. Shi L, Kay LE. Tracing an allosteric pathway regulating the activity of the HslV protease. Proceedings of the National Academy of Sciences of the United States of America. 2014; 111:2140–2145. [PubMed: 24469799]
33. Pradines JR, Hasty J, Pakdaman K. Complex ligand-protein systems: a globally convergent iterative method for the n x m case. Journal of mathematical biology. 2001; 43:313–324. [PubMed: 12120871]
34. Vezzi V, et al. Ligands raise the constraint that limits constitutive activation in G protein-coupled opioid receptors. The Journal of biological chemistry. 2013; 288:23964–23978. [PubMed: 23836900]
35. Mashalidis EH, Sledz P, Lang S, Abell C. A three-stage biophysical screening cascade for fragment-based drug discovery. Nature protocols. 2013; 8:2309–2324. [PubMed: 24157549] 36. Rajagopal S, et al. Quantifying ligand bias at seven-transmembrane receptors. Molecular
pharmacology. 2011; 80:367–377. [PubMed: 21610196]
A
uthor Man
uscr
ipt
A
uthor Man
uscr
ipt
A
uthor Man
uscr
ipt
A
uthor Man
uscr
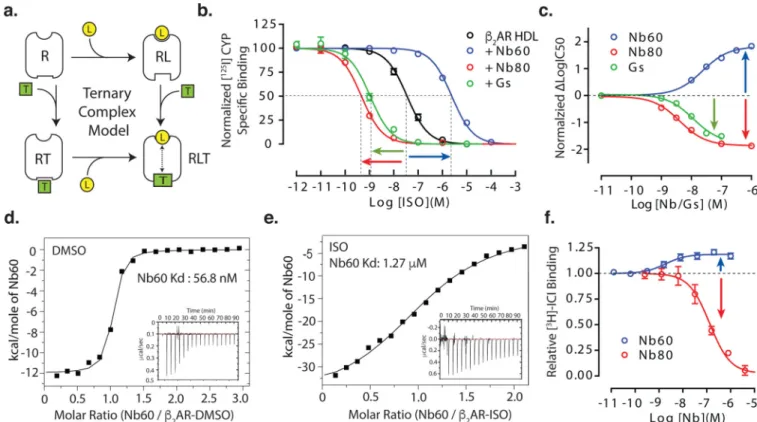
Figure 1. Allosteric nanobodies have opposing effects on agonist affinity for the β2AR
(a) Schematic of the ternary complex model (TCM). Ligand (L) affinity to receptor (R)
increases in the presence of transducer (T), this allosteric linkage is denoted by dashed line with arrows. (b) Compared to the absence of modulator, Nb60 decreases ISO affinity (negative cooperativity) and Nb80/Gs increases affinity (positive cooperativity) as assessed by radioligand competition assays using β2AR HDL-particles. (c) The effects of Nb60 and
Nb80/Gs on ISO affinity are saturable functions of their concentration. The affinity of Nb60 for unliganded β2AR (d), represented by a tight isotherm sigmoidal binding curve35, is reduced in the presence of ISO (e) as determined by isothermal titration calorimetry. (f) Nb60 dose dependently increases and Nb80 decreases the binding of the radiolabeled antagonist [3H]-ICI-118,551 to the β2AR. All radioligand binding studies represent a minimum of three independent experiments with deviation shown as standard error.
A
uthor Man
uscr
ipt
A
uthor Man
uscr
ipt
A
uthor Man
uscr
ipt
A
uthor Man
uscr
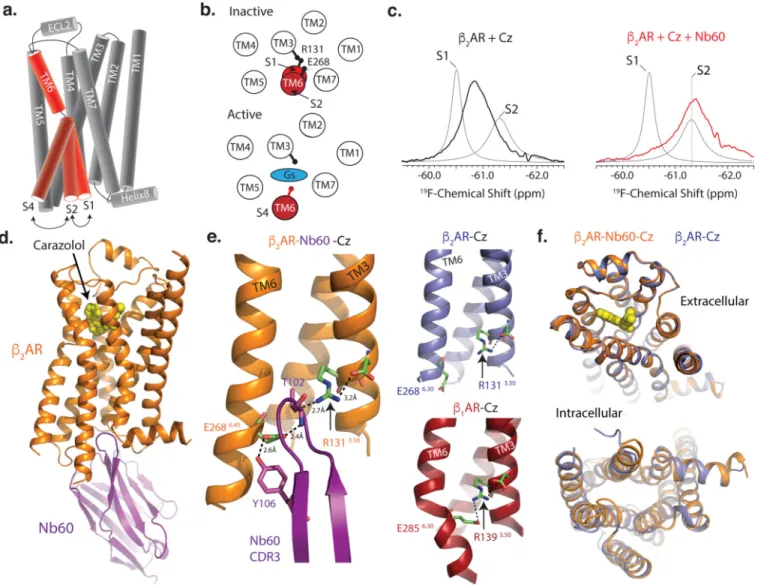
Figure 2. Nb60 stabilizes the S2 inactive state by coordinating the β2AR ionic lock
Cartoon depicting a side (a) or cytoplasmic (b) view of the β2AR transmembranes (TM). Conversion from the two inactive states (S1 and S2) to the active S4 state requires both agonist and transducer (i.e. G-protein) binding and is represented by a 14Å outward movement of TM6. (c) 19F-NMR spectroscopy of the β2AR with the antagonist carazolol
(Cz) +/− Nb60. (d) The 3.2Å structure of the β2AR bound to carazolol and Nb60 (β2
AR-Cz-Nb60). (e) Coordination of β2AR ionic lock (R131 and E238) by Nb60 CDR3 residues T102 and Y106. For comparison, a disengaged and fully formed ionic lock are shown by the
β2AR-Cz (PDB ID: 2RH1) and β1AR-Cz (PDB ID: 2YCZ), respectively. Hydrogen bonds shown as black dotted lines. (f) Overlay of β2AR-Cz and β2AR-Cz-Nb60 structures.
A
uthor Man
uscr
ipt
A
uthor Man
uscr
ipt
A
uthor Man
uscr
ipt
A
uthor Man
uscr
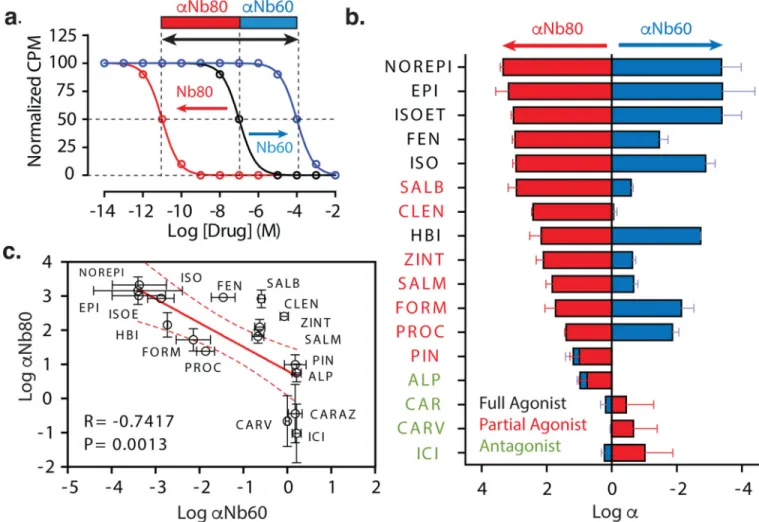
Figure 3. Nb60 and Nb80 have varying effects on the affinity of different β2AR ligands
(a) Schematic depicting the use of equilibrium radioligand binding studies to quantify the
cooperativity (α) between Nb60 or Nb80 binding and ligand affinity (see methods and supplemental information). (b) Cooperativity values for Nb60 (αNb60) and Nb80 (αNb80) for β2AR ligands with varying efficacies. Ligands are ordered by magnitude of αNb80. (c) Correlation plot of αNb60 and αNb80; regression shown as solid red line with 95% confidence interval (dotted red line). All α values derived from at least three independent radioligand binding experiments with deviation depicted as standard error.
A
uthor Man
uscr
ipt
A
uthor Man
uscr
ipt
A
uthor Man
uscr
ipt
A
uthor Man
uscr
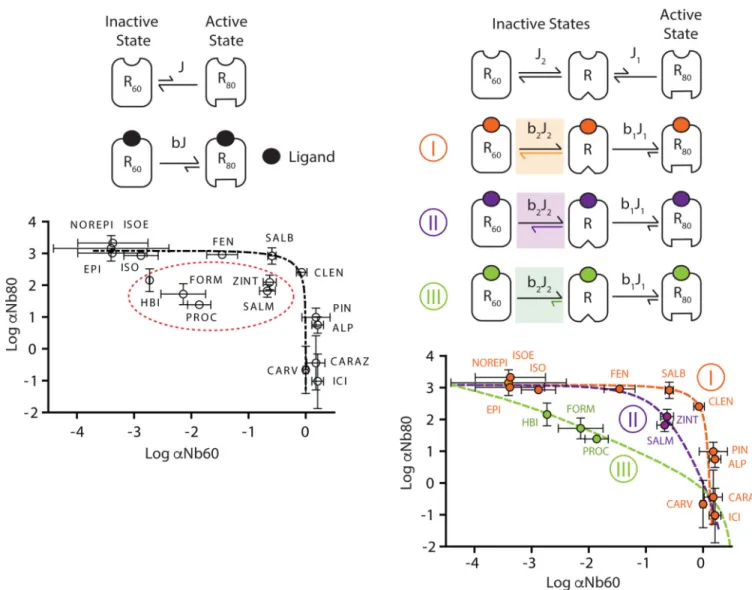
Figure 4. β2AR agonists differentially stabilize receptor states to regulate receptor activation Illustration of a two- (a) or three-state (b) model of receptor activation describing the effect of β2AR ligands on receptor conformations stabilized by Nb60 (R60) or Nb80 (R80). The
equilibrium (J) between receptor states can be influenced by ligand binding through the allosteric factor β. The theoretical cooperativity (α) between nanobody and ligand binding derived from the 2-state model (dashed black line) fails to predict the observed α values for a subset of ligands (dashed red oval). However, the observed cooperativity values can be accurately predicted using an allosteric model in which ligands can differentially modulate three independent receptor states (3-state). Certain ligands (orange) primarily stabilize the active R80 state, whereas others (purple, green) can stabilize R80 but simultaneously
destabilize the inactive R60 state. All α values derived from at least three independent
radioligand binding experiments with deviation depicted as standard error.