GROWTH IN HIV-EXPOSED AND -UNINFECTED INFANTS IN MALAWI AND RWANDA
Charlotte Lane
A dissertation submitted to the faculty of the University of North Carolina at Chapel Hill in partial fulfillment of the requirements for the degree of Doctor of Philosophy in the Department of
Nutrition, Gillings School of Global Public Health.
Approved by: Linda S. Adair Margaret E. Bentley Stephanie L. Martin Audrey Petifor Emily Bobrow Chapel Hill
iii ABSTRACT
Charlotte Lane: Growth in HIV-exposed and -uninfected infants in Malawi and Rwanda (Under the direction of Linda S. Adair)
Background: Infants are considered to be HIV-exposed and -uninfected (HEU) if they are exposed to the virus during pregnancy, delivery, and breastfeeding, but do not acquire HIV. These infants may be at increased risk of poor health outcomes, including growth.
Methods: This dissertation considers the growth of HEU infants in the Breastfeeding, Antiretroviral, and Nutrition study in Malawi and the Kigali Antiretroviral and Breastfeeding Assessment for the Elimination of HIV in Rwanda. These studies both enrolled HIV-positive pregnant and/or postpartum women and followed their HEU infants in resource restricted, urban settings. We first compare the growth trajectories of infants in these two countries through the use of SuperImposition by Translation and Rotation and latent class growth mixture modeling. We then consider the longitudinal interrelationship between maternal viral suppression,
maternal weight change, breastfeeding, and infant growth through structural equation modeling. Finally, we investigate the relationship between inflammatory burden, measured through a latent variable, and growth.
iv
variable by exposure to maternal supplementation and antiretroviral medications. The effect of inflammation on infant length is likely chronic and altered by the cause of inflammation.
Conclusion: Public health officials should consider the unique risk factors for poor health in their own context when designing interventions to support the wellbeing of HEU infants. There may be long-term effects of exposure to antiretroviral therapy on infant growth that must be considered as well. We show that HIV-treatment approaches and inflammation may interact and relate to infant growth outcomes. More work is needed to further establish the effects of
v
ACKNOWLEDGEMENTS
I would like to thank Linda Adair for her incredible support throughout this writing
process. She has given me hours of her time and effort discussing results in detail and providing invaluable insight. I very much enjoyed our meetings which would sometimes stretch for hours as we discussed alternative interpretations of the data and future directions. I appreciated the guidance and feedback of all my committee members: Linda, Peggy, Stephanie, Audrey, and Emily. It has been an incredible and honoring experience to see your thought processes as you considered my work.
I further thank the participants, funders, and researchers involved in the BAN and Kabeho studies. Without the previous development of these impressive datasets, my research would not have been possible. Kabeho was conducted in collaboration with the Elizabeth Glaser Pediatric AIDS Foundation with support from the United States Agency for International
development through USAID Cooperative Agreement AID-OAA-A-12-00024. BAN was primarily funded by the Prevention Research Centers Special Interest Project SIP 13-01
U48-CCU409660-09 and SIP 26-04 U48-DP000059-01.
vi
TABLE OF CONTENTS
LIST OF TABLES ... x
LIST OF FIGURES ... xi
LIST OF ABBREVIATIONS ... xii
CHAPTER 1: INTRODUCTION ... 1
Overview ... 1
Objectives and specific aims ... 2
Datasets ... 3
BAN ... 3
Kabeho ... 4
Country level context ... 5
Tables... 7
CHAPTER 2: LITERATURE REVIEW ... 9
The importance of growth ... 10
The relationship between growth and nutrition ... 10
Growth in HEU infants ... 12
Understanding the discordant growth pattern ... 14
Inflammation and growth ... 15
Maternal viral suppression, maternal weight change, breastfeeding, and infant growth ... 17
Tables... 19
Chapter 3: SIMILAR GROWTH TRAJECTORIES AMONG HIV-EXPOSED AND -UNINFECEDTED INFANTS IN THE BAN AND KABEHO STUDIES ... 20
Summary ... 20
Background ... 20
Results ... 20
Conclusion ... 20
Introduction ... 21
Materials and methods ... 22
Participants... 22
Data analysis ... 23
Results ... 25
Sample population ... 25
SITAR... 26
Latent growth trajectories ... 27
Discussion ... 28
Conclusions ... 32
Tables... 33
Figures ... 40
viii
CHAPTER 4: LONGITUDIANL INTERRELATIONSHIPS BETWEEN HIV VIRAL SUPPRESSION, MATERNAL WEIGHT CHANGE, BREASTFEEDING, AND LENGTH IN HIV-EXPOSED AND -UNINFECTED INFANTS IN THE KABEHO
STUDY IN RWANDA ... 45
Summary ... 45
Background ... 45
Methods ... 45
Results ... 45
Conclusion ... 45
Introduction ... 46
Materials and methods ... 48
Results ... 51
Discussion ... 52
Conclusions ... 55
Tables... 56
Figures ... 59
CHAPTER 5: INFLAMMATROY BURDEN RELATES TO FUTURE GROWTH AMONG HIV-EXPOSED AND –UNINFECTED INFANTS IN THE BAN TRIAL IN MALAWI ... 61
Summary ... 61
Introduction ... 62
Methods ... 63
Participants... 63
Inflammatory markers ... 64
ix
Anthropometry ... 66
Analysis ... 66
Results ... 69
Discussion ... 71
Conclusions ... 73
Tables... 74
Figures ... 83
Supplemental materials ... 88
CHAPTER 6: Synthesis ... 90
Overview of major research findings ... 90
Comparison of growth patterns ... 90
Viral suppression, maternal weight change, breastfeeding, and infant growth ... 91
Inflammation and growth... 93
Strengths and limitations... 93
Significance ... 95
Future directions ... 96
LIST OF TABLES
Table 1: Comparison of the BAN and Kabeho studies ... 7
Table 2: Country level comparison of Malawi and Rwanda ... 8
Table 3: Comparison of mean growth outcomes across contexts ... 19
Table 4: Descriptive statistics of the study sample ... 33
Table 5: Predictors of SITAR coefficients... 34
Table 6: Description of latent length-class and odds of class membership... 36
Table 7: Description of latent weight-class and odds of class membership ... 38
Table 8: Descriptive characteristics of sample over time... 56
Table 9: Coefficients for each relationship in the estimated structural equation model ... 57
Table 10: Description of sample ... 74
Table 11: Standardized weights for the measurements of inflammatory burden ... 75
Table 12: Correlation between inflammatory burden scores and their measurements. ... 77
Table 13: Results of linear regressions considering the relationships between inflammatory burden scores and LAZ. ... 79
xi
LIST OF FIGURES
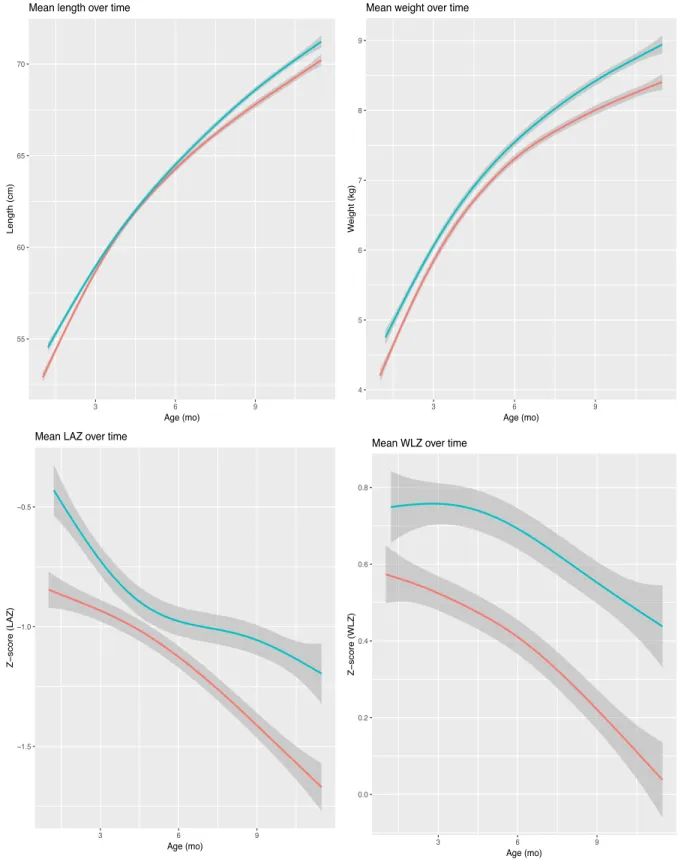
Figure 1: Growth in length and weight by study origin ... 40 Figure 2: Growth and velocity curves for each step of the SITAR analysis ... 41 Figure 3: Latent growth trends in a combined sample of infants from the
BAN and Kabeho studies ... 42 Figure 4: Theoretical framework demonstrating the relationship between
viral suppression, maternal weight loss, breastfeeding, and infant growth ... 59 Figure 5: Structural equation model of the relationship between viral suppression,
maternal weight change, breastfeeding, and infant LAZ ... 60 Figure 6: Distributions of inflammatory burden and its normalized measures ... 83 Figure 7: Difference in inflammatory burden by BAN treatment arm ... 84 Figure 8: Predicted infant size by inflammatory burden and terms it is interacted
with in model two ... 85 Figure 9: Predicted infant size by inflammatory burden and terms it is interacted
with in model three ... 86 Figure 10: Predicted infant size by inflammatory burden and terms it is interacted
xii
LIST OF ABBREVIATIONS
AGP – Alpha-1-glycoprotein ART – Antiretroviral therapy
BAN – Breastfeeding, Antiretroviral, and Nutrition study BMI – Body mass index
BIC – Bayesian information criteria CD4 – Cluster of differentiation 4 CFI – Comparative fit index cm – Centimeter
Coeff – Coefficient CRP – C-reactive protein
DHS – Demographic and Health Survey EBF – Exclusive breastfeeding
FIML – Full information maximum likelihood HEU – HIV-exposed and –uninfected HUU – HIV-unexposed and –uninfected IB – Inflammatory burden score
Kabeho – Kigali Antiretroviral and Breastfeeding Assessment for the Elimination of HIV LAZ – Length-for-age z-score
LNS – Lipid nutrient supplements
MaMI – Malawi Mothers and Infants Study ml – Milliliter
mo. – Months
MUAC – Mid-upper arm circumference OR – Odds ratio
xiii SD – Standard deviation
SE – Standard error
SITAR – SuperImposition by Translation and Rotation SRMR – Standardized room mean square residual TRF – Transferrin
1
CHAPTER 1: INTRODUCTION
Overview
Massive strides in the treatment and prevention of HIV have been achieved over the last several decades as a result of an incredible, international research and humanitarian effort. Because of this work, HIV positive individuals now remain healthy for years after diagnosis. HIV-positive women survive and are healthy long enough to have children who remain largely uninfected. The HIV-negative infants of HIV-positive women are termed HIV-exposed and – uninfected (HEU). Before the widespread availability of antiretroviral therapy (ART), these infants were at increased risk of early morbidity and mortality. However, with better treatment options, there is hope that the health of HEU infants may also be improving.
Here, we examine the growth of HEU infants as a proxy for their health and wellbeing. Growth may be either a determinant of future health or a marker of an underlying process which is also related to future outcomes. In either case, growth is essential for future health and
wellbeing. First, we compare growth trajectories between two populations of HEU infants born in different countries and decades to understand similarities and differences in their patterns of development. Then, we consider the interrelationship between viral suppression, maternal weight change, breastfeeding, and infant growth. Finally, we examine the relationship between inflammation and growth within this at risk population.
2
Objectives and specific aims
The objective of this dissertation is to examine the growth of HEU infants in Rwanda and Malawi in order to improve our understanding of the current state of HEU infant health and identify factors associated with poor outcomes in this population. We consider infants who participated in the Kigali Antiretroviral and Breastfeeding Assessment for the Elimination of HIV (Kabeho) and the Breastfeeding, Antiretroviral, and Nutrition (BAN) studies. Kabeho took place in Kigali, Rwanda from April 2013 to January 2015 and enrolled 608 HIV-positive, pregnant or early postpartum women participating in prevention of mother-to-child HIV transmission programs in selected high-volume facilities. The BAN study followed 2,373 treatment naive, pregnant, HIV-positive women in Lilongwe, Malawi from March 2004 to February 2009.
Aim 1: Compare the growth trajectories of the infants in the BAN and Kabeho studies. Aim 1a: Use SuperImposition by Translation and Rotation (SITAR) to compare the mean size and growth velocities of infants in the BAN and Kabeho studies. Aim 1b: Use latent class growth mixture modeling to examine underlying growth patterns in these populations. Aim 1c: Examine the relationships between established risk factors for poor growth and the identified infant growth trajectories. Premise: Mean growth trajectories in both the BAN and Kabeho studies indicate low average length-for-age z-scores (LAZ) and elevated average weight relative to height. However, the full extent of the similarities in growth patterns across contexts has not been established. Similar growth despite meaningful contextual differences would imply a common phenotype of discordant growth among HEU infants.
3
Aim 3: Determine the relationship between inflammatory burden and HEU infant growth within BAN infants. Premise: Because inflammation affects growth and HEU infants have altered patterns of inflammation, the relationship between inflammation and growth within this population may be different than that of the general population.
Datasets
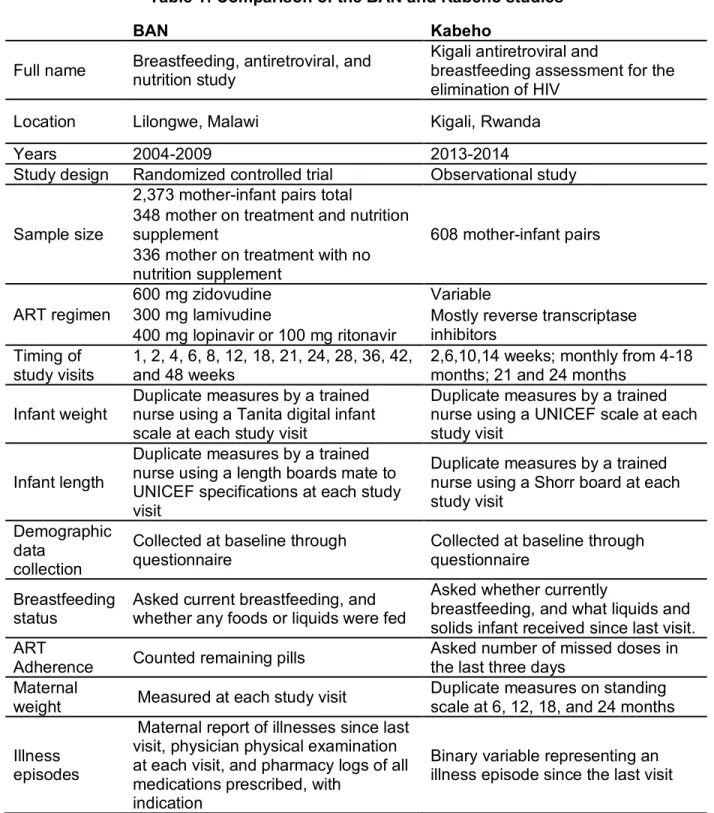
We examine HEU infant growth in two studies: the Breastfeeding, Antiretroviral, and Nutrition (BAN) study and the Kigali Antiretroviral and Breastfeeding Assessment for the Elimination of HIV (Kabeho). The use of these two studies allows for the examination of HEU infant growth in two disparate contexts and allow the research questions drive the methods rather than the data determining the research question. Each study has its own context, strengths, and limitations. Study protocols are presented and compared in table 1.
BAN
The primary purpose of the BAN (Breastfeeding, Antiretroviral, and Nutrition) study was to investigate the effectiveness of antiretroviral therapy in preventing mother-to-child
transmission of HIV. The study also examined the impact of maternal supplementation during lactation on maternal health. BAN occurred under an older set of recommendations for the prevention of mother-to-child transmission of HIV and feeding of HIV-exposed and -uninfected infants. The use of this dataset allows for an examination of growth trajectories under low resource, high medical access conditions in which breastfeeding was quickly ended at six months. As a trial, BAN allows for the examination of the effects of three different treatment regimens. The intense level of study observation in BAN may have induced mothers to behave in non-standard ways regarding their own health and that of their infants. Participants were provided with free medical care at the study clinic.
4
randomized to three HIV treatment groups (no treatment, infant antiretroviral therapy, or maternal antiretroviral therapy) and two nutrition groups (lipid nutrient supplement or no supplement); however, the no treatment groups were closed in March 2008. At this point, mothers in the no treatment arms had the opportunity to switch into either of the two active treatment arms. In addition, starting in December 2005, infants were given prophylactic cotrimoxizole. BAN study visits took place at 1, 2, 4, 6, 8, 12, 18, 21, 24, 28, 36, 42, and 48 weeks. At each visit, weight was measured using Tanita digital infant scales; length was
measured with length boards made to United Nations International Children’s Emergency Relief Fund specifications; and mothers were asked about recent infant illnesses. Socioeconomic and other characteristics were collected from mothers at baseline.
Kabeho
The Kabeho Study (Kigali Antiretroviral and Breastfeeding Assessment for the
Elimination of HIV) was designed as an observational study of the implementation of universal, lifelong ART for all pregnant or breastfeeding, HIV-positive women (Option B+). Kabeho likely has less bias introduced due to intense observation and the heavy use of medical facilities. In addition, it allows for an understanding of infant growth in the context of a longer duration of breastfeeding. Women were encouraged to breastfeed for at least a year.
5
as a measure of neonatal weight. At each visit, trained nurses took duplicate measures of infant length to the nearest centimeter (cm) using Shorr boards, and weight to the nearest 10 grams using United Nations International Children’s Relief Fund scales. Maternal weight was
measured at six, 12, 18, and 24 months. Viral load was measured at birth, 18 months, and 24 months. Viral load testing was conducted using the Roche Cobas Ampli-Prep/Cobas TaqMan HIV-1 quantitative test. The lower limit of detection for this test is 20 copies/ml.
Country level context
Both studies took place in low income countries in sub-Saharan Africa. These countries have agriculture based economies with most of their populations living in rural settings.1,2 They have high rates of infectious diseases.1,2 However, each country is unique, with a different level of resources, culture, and socioeconomic context. These differences must be considered when interpreting results. Table 2 provides basic data related to HIV and maternal and infant health for the two countries.
According to the Human Development Index, Malawi is less developed than Rwanda. Because BAN is also older than Kabheo, we expect that the living conditions were more challenging in BAN than Kabeho. Breastfeeding is nearly universal in Malawi; however, only 34% of infants four to five months of age are exclusively breastfed.3 Many women report difficulties exclusively breastfeeding their infants for six months, in accordance with
recommendations, due to poor support or understanding of its sufficiency.4 HIV-positive women worry that breastfeeding may accelerate the progression of their disease.5 Only 51% of women attend the recommended four antenatal care visits.6 Women report barriers to facility based delivery, including labor during night, financial constraints, and rainy season.6 They also report moderate control over their own income, assets, and movement.3
In Rwanda, 81% of infants four to five months of age are exclusively breastfed.7 As a consequence of the war, women’s empowerment is quite strong in Rwanda. Women are
6
7 Tables
Table 1: Comparison of the BAN and Kabeho studies
BAN Kabeho
Full name Breastfeeding, antiretroviral, and nutrition study
Kigali antiretroviral and
breastfeeding assessment for the elimination of HIV
Location Lilongwe, Malawi Kigali, Rwanda
Years 2004-2009 2013-2014
Study design Randomized controlled trial Observational study
Sample size
2,373 mother-infant pairs total
608 mother-infant pairs 348 mother on treatment and nutrition
supplement
336 mother on treatment with no nutrition supplement
ART regimen
600 mg zidovudine Variable
300 mg lamivudine Mostly reverse transcriptase inhibitors
400 mg lopinavir or 100 mg ritonavir Timing of
study visits
1, 2, 4, 6, 8, 12, 18, 21, 24, 28, 36, 42, and 48 weeks
2,6,10,14 weeks; monthly from 4-18 months; 21 and 24 months
Infant weight
Duplicate measures by a trained nurse using a Tanita digital infant scale at each study visit
Duplicate measures by a trained nurse using a UNICEF scale at each study visit
Infant length
Duplicate measures by a trained nurse using a length boards mate to UNICEF specifications at each study visit
Duplicate measures by a trained nurse using a Shorr board at each study visit
Demographic data
collection
Collected at baseline through questionnaire
Collected at baseline through questionnaire
Breastfeeding status
Asked current breastfeeding, and whether any foods or liquids were fed
Asked whether currently
breastfeeding, and what liquids and solids infant received since last visit. ART
Adherence Counted remaining pills
Asked number of missed doses in the last three days
Maternal
weight Measured at each study visit
Duplicate measures on standing scale at 6, 12, 18, and 24 months
Illness episodes
Maternal report of illnesses since last visit, physician physical examination at each visit, and pharmacy logs of all medications prescribed, with
indication
8
Table 2: Country level comparison of Malawi and Rwanda Malawi Rwanda Ranking in Human Development Index 1718 1588
HIV infection among adults 9.6%1 2.7%2
Average number of infants per woman 5.51 4.62
Life expectancy at birth 63.71 67.52
9
CHAPTER 2: LITERATURE REVIEW
In 2018, there were 37.9 million people infected with HIV.9 Each week, 6,200 women ages 15 to 24 became infected.9 These women have the potential to transmit HIV to their infants during pregnancy, delivery, and breastfeeding. However, with improved treatment options, mother-to-child transmission of HIV is decreasing and more infants remain exposed but uninfected.10,11 New infections among children declined by 41% from 2010 to 2018.9 Because the population of HEU infants is increasing, their wellbeing is a major public health concern.11 The failure of such a large number of individuals to reach their full human potential would not only be a major humanitarian injustice but would also have serious economic and social impacts worldwide.
The effects of HIV exposure on infant health are uncertain; however, HEU infants are likely at increased risk of morbidity and mortality compared to their unexposed
counterparts.10,12,13 Much of this increased risk may be due to environmental and socioeconomic factors that co-vary with HIV; nonetheless, the increased risk of morbidity and mortality
experienced by HEU infants cannot be fully explained by differences in maternal care,
breastfeeding, or vertical transmission of pathogens.10 HEU infants may have reduced immune capacity, causing an increased risk of infection.13 Other factors, including the direct biological action of the virus or antiretroviral medications could also affect infant health. In addition, these infants may experience a growth pattern characterized by slow linear growth without a
concordant decrease in weight gain, resulting in a slightly elevated weight relative to length.14–16 This discordant growth pattern could have detrimental long term health consequences as slow linear growth and elevated weight relative to height are harmful to future health and
10
The importance of growth
It is as yet unclear if growth represents a direct determinant of future health or an indicator of another process which also determines future outcomes.17 Regardless, early development is related to long term health and wellbeing.25 The restricted nutrient supply and frequent infections which cause stunting may also cause alterations in brain development, leading to poor cognitive outcomes.17 Infant growth is related to a many future outcomes including: school attainment, productivity, cognitive development, wages, obesity, insulin resistance, blood pressure, and more.18 Individuals with faster weight-gain in the first two years of life tend to complete more years of school and have a lower risk of failure in school in low and middle income countries.23 Stunting by two to three years of age is related to poorer cognitive development and school attainment.24 Supplementation to improve children’s nutritional status can also improve motor development, mental development, and cognitive ability.24 Maternal stunting increases the risk of poor pregnancy outcomes.17
Early growth is related to future metrics of body composition.19,20,26,28,29 Once weight elevation develops, it tends to persist; therefore, it is necessary to prevent weight elevation from birth.19 Infant growth affects childhood body mass index (BMI), total body fat, and abdominal fat.27 Childhood obesity is highly correlated with adult obesity and related morbidities.30 Furthermore, childhood overweight status is related to immediate metabolic abnormalities, including elevated cholesterol, triglycerides, and glucose; increased risk of type II diabetes; and high blood pressure.30 Despite the seriousness of the consequences of early life obesity, there is a lack of knowledge about prevention of obesity in the period from birth to two years.19
The relationship between growth and nutrition
11
permanent epigenetic changes influencing health outcomes in later life.31 A variety of approaches to improve growth have been suggested, including dietary diversification and supplementation; however, the impacts of interventions to support these changes are inconsistent.32
The first source of nutrition that most infants receive is breastmilk. The results of studies considering breastfeeding practices and infant growth are highly variable depending on the metric of growth considered, the quantification of breastfeeding, timing, study design, local cultural practices, and more.33–38 Although there is conflicting evidence suggesting a relationship between breastfeeding and infant growth, a major limitation of these studies is the possibility for reverse causation. Women tend to adjust their breastfeeding status to perceived infant health and cues from the infant. As such, these studies should be interpreted cautiously. Breastfeeding has a variety of other positive impacts including decreased exposure to pathogens, protective immunological effects, and improved cognitive outcomes as well as potential health benefits for the mother.39
The first solid foods infants receive have significant impacts on growth as well.30 Dietary diversity from six to 23 months is related to growth.37,40 In Ghana, the consumption of eggs, dairy, and legumes is related to increased LAZ.41 A randomized controlled trial that provided infants with an egg a day found significant increases in LAZ and weight-for-age z-score (WAZ) and decreases in stunting and underweight status over a six month period in Ecuador.42
However, a similar study in Malawi, which also provided an egg a day, found no effect, likely due to the large amount of animal source foods already in the diet.43 Another study in Malawi randomized infants to receive a cowpea, common bean, or corn-soy based daily food
supplements from six to 12 months.44 LAZ decreased least in the cowpea group.
12
and/or the infant to support healthy growth. However, in Malawi, providing small quantity LNS to mothers from pregnancy to six months postpartum and their infants from six to 18 months did not result in improved infant growth relative to an iron-folic acid or micronutrient supplement.45,46 A study in Burkina Faso found that small quantity lipid nutrient supplements from nine to 18 months of age may improve growth; however, the intervention group had additional access to medical care relative to the control.47 The type of LNS used appears to have no effect on
growth. There are limited differences in the growth outcomes of infants on milk, soy, or corn-soy supplements in Malawi.48 In addition, no difference exist in growth or body composition of Cambodian infants at 18 months on four different supplements: rice, fish, and spiders; rice and fish; corn and soy; corn, soy, and milk.49
Growth in HEU infants
HEU infants may be particularly vulnerable to poor growth outcomes due to a unique set of harmful exposures: increased risk of maternal illness and death, deleterious socioeconomic factors that co-vary with HIV infection, reduced immune function, increased pathogen exposure, and exposure to HIV and antiretroviral medications.10,11,13,50–53 There is some, highly conflicted evidence indicating that HEU infants may grow more slowly than unexposed infants.10,11,54–57 Much of the lack of clarity regarding HEU infant growth is due to the highly variable and rapidly changing treatment regimens to which they are exposed.
13
weight-for-age.60 Traditional complementary foods may be inadequate to support healthy growth in Rwandan, HEU infants.16
The effect of HIV and ART exposure on growth remains unknown.10 A 2016 review of perinatal and postnatal exposure to maternal HIV and combination antiretroviral therapy found “modest but significant impairment of [neuro]development and a higher risk of growth
impairment” related to HIV and combination antiretroviral therapy exposure.12 Authors also concluded that HEU infants experienced higher risk of morbidity and mortality compared to HIV-unexposed, -uninfected (HUU) infants. A 2018 meta-analysis similarly concluded that HEU children have slower neurodevelopment than HUU children and HEU children exposed to ART have slower development than those not exposed to ART.61 However, a recent study from Botswana found no difference in neurodevelopment between HEU and HUU infants and further found no differing effects of triple antiretroviral treatment or zidovudine.62
Specific antiretroviral therapies are, however, associated with alterations in infant growth. Infants whose mothers were randomized to triple antiretroviral therapy have lower LAZ and WAZ at 24 months than infants whose mothers received zidovudine at least 2 weeks before birth and breastfed for six months in Botswana.63 Infants on tenofovir have lower WAZ and LAZ in the first year of life compared to infants whose mothers received combination antiretroviral therapy.64 In both studies, treatment assignment was random and not based on HIV disease progression. As such, it is highly probable that the antiretroviral medication itself altered infant growth.
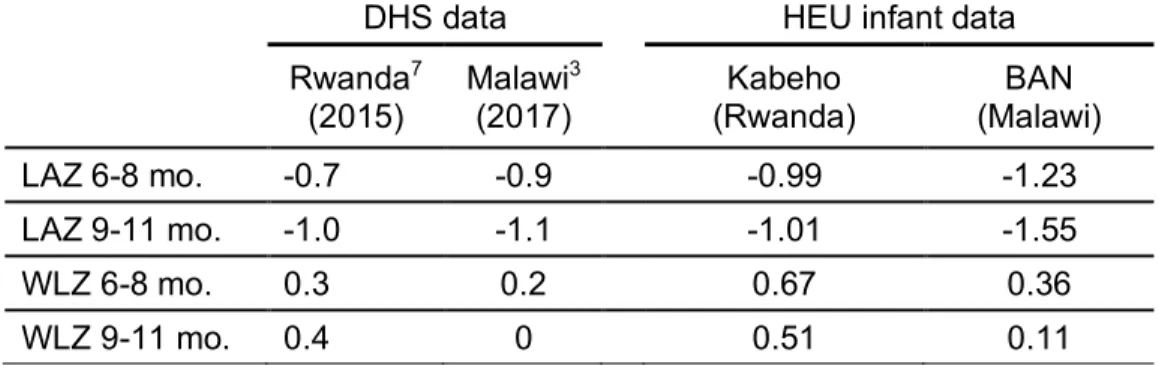
Recent studies have shown that HEU infants experience a mean growth pattern of low LAZ and slightly elevated weight relative to length.14–16 In the study that included HUU infants as a comparator, the unexposed infants were larger in WAZ, LAZ, WLZ, and BMI z-score than the HEU infants.14 From six to eight months, HEU infants from the BAN study in Malawi and the Kabeho study in Rwanda were shorter and relatively heavier than the sample in the
14
these differences were largely closed between Kabeho infants and other Rwandan infants, but remained apparent in Malawi. We examine the similarities and differences in the growth trajectories of infants participating in the BAN and Kabeho studies in Aim 1.
Understanding the discordant growth pattern
The occurrence of low LAZ and high WLZ in the same infant is counterintuitive as we associate linear growth faltering with a nutritional deficit and overweight status with a nutritional excess. Nonetheless, stunting and overweight both represent forms of malnutrition.65 The co-occurrence of these two problems is increasing in developing countries, particularly in children from one to five years of age.65 In Indonesia, the prevalence of concurrent stunting and
overweight status is increasing with one of the largest risk factors being the year in which an infant was born.66 A similar pattern exists in South African children from 1.5 to five years of age. BMI and LAZ are significantly correlated, with 68% of obese children but only 14% of normal or underweight children being stunted.67 Among Ghanaian children from zero to five months of age, LAZ and WLZ are inversely correlated, but they are positively related from 12 to 47 months.68 Factors predicting stunting and wasting are variable with some overlapping (birth weight, wealth index, age) and some only significant for one metric of malnutrition (number of antenatal care visits, parity, maternal height, urban / rural setting).68 Nonetheless, a study in Ecuador found no association between stunting and overweight status.69
The biological mechanisms separately and concurrently driving linear and ponderal growth are not yet fully understood.However, socioeconomic status, maternal occupation, and maternal education are related to concurrent stunting and overweight.65 Among Ecuadorian children, living in a household that sells livestock is a risk factor for both overweight and
15
low BMI.71 This is likely due to the fact that an energy dense diet is related to lower intake of fruits and dairy products, which support growth. But, the energy dense diet is higher in fish, meat, and legumes, foods that also support healthy growth.
Inflammation and growth
The factors which affect early inflammation and immune development are also not fully understood. However, the development of infants’ immune systems is likely driven by the need to protect the fetus and infant, support feto-maternal tolerance, and allow for microbial
colonization where appropriate.72 Evidence from mouse studies indicates that the maternal microbiota may significantly influence immune development.73 The mother may actually start transferring bacterial antigens to the fetus in utero to support immune development.74 There is conflicting evidence regarding the effect of cytokines in milk on early infant immune
development.75
The mechanisms linking inflammation and growth are not well established. Effects in children with chronic inflammatory conditions indicate abnormalities in the growth hormone / insulin-like growth hormone-1 axis and the action of cytokines on growth plates.76 Both
interlukin-6 and cortisol, which are elevated during inflammatory responses, have been directly linked to growth outcomes through certain biochemical pathways.77 Alternatively, the energetic demands of mounting immune responses may cause the association between inflammation and poor growth.77 Chronic inflammation of the intestinal mucosa may influence nutrient absorption, with adverse effects on infant growth.78–81
16
necessary to consider the relationship between inflammation and growth in the context of the various treatment regimens HEU infants are exposed to (Aim 3).
Development of treatment protocols for mothers with HIV and their infants
The rapid changes in protocols for the prevention of mother-to-child transmission of HIV and HEU infant feeding in low resource settings may explain some of the variation in study findings regarding HEU infant health and growth. The World Health Organization (WHO) published guidelines in 2000, 2004, and 2006 specifying treatment protocols and CD4 (cluster of differentiation 4) cut points for treatment eligibility.89 In 2010, the WHO proposed new guidelines for the prevention of mother-to-child transmission of HIV.90 These guidelines
specified that all HIV-positive, pregnant or breastfeeding women in low resource settings should receive antiretroviral therapy from 14 weeks gestation until one week after the cessation of breastfeeding. Women would then only continue treatment if it was needed for their own health. However, in 2011, a call was put out in the Lancet to adopt universal, lifelong antiretroviral therapy for all pregnant, HIV infected women.91 Several justifications for this approach were explained: CD4 counts are not widely available in low income countries; the high fertility rates in many of these settings result in women repeatedly starting and stopping treatment; the
messaging and logistics of lifelong antiretroviral treatment are simpler; and many women do not receive their first prenatal visit before 14 weeks. As a result, the WHO quickly published a new set of guidelines in 2012.90 These guidelines included Option B+, the adoption of universal, lifelong antiretroviral treatment for all HIV-positive, pregnant or breastfeeding women. The WHO explained that this new approach would simplify service delivery, protect against transmission in future pregnancies, reduce HIV transmission to partners, and avoid stopping and starting
17
B+ would have benefits in terms of efficacy and effectiveness in preventing transmission,
improving maternal health, increasing safety, supporting adherence, and avoiding resistance.93 At the same time that these guidelines were developed, the WHO also published advice on the feeding of infants born to HIV-positive mothers in low resource settings. In 2001 and 2006 the WHO published recommendations stressing the potential harms of breastfeeding in the context of HIV and supported sharing this information with the mother while supporting her to make an informed decision.94,95 These recommendations were significantly revised in 2010 and updated with minimal changes in 2016.96 The WHO now recommends that HIV-positive women in these settings exclusively breastfeed their infants for six months and continue breastfeeding for at least a year. Breastfeeding should stop only once an adequate and safe diet can be established without breastmilk.
In the context of ART and exclusive breastfeeding, mother-to-child transmission can be reduced to 1% in low income settings; however, the 93% HIV-free survival rate found in Kigali, Rwanda may more accurately reflect survival in most real world contexts.97,98 Among infants negative for HIV at six weeks, exclusively breastfed HIV-exposed infants in South Africa had a transmission rate of 4%.99 A recent systematic review noted that transmission rates ranged from 1.1% to 15.1% and have recently begun to rise.100
Maternal viral suppression, maternal weight change, breastfeeding, and infant growth The adoption of the new recommendations for the prevention of mother-to-child transmission of HIV and feeding of HEU infants in low resource settings is expected to have several biological and behavioral consequences that may affect both maternal and infant health.
18
South Africa and Brazil examining the effect of different antiretroviral treatments and requiring infants to be formula fed.102 This indicates the possibility that these infants may experience slower growth as well. In contrast, neither CD4 nor viral load at enrollment were related to infant WAZ or LAZ in a study examining the effects of combination antiretroviral therapy or zidovudine on infant growth in Botswana.103
As discussed above, exclusive breastfeeding for six months, as recommended by the WHO, may affect infant growth. However, in the context of HIV, some women may chose not to breastfeed or to wean early due to concerns about transmission and/or their own health.5
Despite being beneficial for infants, breastfeeding can induce significant energetic demands on the mother, and women may mobilize fat stores to meet this demand.104 One study in Botswana found that only 9% of HEU infants were ever breastfed while over 99% of unexposed infants were breastfed.62
HIV infection itself is associated with weight loss and wasting.105 Weight loss among HIV-positive individuals is associated with increased mortality risk.106 Maternal weight loss is expected in the postpartum period.107–109 The rate of weight loss decreases as time passes after birth. The effect of maternal weight on postnatal, infant growth is still unknown,110 especially in the context of HIV. Low maternal, gestational mid-upper arm circumference (MUAC) is
19 Tables
Table 3: Comparison of mean growth outcomes across contexts
DHS data HEU infant data
Rwanda7
(2015)
Malawi3 (2017)
Kabeho (Rwanda)
BAN (Malawi)
LAZ 6-8 mo. -0.7 -0.9 -0.99 -1.23
LAZ 9-11 mo. -1.0 -1.1 -1.01 -1.55
WLZ 6-8 mo. 0.3 0.2 0.67 0.36
20
Chapter 3: SIMILAR GROWTH TRAJECTORIES AMONG HIVEXPOSED AND -UNINFECEDTED INFANTS IN THE BAN AND KABEHO STUDIES
Summary
Background: With the success of treatment for HIV, mother-to-child transmission of the disease is decreasing. Increasingly, efforts are being focused on supporting the health and wellbeing of the HIV-exposed and -uninfected (HEU) infants born to HIV-positive women.
Methods: We pool data from two studies of HEU infants: the BAN study in Malawi and the Kabeho study in Rwanda. We then use SITAR and latent class mixture modeling to determine if infants from the two countries experience similar patterns in growth.
Results: Infants from the Malawi cohort had, on average, lower weight than Rwandan infants; however, length, linear growth velocity, and the rate of weight gain were similar. Each latent class was composed of 40-60% infants from each cohort, except for the largest class, which was predominantly infants from Rwanda. Increasing maternal height was related to increased odds of being in the tallest classes. Among Rwandan infants, maternal height was also related to increased size in length and weight. Increasing neonatal WAZ was associated with increased odds of being in the largest length and weight classes in both studies. Neonatal WAZ also was also positively related to size in length and weight and accelerated ponderal growth. However, the effect sizes were variable by country of origin.
21 Introduction
Success in the treatment of HIV has resulted in more HIV-positive women living long and healthy lives. Along with improved antiretroviral treatment (ART) options, mother-to-child
transmission of HIV is decreasing and efforts to support the health of HIVexposed and -uninfected (HEU) infants are increasing in low- and middle-income countries.10 These infants are believed to be at increased risk of severe morbidity and mortality.13,51,113 Relative to the World Health Organization (WHO) standards, HEU infants may be at risk of larger deficits in linear growth than ponderal growth, resulting in high weight-for-length z-scores (WLZ).14–16
This discordant growth pattern could have detrimental long-term consequences. Linear growth and relative weight gain through infancy are associated with childhood fat and fat-free mass.26 Deficits in infant linear growth are related to a variety of cognitive and wellbeing measures.18 Childhood obesity is related to a poor outcomes, including impaired
cardiorespiratory fitness, decreased motor skills, and decrease quality of life.114
We must understand whether distinct populations of HEU infants experience similar patterns of discordant growth in order to improve efforts to support the health and wellbeing of HEU infants. Research and policy initiatives are actively ongoing in nearly every country across the world and under a variety of different treatment regimens for the prevention of mother-to-child transmission of HIV. Therefore, it is of utmost importance that we determine the extent to which findings from one context can be generalized to another. Similar growth trends despite considerable differences in the socioecological context and HIV-treatment approach may suggest a common phenotype of discordant growth among HEU infants.
22
BAN was designed as a clinical trial before universal, lifelong ART was introduced, whereas Kabeho was a longitudinal observational study of the implementation of Option B+, the WHO initiative to provide all HIV-positive pregnant and lactating women lifelong ART.90 The WHO expected that this new approach would simplify service delivery, protect against transmission in future pregnancies, reduce HIV transmission to partners, and avoid stopping and starting treatment. All women participating in BAN were treatment naive, but some women in Kabeho had been on treatment for years. The countries in which these studies took place have meaningfully different levels of development, with Rwanda ranking 158th (out of 189) and Malawi ranking 171st on the Human Development Index.8 BAN started about ten years before Kabeho. These differences provide the socio-environmental variation which allows for a cross-context comparison of growth outcomes.
We investigate if there are similarities in the growth trajectories of these infants despite the significant differences in the study context. We first determine if infants in these two
populations show similar mean size and velocity of growth through SuperImpostion by Translation and Rotation (SITAR) analysis. We then examine if there are similarities in the underlying (latent) growth patterns observed in these populations. We also examine the relationship between known risk factors for poor growth and observed growth trends in these two populations to determine if these factors act similarly across contexts.
Materials and methods
Participants
23
required to have documented HIV infection, plan on remaining in the Kigali area after delivery, and provide consent.
The BAN study enrolled 2,373 treatment naïve, pregnant, HIV-positive women in Lilongwe, Malawi between March 2004 and February 2009. Women were randomized to three treatment arms (maternal ART, infant ART, and no treatment) and two nutrient supplement arms (lipid nutrient supplement or no supplement). To balance sample size and match treatment regimens between the studies, only the 530 women who were randomized to receive ART and enrolled after the beginning of the use of prophylactic cotrimoxizole in December 2005 were included in this analysis.115 One of the primary goals of the study was to assess the feasibility of exclusive breastfeeding for six months followed by rapid weaning, and women were counseled to follow this pattern.115
Additional information regarding study visits, data collection, and variable specification is provided in supplemental materials one.
Data analysis
We use two methods to examine growth: SITAR and latent class growth mixture modeling. These two methods are used because they allow for the examination of different aspects of growth. First, through SITAR, we compare the absolute, mean growth trends of these populations. Then, we use latent class growth mixture modeling to identify sub-groups of infants who experience similar patterns in the development of their linear deficits and relative weight excess compared to the WHO standard using z-scores. Both approaches allow for testing if baseline characteristics, such as country of origin, predict growth outcomes.
SuperImposition by Translation and Rotation (SITAR)
24
velocity and the timing parameter is not estimated. Sex was included in the estimation of the coefficients to allow for sex-specific differences in these coefficients where this improved model fit. Additional information regarding model specification and interpretation is provided in
supplemental materials two.
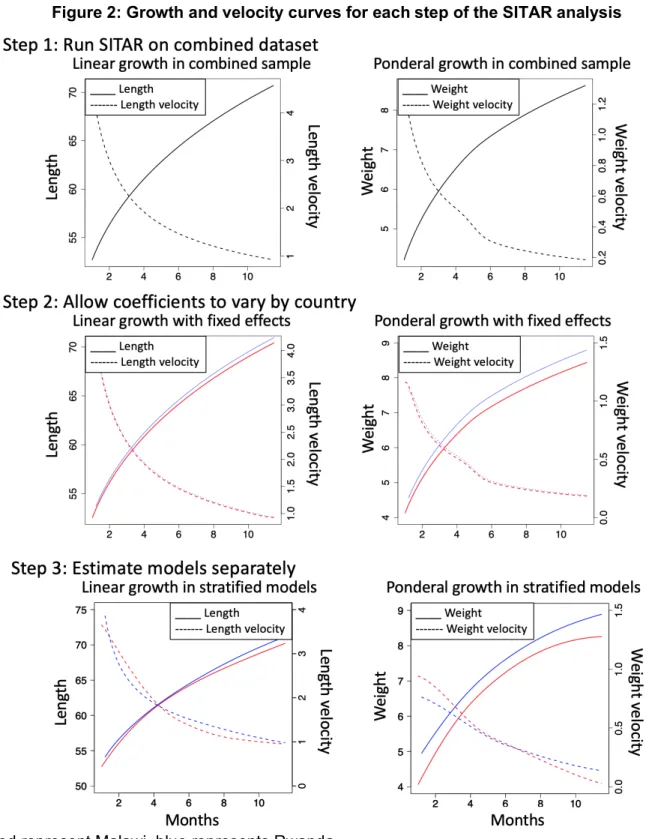
SITAR can be used to determine if two populations experience similar patterns in growth using the following steps:116
1. Run SITAR on the combined dataset and estimate coefficients for each infant. Use a t-test to compare the mean values of the coefficients between the two populations. 2. The SITAR model is then re-estimated, including population membership as a fixed
effect for the estimation of each coefficient (size and velocity).
3. If coefficients are different, SITAR is then fitted on each population separately to illustrate differences in the population mean curves.
In order to examine potential differences in the effect of known risk factors for poor growth by country of origin, we return to step one and test the relationship between these factors and the estimated size and velocity coefficients. The risk factors examined here are infant sex; neonatal WAZ; maternal CD4 at infant birth, height, age, and parity; and adherence to
recommendations for exclusive breastfeeding and treatment. An interaction is included to allow these variables to have different relationships based on country of origin. This allows us to determine if factors known to be related to growth have similar relationships with the size and velocity of growth across populations of HEU infants.
Latent growth trajectories
25
from Rwanda and Malawi) come from the same underlying distribution (that of HEU infants). However, this may not be the case if the underlying biological mechanisms and risk factors affecting the outcomes function differently in the two populations.118 For this analysis, repeated measures of weight and length at the same visit were averaged and converted to z-scores using the WHO growth standards.119 Z-scores are used here due to differences in the timing of
measurements which are less problematic in SITAR models.
Latent class models used the lcmm package in R to identify characteristic infant growth trajectories for WLZ and LAZ.120 The number of latent classes was determined based on Baysian information criterion (BIC), class size, and graphical plotting to maintain a sufficient number of infants per class to power the later analysis while maximizing the number of classes developed. Infants are assigned to the class to which they have the highest probability of belonging. Then, multinomial logistic regression is used to estimate odds of latent class
membership. The same set of baseline characteristics considered in the SITAR models is used here; however, these models are constructed in a stepwise fashion to separately examine the effects of baseline characteristics alone and then add-in characteristics that develop postnatally. This is because latent class growth mixture modeling assigns class membership from birth, and factors that develop after birth cannot affect class membership before they develop. As such, the interpretation of the effects of these postnatal factors must be more cautious.
Results
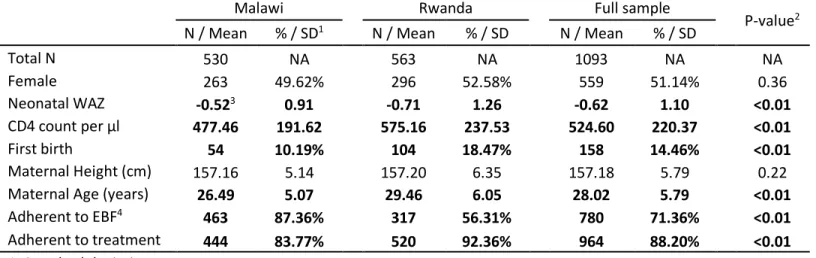
Sample population
26
disease and reflecting their naïve treatment status. Adherence to the exclusive breastfeeding recommendation was higher in Malawi, but adherence to treatment was lower.
SITAR
Step 1: Estimate SITAR on the combined sample of infants from Malawi and Rwanda
The linear growth SITAR model with the best fit includes a log transformation of infant age in months and two degrees of freedom. Female infants are shorter than males (-1.07 cm, p<0.001) and grow at a slower linear velocity (-0.03, p=0.003). In weight, the best fitting model includes log transformations of both weight and age. Due to the log transformation of weight, the size coefficient is multiplied by 100 and interpreted as a percentage. Female infants are lighter than males (-7.54%, p<0.001), but there is no difference in velocity. Therefore, sex is removed from the estimation of the velocity parameter to improve model fit. Average length, weight, and the respective velocities are plotted in figure 2. While linear growth velocity appears to have a smoothly parabolic decline, weight velocity shows a steep decline just before six months of age.
Relative to Rwandan infants, Malawian infants have smaller length-size coefficients (p<0.001). Differences in length-velocity coefficients approach statistical significance (p=0.06). Although Rwandan infants tend to have larger weight-size coefficients than Malawian infants (p<0.001), there is no difference in the weight-velocity parameter (p=0.88).
Step 2: Estimation of SITAR model including fixed effect for country
Based on results from the previous step, models for linear growth were re-run including a binary variable for country of origin as a fixed effect in the estimation of the size and velocity coefficients. Being Malawian is associated with smaller mean length (size= -0.46 cm, p<0.001), but, once this is accounted for, there is no difference in mean linear growth velocity (p=0.11).
27
ponderal growth model. Infants from Malawi are lighter than those from Rwanda (size = -4.60%, p<0.001).
Step 3: Estimation of SITAR within each individual dataset
SITAR models were fit separately for Malawian and Rwandan infants. Linear growth velocities in the two populations are similar and cross several times. In contrast, Malawian infants have a faster weight gain velocity early in life, but also experience a more rapid decline in velocity than Rwandan infants. However, for much of the study period, weight gain velocities are similar.
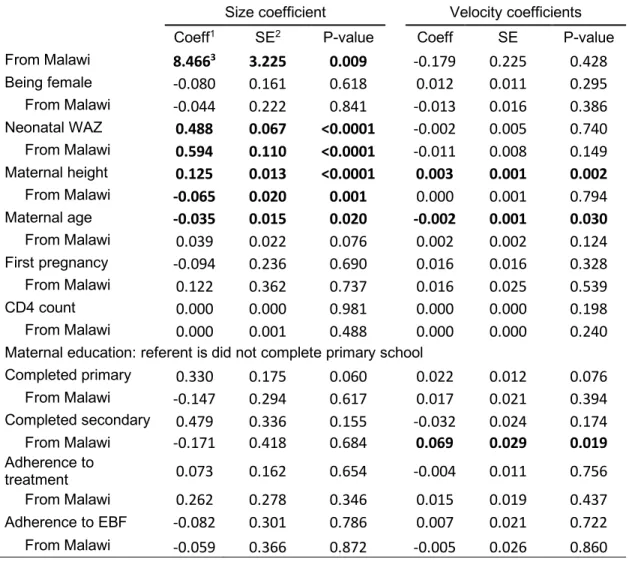
Predictors of SITAR coefficients by study membership
Infants with higher neonatal WAZ and taller mothers have larger mean size in length and weight than those with smaller neonatal WAZ and shorter mothers (Table 5). The effect of neonatal WAZ is more pronounced in Malawian infants, but the effect of maternal height is less in Malawian infants. Taller mothers tend to have infants with relatively accelerated linear growth. Infants of older mothers tend to have shorter average length and weight and slower linear growth. In Malawi, older mothers also have infants with accelerated ponderal growth. Once these factors are accounted for, infants in the Malawian cohort have larger mean size in length than those in the Rwandan cohort.
Latent growth trajectories
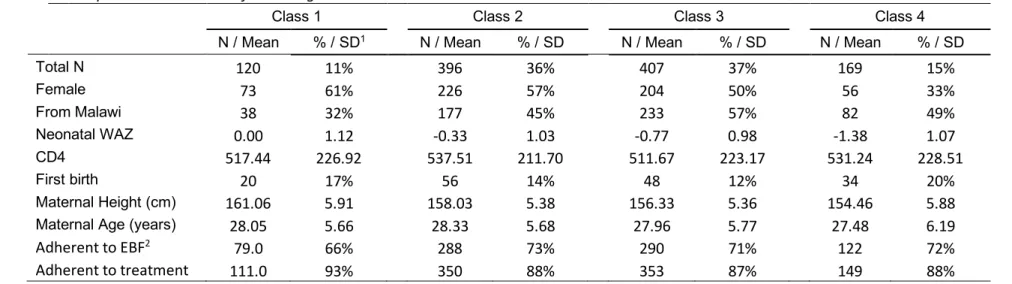
Four linear growth trajectory classes were identified (Figure 3). Trajectories are roughly parallel, and represent persistent length differences apparent at birth. All trajectories have declines in average z-score of approximately one unit in the first year of life. The largest class, class three, consists of 38% of the study sample. It has a mean z-score of -1.1 at birth and -1.8 by 12 months (Table 6).
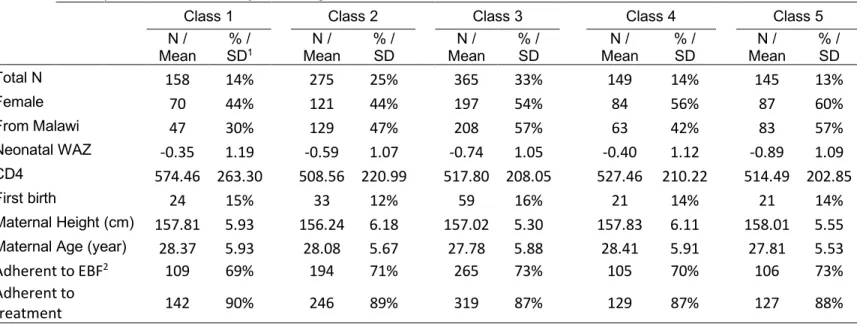
Five trajectory classes were identified for WLZ. Three are roughly parallel, have
28
z-scores. The largest class, class three, consisted of 33% of the study sample (Table 7). Mean z-score was 0.4 at one month and declined to -0.3 by 12 months.
Predictors of class membership
The three classes with LAZ less than zero include approximately equal proportions of infants from Malawi and Rwanda (Table 6). Females and infants with higher neonatal WAZ, taller mothers, and mothers with a primary school education are less likely to be in the shortest LAZ class. Infants with taller mothers and with higher neonatal WAZ are more likely to be in the two tallest LAZ classes. The effect of neonatal WAZ in increasing odds of being in the two tallest classes is more pronounced in Malawian infants than Rwandan infants. Infants with older
mothers are less likely to be in the tallest class.
Four of the five WLZ classes have similar proportions of infants from Malawi and Rwanda (Table 7). Although the highest WLZ class is predominantly infants from Rwanda, country of origin does not significantly predict class membership. Increased neonatal WAZ increases odds of being in the heaviest class. Adherence to breastfeeding recommendations or treatment did not affect these results, as such, results from these models are not presented.
Because two sets of parallel trends were identified, a post hoc probit was conducted to examine the relationship between these same variables and belonging to a class with
decreasing WLZ relative to classes with increasing WLZ. Infants with taller mothers have lower odds of decreasing WLZ (OR = 0.988). Increasing neonatal WAZ is also related to decreasing odds of decreasing WLZ (OR = 0.868), with a smaller effect among Malawian infants (OR = 0.891). Having a mother who completed primary school increased the odds of belonging to a class with decreasing WLZ (OR = 1.188) among Rwandan infants. But, but the effect was reversed among Malawian infants (OR = 0.833).
Discussion
29
gain, and underlying patterns in growth trajectories. However, these infants had differences in risk factors that are context specific. The relationships between maternal height and neonatal WAZ and growth patterns varied by country. Although infants from the two countries have different mean sizes, once differences in mean size were accounted for in step two of the SITAR analysis, length and weight velocities are not different between the studies. The bottom panels of figure 2 show that the length, length velocity, and weight velocities of these two populations are similar over much of the study period. Absolute weight is somewhat lower among Malawian infants.
30
After comparing mean growth outcomes, we further investigated the latent growth patterns within these populations. The latent growth trajectory groups are similar among infants from both studies. In length and relative weight, most of the trajectory classes developed are composed of 40-60% infants from each study. The highest LAZ and WLZ classes have lower representation of Malawian infants, but this relationship is not statistically significant. This is consistent with the findings from the SITAR analysis which indicate that Malawian infants have lower mean size. Therefore, we conclude that mean and sub-group patterns in growth between these two populations are generally similar, with Malawian infants being somewhat smaller than Rwandan infants.
The parallel trends in linear growth indicate patterns of infant linear growth are largely determined pre- or perinatally and there is strong tracking. In contrast, work limited to the Kabeho study identified one class of infants that did not track but crossed another class and became shorter on average.16 However, in the combined sample, this class is not identified, likely due to the smaller number of classes which were found. Similar tracking was not observed for relative weight. WLZ-classes one and two have approximately equal mean WLZ at one month, but diverge rapidly thereafter. This implies the possibility of a perinatal or early postnatal exposure which alters the weight gain patterns of these infants.
Many of the same factors that predicted the SITAR growth coefficients in our study also related to odds of growth class membership. Previously, these factors were found to be related to latent class membership within the Rwandan cohort as well.16 However, the effect of neonatal WAZ is actually more pronounced in Malawian infants.
31
important for the development of programs and policies to support the health and wellbeing of HEU infants. It re-affirms the importance of tailoring interventions to each setting and context. Factors that put an infant at risk in one setting may have a different effect in another setting. The identification of at risk infants will help with the targeting of interventions. Policy makers must use extreme caution when borrowing approaches from seemingly similar contexts as the
ultimate impact could be quite different. While interventions can be adopted from other contexts, they should always be re-evaluated in new settings. Future studies should compare the growth trajectories of HEU infants in similar contexts but exposed to different treatment regimens and in different contexts but exposed to similar treatment regimens to disentangle the effects of the environment form those of treatment approaches.
32 Conclusions
Tables
Table 4: Descriptive statistics of the study sample
Malawi Rwanda Full sample P-value2
N / Mean % / SD1 N / Mean % / SD N / Mean % / SD
Total N 530 NA 563 NA 1093 NA NA
Female 263 49.62% 296 52.58% 559 51.14% 0.36
Neonatal WAZ -0.523 0.91 -0.71 1.26 -0.62 1.10 <0.01
CD4 count per µl 477.46 191.62 575.16 237.53 524.60 220.37 <0.01
First birth 54 10.19% 104 18.47% 158 14.46% <0.01
Maternal Height (cm) 157.16 5.14 157.20 6.35 157.18 5.79 0.22
Maternal Age (years) 26.49 5.07 29.46 6.05 28.02 5.79 <0.01
Adherent to EBF4 463 87.36% 317 56.31% 780 71.36% <0.01
Adherent to treatment 444 83.77% 520 92.36% 964 88.20% <0.01 1. Standard deviation
2. Means were compared across sites using t-tests and chi-squared tests as appropriate. 3. Bold represent p-value<0.05
34
Table 5: Predictors of SITAR coefficients
Length
Size coefficient Velocity coefficients Coeff1 SE2 P-value Coeff SE P-value From Malawi 8.4663 3.225 0.009 -0.179 0.225 0.428
Being female -0.080 0.161 0.618 0.012 0.011 0.295 From Malawi -0.044 0.222 0.841 -0.013 0.016 0.386 Neonatal WAZ 0.488 0.067 <0.0001 -0.002 0.005 0.740 From Malawi 0.594 0.110 <0.0001 -0.011 0.008 0.149 Maternal height 0.125 0.013 <0.0001 0.003 0.001 0.002 From Malawi -0.065 0.020 0.001 0.000 0.001 0.794 Maternal age -0.035 0.015 0.020 -0.002 0.001 0.030 From Malawi 0.039 0.022 0.076 0.002 0.002 0.124 First pregnancy -0.094 0.236 0.690 0.016 0.016 0.328 From Malawi 0.122 0.362 0.737 0.016 0.025 0.539 CD4 count 0.000 0.000 0.981 0.000 0.000 0.198 From Malawi 0.000 0.001 0.488 0.000 0.000 0.240 Maternal education: referent is did not complete primary school
Completed primary 0.330 0.175 0.060 0.022 0.012 0.076 From Malawi -0.147 0.294 0.617 0.017 0.021 0.394 Completed secondary 0.479 0.336 0.155 -0.032 0.024 0.174 From Malawi -0.171 0.418 0.684 0.069 0.029 0.019 Adherence to
35 Weight
Size coefficient Velocity coefficients Coeff SE P-value Coeff SE P-value From Malawi 0.274 0.190 0.149 -0.254 0.327 0.437 Being female -0.007 0.009 0.486 0.010 0.016 0.543 From Malawi 0.002 0.013 0.886 -0.028 0.007 <0.0001 Neonatal WAZ 0.032 0.004 <0.0001 -0.029 0.011 0.010
From Malawi 0.022 0.006 0.001 0.001 0.001 0.479 Maternal height 0.004 0.001 <0.0001 0.001 0.002 0.568 From Malawi -0.003 0.001 0.021 -0.001 0.002 0.545 Maternal age -0.002 0.001 0.037 0.002 0.002 0.424 From Malawi 0.002 0.001 0.063 0.056 0.024 0.019 First pregnancy -0.012 0.014 0.380 -0.024 0.037 0.512 From Malawi 0.014 0.021 0.505 0.000 0.000 0.741 CD4 count 0.000 0.000 0.568 0.000 0.000 0.895 From Malawi 0.000 0.000 0.823 0.012 0.018 0.483 Maternal education: referent is did not complete primary school
Completed primary 0.007 0.010 0.496 0.024 0.030 0.429 From Malawi 0.010 0.017 0.568 0.013 0.034 0.696 Completed secondary 0.016 0.020 0.427 0.013 0.042 0.753 From Malawi -0.003 0.025 0.908 0.003 0.016 0.832 Adherence to
treatment 0.013 0.010 0.160 0.005 0.028 0.857 From Malawi 0.007 0.016 0.669 -0.033 0.030 0.275 Adherence to EBF -0.010 0.018 0.559 0.036 0.037 0.333 From Malawi 0.016 0.021 0.447 -0.021 0.023 0.354 1. Coefficient
2. Standard error
36
Table 6: Description of latent length-class and odds of class membership
Descriptive characteristics of each length-class
Class 1 Class 2 Class 3 Class 4
N / Mean % / SD1 N / Mean % / SD N / Mean % / SD N / Mean % / SD
Total N 120 11% 396 36% 407 37% 169 15%
Female 73 61% 226 57% 204 50% 56 33%
From Malawi 38 32% 177 45% 233 57% 82 49%
Neonatal WAZ 0.00 1.12 -0.33 1.03 -0.77 0.98 -1.38 1.07
CD4 517.44 226.92 537.51 211.70 511.67 223.17 531.24 228.51
First birth 20 17% 56 14% 48 12% 34 20%
Maternal Height (cm) 161.06 5.91 158.03 5.38 156.33 5.36 154.46 5.88
Maternal Age (years) 28.05 5.66 28.33 5.68 27.96 5.77 27.48 6.19
Adherent to EBF2 79.0 66% 288 73% 290 71% 122 72%
37
Odds of length-class membership by baseline characteristics
Class 1 Class 2 Class 3 Class 4
OR3 P-value OR P-value REF OR P-value
From Malawi 47.751 0.651 0.197 0.737 REF 0.001 0.287
Female 1.413 0.292 1.184 0.466 REF 0.339 0.0014
From Malawi 1.655 0.350 1.271 0.451 REF 1.484 0.367
Neonatal WAZ 1.514 0.004 1.322 0.006 REF 0.632 0.000
From Malawi 6.573 0.000 1.808 0.001 REF 0.723 0.143
Maternal height 1.206 0.000 1.062 0.004 REF 0.921 0.003
From Malawi 0.954 0.371 0.999 0.982 REF 1.045 0.267
Maternal age 0.941 0.047 0.983 0.430 REF 1.026 0.377
From Malawi 1.030 0.583 1.016 0.615 REF 0.939 0.143
First pregnancy 0.862 0.756 1.077 0.827 REF 1.200 0.681
From Malawi 5.023 0.057 1.374 0.560 REF 1.476 0.532
CD4 count 0.999 0.228 1.000 0.586 REF 0.999 0.251
From Malawi 1.001 0.667 1.001 0.053 REF 1.002 0.108
Maternal education: referent is did not complete primary school
Completed primary 1.340 0.403 0.772 0.298 REF 0.491 0.042
From Malawi 1.114 0.888 1.017 0.967 REF 1.117 0.845
Completed secondary 1.376 0.604 0.858 0.758 REF 0.331 0.205
From Malawi 1.215 0.834 0.877 0.827 REF 1.376 0.748
1. Standard deviation 2. Exclusive breastfeeding 3. Odds ratio
38
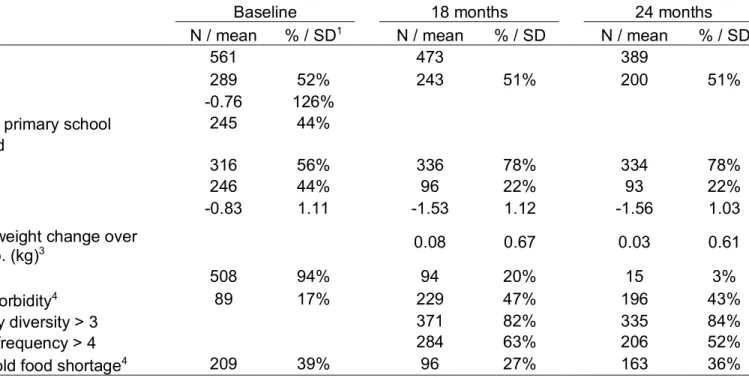
Table 7: Description of latent weight-class and odds of class membership
Descriptive characteristics of each weight-class
Class 1 Class 2 Class 3 Class 4 Class 5
N / Mean
% /
SD1 Mean N / % / SD Mean N / SD % / Mean N / % / SD Mean N / % / SD
Total N 158 14% 275 25% 365 33% 149 14% 145 13%
Female 70 44% 121 44% 197 54% 84 56% 87 60%
From Malawi 47 30% 129 47% 208 57% 63 42% 83 57%
Neonatal WAZ -0.35 1.19 -0.59 1.07 -0.74 1.05 -0.40 1.12 -0.89 1.09 CD4 574.46 263.30 508.56 220.99 517.80 208.05 527.46 210.22 514.49 202.85
First birth 24 15% 33 12% 59 16% 21 14% 21 14%
Maternal Height (cm) 157.81 5.93 156.24 6.18 157.02 5.30 157.83 6.11 158.01 5.55 Maternal Age (year) 28.37 5.93 28.08 5.67 27.78 5.88 28.41 5.91 27.81 5.53
Adherent to EBF2 109 69% 194 71% 265 73% 105 70% 106 73%
Adherent to