Article
Minimum income protection
and EU coordination
Jinxian Wang
Central South University, Changsha, China
Olaf van Vliet
Leiden University, the Netherlands
Kees Goudswaard
Leiden University, the Netherlands
Abstract
A number of studies suggest that the Europeanisation process is having a profound impact on national labour market policies. Nevertheless, rather little research has been devoted to the development of social assistance schemes across countries and over time. Relying on two new indicators, benefit levels and replacement rates, we examined the relationship between the Lisbon Strategy and changes in national social assistance benefits. We found no robust results for the first years of the Lisbon Strategy. However, after its re-launch in 2005, there was a positive association between the Lisbon Strategy and social assistance benefit levels. In addition to the Lisbon Strategy, domestic political, institutional and several economic factors were significantly associated with social assistance benefits.
Keywords
comparative political economy, Europeanisation, welfare state reform, social assistance benefits
Introduction
Europeanisation can be defined as the impact of European integration on member states (Radaelli 2002). More specifically, it refers to the impact on policies, polities and politics. In the field of social policy, the process of Europeanisation has been visible since the introduction of the Lisbon Strategy. After the Lisbon Summit in 2000, the fight against poverty and social exclusion has become one of the central tenets in the modernisation of the European social model (European Council 2000a). A number of studies show that the Europeanisation process has triggered or contributed to domestic labour market policy reforms (Armingeon 2007, Paetzold and Van Vliet
Corresponding author:
Olaf van Vliet, Department of Economics and at the Institute of Public Administration, Leiden University. E-mail: [email protected]
European Journal of Social Security 2018, Vol. 20(3) 253–271 ªThe Author(s) 2018
Article reuse guidelines: sagepub.com/journals-permissions DOI: 10.1177/1388262718798896 journals.sagepub.com/home/ejs
2014, Swank 2011, Van Vliet and Koster 2011). Nevertheless, relatively little research has been devoted to the relationship between the Lisbon Strategy and domestic social assistance policy reforms. This is remarkable as these benefit schemes play a central role in combating poverty and the pursuit of social inclusion. As the last-resort safety net, social assistance benefits are important instruments for providing social protection, which was emphasised by the Lisbon Council (European Council 2000a). Furthermore, since the European coordination of social policy is still based on legally non-binding means of governance, it is important to acquire insight into the domestic impact of the Lisbon Strategy.
In this study, our aim was to complement the existing literature by exploring the Europeanisa-tion of naEuropeanisa-tional social assistance policies. However, it is difficult to assess the extent to which the Lisbon Strategy has contributed to domestic social assistance benefit reforms.
Assessing the impact of the European strategy might be over-determined due to its non-binding character (Zeitlin 2009). Hence, the aim of this study was to analyse changes in social assistance benefits after the launch of the Lisbon Strategy in 2000 and its re-launch in 2005, and to explain the cross-national variation in benefit policy changes, accounting for several political, economic and institutional factors.
We seek to make three contributions with this article. First, existing Europeanisation studies have focused on the Lisbon Strategy that was launched in 2000. In 2005, the governance structure was modified in order to increase its effectiveness and the strategy was then re-launched. This study accounts for this re-launch. Second, the empirical analysis is based on two new indicators for comparing the levels of social assistance benefits across countries and over time, namely, net benefit levels and net replacement rates (Wang and Van Vliet 2016b). Third, the analysis of the determinants of benefit levels in welfare state programmes such as unemployment benefits has been a central subject in the comparative political economy literature (e.g. Allan and Scruggs 2004, Korpi and Palme 2003). Nelson (2013a) and Van Vliet and Wang (2017) have examined the determinants of social assistance benefits. With regard to these two studies, the contribution of the current study is that it includes the role of EU coordination in the analysis.
Europeanisation of social assistance benefits
Social assistance benefits
In the welfare state literature, the effectiveness and efficiency of low-income targeting in reducing income inequality and financial poverty have been extensively studied (Smeeding 2006). Recent studies show that in many European countries the levels of social assistance benefits are not adequate to lift households out of poverty (Figari et al. 2013, Ho¨lsch and Kraus 2006, Marchal et al. 2014, Nelson 2010, Nelson 2013a, Van Mechelen and Marchal 2013, Wang and Van Vliet 2016a).
Lisbon Strategy 2000
In 1992, the European Council suggested that Member States should recognise ‘the basic right of a person to sufficient resources and social assistance to live in a manner compatible with human dignity’ under Recommendation 92/441/EEC (European Council, 1992). This recommendation set out common criteria to ensure adequate social assistance. Together with other recommendations, the 92/441/EEC Recommendation was an important step in the evolution of a European agenda against poverty and social exclusion (Anderson 2015).
A new impetus was given at the European Council of Lisbon in March 2000. On this occasion, the Lisbon Council incorporated social inclusion as something intrinsic to the overall strategy of the Union, setting an ambitious goal for the EU ‘to become the most competitive and dynamic knowledge-based economy in the world capable of sustainable economic growth with more and better jobs and greater social cohesion’ during the period 2000–2010 (European Council 2000b, p.2). As such, the Lisbon Strategy was a turning point in the discourse on the social dimension of the European integration process. Its ambition was to ensure that each citizen can count on basic rights and adequate resources (Ferrera et al. 2002). Later, in December 2000, the Nice European Council approved a set of objectives for the fight against poverty and social exclusion. In this respect, social assistance was considered as an essential safety net for the most vulnerable groups in society (European Council 2000a).
The Lisbon Strategy was based on an intergovernmental means of EU governance, the Open Method of Coordination (OMC). The OMC has been applied to several policy fields, such as employment and education. At the Lisbon summit, the European Council extended the OMC to cover a wide range of social policy areas, including social inclusion and the modernisation of social protection systems (Barcevicˇius et al. 2014). For the coordination of social policies, OMC Social Inclusion was created. Leaving the responsibility for social policy to policy-makers at national level, it proposes legally non-binding guidelines, national action plans, peer reviews, joint evalua-tion reports and recommendaevalua-tions (Ferrera et al. 2002). That is, member states agree on a set of non-binding common objectives, prepare national action plans on a regular basis to meet these objectives, the European Commission then evaluates these plans and publishes them in Joint Commission/Council reports, and social indicators are defined to allow for performance monitor-ing and frame convergence (Daly 2008). The social indicators encompass, among other thmonitor-ings, financial poverty, income inequality and long-term unemployment. As such, the OMC intends to disseminate best practices and achieve greater convergence towards the Lisbon goals.
Lisbon Strategy 2005
structure, multiple goals and actions, and an unclear division of responsibilities and tasks were responsible for the limited effectiveness of the Lisbon Strategy in its early years (European Commission 2010). In response to this critical evaluation, the Lisbon Strategy was re-launched by the Barroso Commission in 2005. First, a stronger EU framework was developed. In this revised strategy, the most important change was the procedural re-organisation into three main steps, namely, defining a series of European integrated guidelines, implementing these guidelines through national reform programmes, and monitoring the progress country by country (Borra´s and Radaelli 2011). Following these changes, the roles of the Commission, the Council and the member states have been redefined and have become clearer (Barcevicˇius et al. 2014).
Second, compared with the broad ranging Lisbon Strategy 2000, the objectives of the Lisbon Strategy 2005 on social inclusion were narrowed: ‘Ensure the active social inclusion of all by promoting participation in the labour market and by fighting poverty and exclusion among the most marginalised people and groups, guarantee access for all to the basic resources, rights and social services needed for participation in society. . ..’ (European Commission 2005).
Third, the OMCs in the fields of social inclusion, pensions and health and long-term care were streamlined and interdependent policy areas were integrated into a new Social OMC. The intention of this institutional change was that synergies could be generated and that complex challenges could be approached more effectively (Barcevicˇius et al. 2014).
Overall, the influence of the OMC can be defined either as substantive or as procedural, mainly through the mechanisms of peer pressure, mutual learning, socialisation, discursive diffusion, creative appropriation and external support (De la Porte and Pochet 2002, Hamel and Vanhercke 2009, Weishaupt 2014b). Substantive influence refers to shifts in actors’ positions or the weights they put on particular issues, or shifts in the legislated, administrative or organisational rules and practices. Procedural impact can be understood as the enhancement of horizontal coordination and integration between interdependent policy fields, enforcement of vertical coordination between levels of governance, rising involvement of non-state actors and subnational actors, and improve-ment in national steering and statistical capacities (Weishaupt 2014b).
Both substantive and procedural effects have been found in Belgium, France, Portugal, Spain and the United Kingdom. In Denmark and Germany, the OMC has had mainly substantive effects and in Italy mainly procedural effects have been found (Weishaupt 2014b). For instance, in Belgium, procedural influences included building statistical capacity, adopting national and sub-national poverty targets, promoting both horizontal coordination in the Brussels region and vertical coordination by including non-governmental stakeholders. Substantively, the OMC exerted impor-tant leverage effects to justify raising the levels of minimum income benefits for the elderly poor (Vanhercke 2014). In Italy, the Social OMC contributed to the launch of a series of surveys and studies on homelessness and poverty conditions, which were aimed at developing adequate ser-vices for the most vulnerable people for social insertion (PPMI 2011: 120). In Denmark, the Social OMC has placed and maintained the issue of poverty on the political and public agendas and ideational and policy exchange percolated through to the development of homelessness strategies (De la Porte 2014).
developments of national social assistance benefit schemes and we expected the upward trend to be greater after 2005.
Hypotheses on domestic politics, institutions and socioeconomic
developments
Domestic politics and institutions
Case studies show that the influence of the OMC varies across the member states, depending on a country’s domestic institutional and political situation (Weishaupt 2014b). In the comparative political economy literature on welfare states, partisan preferences are traditionally considered to play an important role in the explanation of policy reform. The general proposition is that left-wing parties are more in favour of generous social transfers than are right-left-wing parties (Allan and Scruggs 2004, Korpi and Palme 2003, Potrafke 2016, Swank 2013). In line with this literature, we expect left-wing parties to be positively associated with social assistance benefit levels.1 Yet, Jessoula et al. (2014) recently argued that left- and right-wing preferences might differ from the general proposition. Left-wing parties may be more likely to support broader (occupational) social insurance programmes rather than social assistance benefits, and right-wing parties might support social assistance benefits over social insurance programmes, as a less expensive programme to help those harmed by market failures.
Similarly, trade unions are considered as important actors in welfare state reforms in the sense that they are strong defenders of social insurance programmes (Rueda 2007, Starke 2006). This also applies to the domestic impact of the OMC Social Inclusion when social partners are consulted in the policy-making processes (Jacobsson and Johansson 2009). Hence, we expect a positive association between the strength of trade unions and social assistance benefits.2
Furthermore, political institutions are often considered as relevant factors in welfare state reforms. A proportional representation electoral system provides more institutional opportunities for parties with egalitarian policy goals to resist benefit cuts (Swank 2002). Therefore, it can be expected that proportional representation electoral systems are positively related to social assis-tance benefit levels.
Socioeconomic developments
In addition to Europeanisation and domestic political institutions, the comparative welfare state literature indicates that reforms may also be triggered or affected by a number of socio-economic developments. High levels of unemployment lead to higher expenditures on unemployment and social assistance benefits. The resulting budgetary pressure may trigger social assistance benefit reform. Thus, it can be expected that unemployment levels will be negatively associated with social assistance benefit levels (Brady and Lee 2014, Korpi and Palme 2003). Furthermore, GDP
1. A limitation of this study at the country level is that the partisan composition of regional governments (in federal states) is not taken into account.
per capita is a frequently used variable in the welfare-state literature. According to Wagner’s law, more economically developed countries have more generous social protection systems (Meltzer and Richard 1983). Welfare state reforms may also be influenced by globalisation. There are two central hypotheses regarding the relationship between globalisation and welfare state reform. According to the efficiency hypothesis, governments implement efficiency-oriented reforms in order to offer attractive conditions for firms (Garret and Mitchell 2001). In contrast, the compen-sation hypothesis states that governments expand welfare states to compensate people who face increased economic risks as a result of globalisation (Rodrik 1998). In addition to the effects of globalisation, increased economic risks may also stem from structural changes on domestic labour markets (Iversen and Cusack 2000). Thus, we tested the hypothesis that deindustrialisation is positively related to social assistance benefits.
Data and methods
Dependent variable
The dependent variable of this study is the change of social assistance benefit levels. We relied on two indicators to measure these benefit levels (Wang and Van Vliet 2016b). First, we used the real net benefit level, which is a relatively straightforward measure of the generosity of social assistance benefits (Olaskoaga et al. 2013). Data on benefit levels were taken from the Social Assistance and Minimum Income Protection Interim Dataset (SaMiP, Nelson 2013b).3Net minimum income benefits are defined as the net income from a benefit package consisting of basic social assistance, child supplements, refundable tax credits and other benefits.4 These benefit levels are expressed in US dollars, adjusted for Purchasing Power Parity (PPP, each year PPP for the United States is equal to 1) and inflation (CPI 2005¼100), which enabled us to compare benefits across countries and over time. Data on PPPs were taken from the Penn World Table (Heston et al. 2012) and for the CPI we used data from the World Development Indicators (World Bank 2012).5
3. The SaMiP database is in particular well suited for analyses of relatively long periods. Given the detailed simulations, the CSB-MIPI database and the OECD’s Benefits and Wages-dataset provide more information on the generosity of minimum income benefits from a cross-section perspective. For instance, SaMiP is focused on general means-tested benefits, whereas CSB-MIPI looks at benefits for the able-bodied in particular. For an excellent comparison of the characteristics of the different datasets, see Van Mechelen et al. (2011). An important advantage of the SaMiP database for our study is that it contains annual data from 1990 onwards, whereas CSB-MIPI and the OECD data start in the 2000s.
4. One-time social assistance payments to cover unexpected and urgent needs or regular supplements to cover exceptional needs are not included in this benefit package. Also, the coverage rate of social assistance benefits is not included, because internationally comparable information is not available for a longer period.
5. An additional step is required for the Eurozone countries, as the PPPs in the years before the introduction of the euro are also expressed in euros, whereas the benefit levels are expressed in the national currencies. For the Eurozone countries,
the real benefit levels are calculated as follows: real minimum income benefit¼((minimum income benefit/exchange
rate from euro to national currency)/PPP) *(100/CPI). To convert the national currencies into euros, the study relies on
exchange rate data from the European Commission (2014). For the non-Eurozone countries, real benefit level¼
As a second indicator, we used the net minimum income replacement rate to examine the generosity of social assistance benefits relative to the wages in a country.6This measure is defined as the ratio of the net benefit level to the net average production worker wage. The net average production worker wage refers to the in-work wage after deducting taxes. As such, this minimum income replacement rate is constructed in a similar way as, and thus is comparable to, unemploy-ment benefit replaceunemploy-ment rates (Allan and Scruggs 2004, Van Vliet and Caminada 2012).
For both the real benefit level and the replacement rate, we took the simple average of the indicators calculated for three household types: single persons, lone parents with two children, and households with two parents and two children.7In the sensitivity analyses, we tested our hypoth-eses for each family model separately.
Explanatory variables
To examine the development of national social assistance benefits since the Lisbon Strategy, we followed the approach used in empirical studies on the relationship between European coordina-tion and nacoordina-tional labour market policies, namely dummy variables (e.g. Armingeon 2007, Swank 2011). First, we included a variable that captures the effect of the Lisbon Strategy 2000. Specified as a dichotomous variable, it is scored 0 for EU countries for the years before 2000 and 1 for the years afterwards. As a second Europeanisation variable, we included a dichotomous variable that is scored 0 for the EU countries before 2005 and 1 afterwards (2005 – 2009) to assess the impact of the revised Lisbon Strategy. Hence, this dummy variable not only captures changes in the year directly after the re-launch, but also in later years.8
To examine the role of domestic politics and trade unions in social assistance benefit reforms, we included the percentage of total cabinet posts held by left-wing parties and union density, respectively. Data for left-wing parties and union density were taken from the Comparative Political Data Set (Armingeon et al. 2012). To account for the variation in national electoral institutions, we included a dummy variable, scored 1 for a proportional representation system and 0 otherwise. Data were derived from the Dataset of Political Institutions (Beck et al. 2001).
To account for the constraining effect of unemployment on social policy budgets, we used unemployment rate data from the World Development Indicators Dataset (World Bank 2012). For GDP per capita, we relied on the Penn World Table (Heston et al. 2012). In addition, we used trade openness and capital openness measured as a percentage of GDP to control for the effects of economic openness of a country, relying on data from the World Development Indicators Dataset (World Bank 2012). Finally, Iversen and Cusack’s (2000) measure of deindustrialisation was constructed based on data from the OECD Labour Statistics (2015).
6. It should be noted that there are several other aspects to generosity such as eligibility criteria, work requirements, changes in means tests.
7. These are the household types for which data is available. Ideally, one would use a weighted average of the household types, as the representativeness of the household types varies across countries and over time. Unfortunately, such information is not available. Recently, the OECD has published the Social Benefit Recipients Database but the data for social assistance benefit recipients are only available for the period 2007-2012 for lone parents (OECD 2016). 8. We also ran the regressions with different cut-off-years: 2001 and 2006 instead of 2000 and 2005. The results are
Method
Identifying the role of the Lisbon strategy in domestic policy-making is a methodological chal-lenge. This relates to the more general issue in Europeanisation research of isolating the impact of European integration from national and global dynamics, which essentially comes down to the lack of a counterfactual (Haverland 2007). Following earlier studies, (Armingeon 2007, Paetzold and Van Vliet 2014, Swank 2011, Van Vliet and Koster 2011) our approach to this issue entails a comparative analysis based on pooled time-series-cross-sectional data. To control for global trends in social assistance benefits, a group of seven non-EU countries – Australia, Canada, Japan, New Zealand, Norway, Switzerland, the United States – are included, in addition to 14 EU countries: Austria, Belgium, Denmark, Finland, France, Germany, Ireland, Italy, Luxembourg, the Nether-lands, Portugal, Spain, Sweden, the United Kingdom. Furthermore, as discussed above, a number of variables are included to control for domestic dynamics. The main advantage of this approach (for instance compared to a case-study design) is that it utilises considerable variation that stems from the large number of countries and years. In addition, it enables us to systematically control for domestic factors. This combination provides leverage for identifying any impact of the Lisbon Strategy. The main limitation of this approach (for instance compared to a case-study design) is that it does not rely on detailed information on policy processes.
The year 1990 was taken as the first data year because earlier data on social assistance benefits were not available. The analysis ends in 2009 because this is the last year of the Lisbon Strategy. Its successor, the Europe 2020 Strategy, was launched by the Commission in 2010. As this coincides with the peak of the economic crisis, it is not really possible to distinguish the impact of Europe 2020 on domestic social policy reform from the impact of the crisis. Therefore, Europe 2020 was not included in the analysis. Given the fact that Eastern European countries entered the EU in 2004 2007 and 2013, there is little or no time-variation in the Lisbon Strategy variables in these countries. Thus, Eastern European member states were not included in the analyses.
To analyse the data, the study employed an error correction model (ECM). This is a conventional estimator in comparative political economy studies on welfare state reform (e.g. Ansell and Gingrich 2013, Busemeyer 2009, Iversen and Cusack 2000, Swank 2011). Because an ECM can be used for stationary and integrated data alike, it is capable of overcoming issues of unit roots (De Boef and Keele 2008). Moreover, models relying on level variables only are said to be prone to high levels of autocorrelation, whereas ECMs proved to tone down this effect (Podesta` 2006). Since an ECM stipulates that both the dependent and a number of the independent variables are measured as first differences, our model accounts for issues of stationarity and autocorrelation, two problems that often make pooled time-series cross-section regression complicated (Kittel and Winner 2005). In an ECM, first-differences of the dependent variable are regressed on the lagged level of the dependent variable and on both the first-differences and the lagged levels of the independent variables. Short-term transitory effects are captured by the first differenced variables and long-term structural effects are captured by the lagged levels (De Boef and Keele 2008). Our estimations took the following form:
DYi;t¼ a þ bYi;t1þ
X
djXji;t1þ
X
U
jDX j
i;tþei;t ð1Þ
Here,arefers to the intercept.DYi,tstands for the changes in the dependent variable in country
iand yeart.9Yi,t-1represents the lagged levels of the dependent variable. The first differences and
lagged levels of the explanatory variables are expressed byDXi,tand Xi,t-1respectively andei,tis
the error term.10
Panel-corrected standard errors were used to correct for panel heteroscedasticity and contem-poraneous spatial correlation (Beck and Katz 1995). The main regressions did not include fixed effects, as a dynamic model may generate inconsistent estimations in that case (Nickell 1981). However, fixed effects models are presented here as robustness checks.
Empirical results
Trends in the minimum income indicators
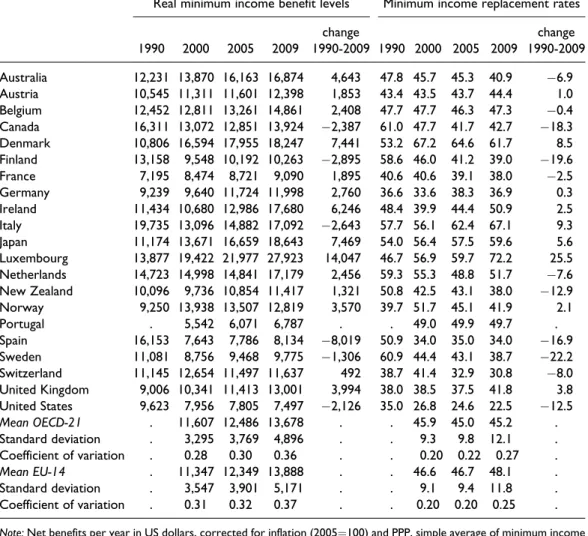
Table 1 presents the developments in the real levels of annual net minimum income benefits and of net minimum income replacement rates over the period 1990–2009.11 The data show that the minimum income benefit levels vary substantially across countries. In 2009, the highest benefit levels could be observed in Luxembourg, followed by Japan, Denmark, Ireland and Italy. Portugal, Spain and the United States are the countries with the lowest benefit levels. Remarkably, between 1990 and 2005, the average benefits were higher in the non-EU OECD countries than in the EU countries. In 2009, however, benefit levels were on average higher in the EU countries than in the non-EU countries.
The data show considerable variation over time. In most countries, benefit levels were raised in real terms between 1990 and 2009, implying that the increase in benefit levels exceeded that in consumer prices. The largest increases occurred in Luxembourg, Japan and Denmark. Meanwhile, there are also several countries where benefit levels were reduced in this period. The sharpest decrease can be observed in Spain, followed by Finland. Interestingly, for both country groups, the benefit levels on average decreased before 2000. However, after 2000 and especially after 2005, the benefit levels began to show substantial increases.
As is the case for benefit levels, the replacement rates vary considerably across countries. In 2009, Luxembourg and Italy had the highest replacement rates, while the United States had the lowest replacement rate. In most countries, replacement rates declined during the 1990s. In the EU countries, replacement rates rose in particular after 2005.
For most countries, the real benefit levels and the replacement rates showed parallel develop-ments. However, in Australia, Belgium and the Netherlands, the benefit levels increased but replacement rates declined. In Italy, the benefit level was reduced, but the replacement rate increased between 1990 and 2009. Overall, the correlation between benefit level and replacement rate was 0.7.
10. The coefficient for the long-term effects of the levels (Xi,t-1) are calculated by (Uj/-b).
Lastly, for both indicators, the standard deviation and the coefficient of variation increased both within and outside the EU. The diverging trend of minimum income benefit schemes is remarkable, as convergence has been found for many other welfare state programmes (Caminada et al. 2010).
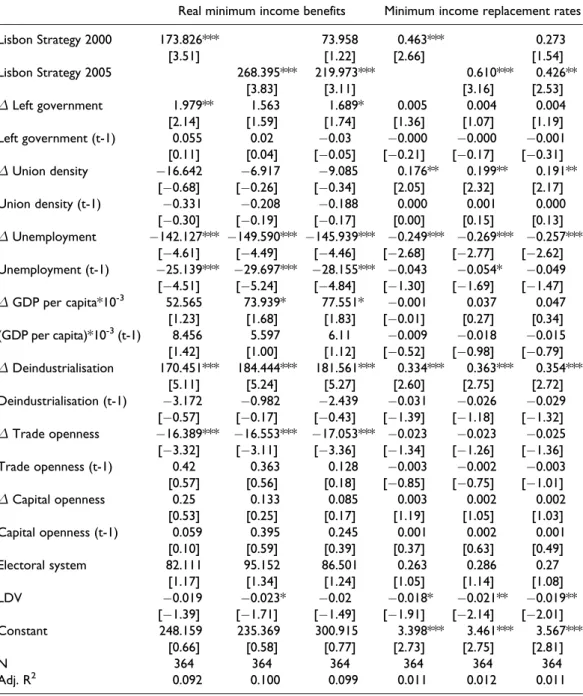
Regression results
The results of the regressions are presented in Table 2. First and foremost, both the Lisbon Strategy 2000 and the revised Lisbon Strategy 2005 are positively and significantly related to real minimum income benefits and minimum income replacement rates. In line with our hypothesis, these results suggest that the Lisbon Strategy 2000 and 2005 contributed to positive developments of minimum income benefits.
Table 1.Real minimum income benefit levels and minimum income replacement rates, 1990-2009
Real minimum income benefit levels Minimum income replacement rates
1990 2000 2005 2009
change
1990-2009 1990 2000 2005 2009
change 1990-2009
Australia 12,231 13,870 16,163 16,874 4,643 47.8 45.7 45.3 40.9 6.9 Austria 10,545 11,311 11,601 12,398 1,853 43.4 43.5 43.7 44.4 1.0 Belgium 12,452 12,811 13,261 14,861 2,408 47.7 47.7 46.3 47.3 0.4 Canada 16,311 13,072 12,851 13,924 2,387 61.0 47.7 41.7 42.7 18.3 Denmark 10,806 16,594 17,955 18,247 7,441 53.2 67.2 64.6 61.7 8.5 Finland 13,158 9,548 10,192 10,263 2,895 58.6 46.0 41.2 39.0 19.6 France 7,195 8,474 8,721 9,090 1,895 40.6 40.6 39.1 38.0 2.5 Germany 9,239 9,640 11,724 11,998 2,760 36.6 33.6 38.3 36.9 0.3 Ireland 11,434 10,680 12,986 17,680 6,246 48.4 39.9 44.4 50.9 2.5 Italy 19,735 13,096 14,882 17,092 2,643 57.7 56.1 62.4 67.1 9.3 Japan 11,174 13,671 16,659 18,643 7,469 54.0 56.4 57.5 59.6 5.6 Luxembourg 13,877 19,422 21,977 27,923 14,047 46.7 56.9 59.7 72.2 25.5 Netherlands 14,723 14,998 14,841 17,179 2,456 59.3 55.3 48.8 51.7 7.6 New Zealand 10,096 9,736 10,854 11,417 1,321 50.8 42.5 43.1 38.0 12.9 Norway 9,250 13,938 13,507 12,819 3,570 39.7 51.7 45.1 41.9 2.1 Portugal . 5,542 6,071 6,787 . . 49.0 49.9 49.7 . Spain 16,153 7,643 7,786 8,134 8,019 50.9 34.0 35.0 34.0 16.9 Sweden 11,081 8,756 9,468 9,775 1,306 60.9 44.4 43.1 38.7 22.2 Switzerland 11,145 12,654 11,497 11,637 492 38.7 41.4 32.9 30.8 8.0 United Kingdom 9,006 10,341 11,413 13,001 3,994 38.0 38.5 37.5 41.8 3.8 United States 9,623 7,956 7,805 7,497 2,126 35.0 26.8 24.6 22.5 12.5
Mean OECD-21 . 11,607 12,486 13,678 . . 45.9 45.0 45.2 . Standard deviation . 3,295 3,769 4,896 . . 9.3 9.8 12.1 . Coefficient of variation . 0.28 0.30 0.36 . . 0.20 0.22 0.27 .
Mean EU-14 . 11,347 12,349 13,888 . . 46.6 46.7 48.1 . Standard deviation . 3,547 3,901 5,171 . . 9.1 9.4 11.8 . Coefficient of variation . 0.31 0.32 0.37 . . 0.20 0.20 0.25 .
Note:Net benefits per year in US dollars, corrected for inflation (2005¼100) and PPP, simple average of minimum income benefits of three household types: single person, lone parents with two children and two parents with two children. Data years are around 1990 (Germany, 1991), and around 1995 (Portugal, 1996).
Table 2.ECM regression results in 21 OECD countries, 1990-2009
Real minimum income benefits Minimum income replacement rates
Lisbon Strategy 2000 173.826*** 73.958 0.463*** 0.273 [3.51] [1.22] [2.66] [1.54] Lisbon Strategy 2005 268.395*** 219.973*** 0.610*** 0.426**
[3.83] [3.11] [3.16] [2.53]
DLeft government 1.979** 1.563 1.689* 0.005 0.004 0.004 [2.14] [1.59] [1.74] [1.36] [1.07] [1.19] Left government (t-1) 0.055 0.02 0.03 0.000 0.000 0.001 [0.11] [0.04] [0.05] [0.21] [0.17] [0.31]
DUnion density 16.642 6.917 9.085 0.176** 0.199** 0.191** [0.68] [0.26] [0.34] [2.05] [2.32] [2.17] Union density (t-1) 0.331 0.208 0.188 0.000 0.001 0.000 [0.30] [0.19] [0.17] [0.00] [0.15] [0.13]
DUnemployment 142.127*** 149.590*** 145.939*** 0.249*** 0.269*** 0.257*** [4.61] [4.49] [4.46] [2.68] [2.77] [2.62] Unemployment (t-1) 25.139*** 29.697*** 28.155*** 0.043 0.054* 0.049 [4.51] [5.24] [4.84] [1.30] [1.69] [1.47]
DGDP per capita*10-3 52.565 73.939* 77.551* 0.001 0.037 0.047 [1.23] [1.68] [1.83] [0.01] [0.27] [0.34] (GDP per capita)*10-3(t-1) 8.456 5.597 6.11 0.009 0.018 0.015 [1.42] [1.00] [1.12] [0.52] [0.98] [0.79]
DDeindustrialisation 170.451*** 184.444*** 181.561*** 0.334*** 0.363*** 0.354*** [5.11] [5.24] [5.27] [2.60] [2.75] [2.72] Deindustrialisation (t-1) 3.172 0.982 2.439 0.031 0.026 0.029 [0.57] [0.17] [0.43] [1.39] [1.18] [1.32]
DTrade openness 16.389*** 16.553*** 17.053*** 0.023 0.023 0.025 [3.32] [3.11] [3.36] [1.34] [1.26] [1.36] Trade openness (t-1) 0.42 0.363 0.128 0.003 0.002 0.003 [0.57] [0.56] [0.18] [0.85] [0.75] [1.01]
DCapital openness 0.25 0.133 0.085 0.003 0.002 0.002 [0.53] [0.25] [0.17] [1.19] [1.05] [1.03] Capital openness (t-1) 0.059 0.395 0.245 0.001 0.002 0.001 [0.10] [0.59] [0.39] [0.37] [0.63] [0.49] Electoral system 82.111 95.152 86.501 0.263 0.286 0.27
[1.17] [1.34] [1.24] [1.05] [1.14] [1.08] LDV 0.019 0.023* 0.02 0.018* 0.021** 0.019**
[1.39] [1.71] [1.49] [1.91] [2.14] [2.01] Constant 248.159 235.369 300.915 3.398*** 3.461*** 3.567***
[0.66] [0.58] [0.77] [2.73] [2.75] [2.81] N 364 364 364 364 364 364 Adj. R2 0.092 0.100 0.099 0.011 0.012 0.011
Regarding domestic politics, the results indicate that left-wing governments are positively and significantly associated with social assistance benefits in the short run. This result seems to suggest that the general hypothesis that left-wing parties have a preference for more generous welfare states also applies to social assistance benefits. However, this should be interpreted with caution, as the coefficients for replacement rates and for the long-run are positive but insignificant. The results for the role of trade unions are comparable in this respect. The positive and significant short-run coefficient for replacement rates suggests that trade unions act as defenders of social assistance, as they do for social insurance programmes. However, the evidence is weak, as the coefficients for the benefit levels and the long-run are insignificant. The results for the electoral system are also insignificant.
Turning to the socioeconomic variables, the effect of unemployment supports our hypothesis that rising unemployment has been followed by retrenchment of social assistance benefits. Inter-estingly, the coefficient for GDP per capita is strongly positive in the regressions for real minimum income benefits, but is insignificant in the estimations of the replacement rate. One possible explanation might be that although governments place more emphasis on social protection as income increases, average wages increase as well, resulting in insignificant effects. Furthermore, the results for deindustrialisation suggest that structural transformation of the labour market is associated with higher social assistance benefits, although significant coefficients can only be found for the short run. Finally, trade openness is negatively and significantly related to social assistance benefits, which provides support for the efficiency hypothesis. The results for capital openness are insignificant.
Sensitivity analyses
To examine the robustness of the results, we performed a number of sensitivity analyses. First of all, the error correction models presented above do not explicitly control for country and year fixed effects. To deal with the heterogeneity of the intercepts, we utilised fixed effect models. The estimated equation is expressed as follows:
Yi;t¼ a þ
X
bjXji;t1þmiþltþei;t ð2Þ
Here, Yi,tis the level of the dependent variable,arefers to the intercept and Xi,t-1denotes the
lagged level of the explanatory variables. We used a country dummym and a year dummyl to control for unobserved country- and year-specific effects. Furthermore, panel-corrected standard errors were applied to correct for panel heteroscedasticity and contemporaneous spatial correlation (Beck and Katz 1995). A Prais-Winsten transformation was applied to correct for autocorrelation. The results of the regressions are presented in Table 3. The coefficients for the Lisbon Strategy 2000 are not significant. The re-launch of the Lisbon Strategy in 2005, on the other hand, showed significantly positive coefficients. Taken together, these results indicate that we do not find robust effects for the Lisbon Strategy 2000, whereas we do find robust results for the Lisbon Strategy 2005.
Finally, a number of other sensitivity analyses, reported in the online appendix, show that the results are robust for the use of different household types, that the results are not driven by policy changes in single countries, or that the results are not affected by enlargement of the EU or the global financial crisis.
Conclusions
The literature on the Europeanisation of social protection has been mainly focused on labour market policies. In contrast, far less research has been devoted to the relationship between the Lisbon Strategy and developments of social assistance benefit schemes. In this study, we examined the determinants of variations in the development of social assistance benefits across 21 OECD countries over the period 1990-2009. The analysis focused, in particular, on the role of the Lisbon Strategy that was adopted by the European Council to combat poverty and social exclusion across Europe. The question is to what extent national policy changes can be ascribed to this strategy or, in other words, whether we can see a Europeanisation of social assistance benefits. To analyse this question, we used pooled time-series-cross-sectional regression analyses to examine the changes of
Table 3.Fixed effects regression results in 21 OECD countries, 1990-2009
Real minimum income benefits Minimum income replacement rates
Lisbon Strategy 2000 185.135 100.039 0.813 0.494 [0.92] [0.62] [0.78] [0.61] Lisbon Strategy 2005 455.827** 436.256** 2.751*** 2.674***
[2.29] [2.13] [3.19] [3.08] Left government (t-1) 3.191*** 3.167*** 3.153*** 0.004 0.004 0.004 [2.75] [2.79] [2.77] [0.92] [0.93] [0.91] Union density (t-1) 112.759*** 112.124*** 112.365*** 0.02 0.003 0.000 [4.17] [4.08] [4.09] [0.24] [0.03] [0.00] Unemployment (t-1) 79.912 76.511 78.632 0.251* 0.222 0.232 [1.60] [1.52] [1.55] [1.90] [1.58] [1.62] (GDP per capita)*10-3(t-1) 85.942* 88.239* 88.768* 0.078 0.057 0.054 [1.72] [1.78] [1.79] [0.44] [0.35] [0.33] Deindustrialisation (t-1) 24.087 23.778 24.417 0.425** 0.395** 0.396**
[0.37] [0.36] [0.37] [2.16] [2.00] [2.01] Trade openness (t-1) 25.388** 27.494** 27.894** 0.064** 0.085*** 0.088***
[2.21] [2.51] [2.50] [2.02] [2.92] [2.98] Capital openness (t-1) 4.196** 4.126** 4.126** 0.011** 0.011** 0.011**
[2.49] [2.45] [2.45] [2.57] [2.43] [2.42] Electoral system 409.547 388.596 378.922 0.639 0.452 0.473 [0.79] [0.69] [0.68] [0.29] [0.19] [0.20] Constant 18073.488*** 18050.980*** 18109.425*** 82.709*** 81.673*** 81.883***
[3.58] [3.54] [3.56] [4.81] [4.75] [4.76] N 369 369 369 369 369 369 Adj. R2 0.823 0.823 0.823 0.862 0.869 0.869
social assistance benefits after the launch of Lisbon Strategy, taking into account a number of political, economic and institutional factors.
For the first years after the adoption of the Lisbon Strategy in 2000, our analysis does not show robust associations between the OMC Social Inclusion and national social assistance policy reforms. This result is in line with existing case-study evidence (e.g. Graziano and Jessoula 2011). Interestingly, for the years after the re-launch of the Lisbon Strategy in 2005, our analysis suggests that the OMC Social Inclusion has been positively associated with the development of social assistance benefits. This finding seems to indicate that the revision of the OMC Social Inclusion has increased its effectiveness, which is in line with the goal of the revision.
Although the results of our study are robust for different model specifications and two different indicators of social assistance benefits, we should note some important limitations of our analysis. First, benefit levels and replacement rates provide an indication of only one dimension of social assistance policies. Other institutional characteristics, such as the coverage rate, eligibility criteria, work requirements and benefit sanctions, are also relevant, but were not taken into account. Future research on welfare state indicators is required to quantify such policy dimensions. Second, an alternative explanation for our result for the re-launch of the Lisbon Strategy in 2005 could be that this effect (partly) reflects the impact of the Lisbon Strategy 2000, which needed a few years to become effective. With our approach, it is not possible to isolate these effects completely. Third, a more general limitation of our approach is that some institutional or socio-economic explanatory factors that could be relevant for understanding developments in social assistance benefits are difficult to capture in quantitative measures. This applies to the factors thatwereincluded in the analysis, but perhaps even more to the factors thatwere notincluded in the analysis, such as trends in social insurance and trends in deservingness or legitimacy regarding welfare state arrangements (Cantillon et al. 2015, 2018). Fourth, for some of our explanatory factors, the results are not similar for both indicators of social assistance benefits. Rather than only a measurement issue, this could also reflect differences in theoretical mechanisms. Analysing these differences was beyond the scope of this paper, but could be an interesting avenue for further research.
Lastly, a remaining question is how the interaction between EU coordination and national social policies will progress given recent European developments. With the adoption of the Europe 2020 Strategy and the European Semester, the coordination of social policies is being further developed (Bekker and Klosse 2013, Zeitlin and Vanhercke 2014). Acknowledging the limitations of this study, the results suggest that EU coordination can actually have an impact on domestic policy-making. This is a relevant insight for the institutional design of future European initiatives on social policy, as these initiatives will, in all likelihood, be based on legally non-binding means of governance. Building on existing work (e.g. Weishaupt 2014b), further research should be devoted to the question under which conditions specific governance instruments are more or less effective.
Declaration of conflicting interests
The author(s) declared no potential conflicts of interest with respect to the research, authorship, and/or publication of this article.
Funding
Supplemental material
Supplemental material for this article is available online.
References
Adema, W. (2006) ‘Social assistance policy development and the provision of a decent level of income in selected OECD countries’. OECD Social, Employment and Migration Working Papers no. 38. Paris: OECD.
Allan, J. P. and Scruggs, L. (2004) ‘Political partisanship and welfare state reform in advanced industrial societies’,American Journal of Political Science, 48(3), 496–512.
Anderson, K.M. (2015)Social policy in the European Union, London: Palgrave.
Ansell, B. and Gingrich, J. (2013) ‘A tale of two trilemmas: Varieties of higher education and the service economy’. In Wren, A. (ed.)The Political Economy of the Service Transition, Oxford: Oxford University Press, 195–224.
Armingeon, K. (2007) ‘Active labour market policy, international organizations and domestic politics’,Journal of European Public Policy, 14(6), 905–932.
Armingeon, K., Weisstanner, D., Engler, S., Potplidis, P. and Gerber, M. (2012) Comparative Political Data Set III, Berne, Switzerland: University of Berne.
Barcevicˇius, E. (2014) ‘Is the Social OMC fit for purpose? Adequacy and institutional design 2006-2010’, in Barcevicˇius, E., Weishaupt, J. T. and Zeitlin, J. (eds.) Assessing the Open Method of Coordination: Institutional Design and National Influence of Social Policy Coordi-nation, Basingstoke: Palgrave Macmillan, 40–86.
Barcevicˇius, E., Weiahaupt, J. and Zeitlin, J. (2014) ‘Tracing the Social OMC from its origins to Europe 2020’, in Barcevicˇius, E., Weishaupt, J. T. and Zeitlin, J. (eds.)Assessing the Open Method of Coordination: Institutional Design and National Influence of Social Policy Coordi-nation, Basingstoke: Palgrave Macmillan, 16–39.
Beck, N. and Katz, J. N. (1995) ‘What to do (and not to do) with time-series cross-section data’. American Political Science Review, 89(03), 634–647.
Beck, T., Clarke, G., Groff, A., Keefer, P. and Walsh, P. (2001) ‘New tools in comparative political economy: The Database of Political Institutions’,The World Bank Economic Review, 15(1), 165–176.
Bekker, S. and Klosse, S. (2013) ‘EU governance of economic and social policies: chances and challenges for Social Europe’,European Journal of Social Law, 2, 103–120.
Borra´s, S. and Radaelli, C. M. (2011) ‘The politics of governance architectures: creation, change and effects of the EU Lisbon Strategy’,Journal of European Public Policy, 18(4), 463–484. Brady, D. and Lee, H. Y. (2014) ‘The rise and fall of government spending in affluent democracies,
1971–2008’,Journal of European Social Policy, 24(1), 56–79.
Busemeyer, M. R. (2009) ‘From myth to reality: globalization and public spending in countries revisited’,European Journal of Political Research, 48, 455–482.
Cantillon, B., Collado, D. and Van Mechelen, N. (2015) ‘The end of decent social protection for the poor? The dynamics of low wages, minimum income packages and median household incomes’, ImPRovE Working Paper No. 15/03.
Cantillon, B., Collado, D. and Van Mechelen, N. (2018) ‘The structural nature of the inadequate social floor for single-parent families’, in: Nieuwenhuis, R. and Maldonado, L.C. (eds.)The triple bind of single-parent families: Resources, employment and policies to improve wellbeing, Bristol: Policy Press, 401–418.
Clegg, D. (2014) ‘Convergence from below? The reform of minimum income protection in France and the UK’,Journal of International and Comparative Social Policy, 30(2), 147–164. Daly, M. (2008) ‘Whither EU social policy? An account and assessment of developments in the
Lisbon social inclusion process’,Journal of Social Policy, 37(1), 1–19.
De Boef, S. and Keele, L. (2008) ‘Taking time seriously’,American Journal of Political Science, 52(1), 184–200.
De la Porte, C. (2014) ‘The Social OMC in Denmark: European ideas meet domestic politics’, in Barcevicˇius, E., Weishaupt, J.T. and Zeitlin, J. (eds.)Assessing the Open Method of Coordina-tion: Institutional Design and National Influence of Social Policy Coordination, Basingstoke: Palgrave Macmillan, 161–180.
De la Porte, C. and Pochet, P. (2002) ‘Supple co-ordination at EU level and the key actors’ involvement’, in De la Porte, C. and Pochet, P. (eds.)Building Social Europe through the Open Method of Co-ordination, Brussels: PIE-Peter Lang, 27–68.
European Commission. (2005) ‘Working together, working better: A new framework for the open coordination of social protection and inclusion policies in the European Union’.Communication from the Commission to the Council, the European Parliament, the European Economic and Social Committee and the Committee of the Regions, COM(2005) 706 final 22 December, Brussels. European Commission. (2010) ‘Lisbon Strategy evaluation document’.Commission Staff Working
Document, SEC (2010) 114 final 2 February, Brussels. European Commission (2014)Exchange Rate Database, Brussels.
European Council. (1992) Council recommendation on common criteria concerning sufficient resources and social assistance in social protection systems(92/441/CEE), 246–248.
European Council. (2000a) ‘Fight against poverty and social exclusion – Definition of appropriate objectives’.Document Submitted to the European Council in Nice by the Employment and Social Affairs Council, Document No. 14110/00, 30 November.
European Council. (2000b)Presidency conclusions. Lisbon European Council of 23 and 24 March. European Council. (2005) Working together for growth and jobs. A new start for the Lisbon
Strategy. Communication to the Spring European Council of 2 February.
Ferrera, M., Matsaganis, M. and Sacchi, S. (2002) ‘Open coordination against poverty: the new EU ‘social inclusion process’’.Journal of European Social Policy, 12(3), 227–240.
Figari, F., Matsaganis, M. and Sutherland, H. (2013) ‘Are European social safety nets tight enough? Coverage and adequacy of Minimum Income schemes in 14 EU countries’, Interna-tional Journal of Social Welfare22(1), 3–14.
Graziano, P. R. and Jessoula, M. (2011) ‘The Italian trajectory of recent welfare reforms: From ‘rescued by Europe’ to Euro-scepticism’, in Graziano, P. R., Jacquot, S. and Palier, B. (eds.)The EU and the Domestic Politics of Welfare State Reforms, Basingstoke: Palgrave Macmillan, 148–174.
Haverland, M. (2007) ‘Methodology’, in Graziano, P. and Vink, M. (eds)Europeanization: New Research Agendas, New York: Palgrave MacMillan, 59–70.
Hamel, M-P. and Vanhercke, B. (2009) ‘The Open Method of Coordination and domestic social policy making in Belgium and France’, in Heidenreich, M. and Zeitlin, J. (eds.) Changing European Employment and Welfare Regimes: The Influence of the Open Method of Coordina-tion on NaCoordina-tional Reforms, London: Routledge, 84–111.
Heston, A., Summers, R. and Aten, B. (2012)Penn World Table Version 7.1, Philadelphia, PA: University of Pennsylvania.
Ho¨lsch, K. and Kraus, M. (2006) ‘European schemes of social assistance: an empirical analysis of set-ups and distributive impacts’,International Journal of Social Welfare, 15(1), 50–62. Immervoll, H., Jenkins, S. P. and Ko¨nigs, S. (2015) ‘Are recipients of social assistance ‘benefit
dependent’? Concepts, measurement and results for selected countries’,OECD Social, Employ-ment and Migration Working Papers no. 162, Paris: OECD.
Iversen, T. and Cusack, T. R. (2000) ‘The causes of welfare state expansion: deindustrialization or globalization?’.World Politics, 52(03), 313–349.
Jacobsson, K. and Johansson, H. (2009) ‘The micro-politics of the Open Method of Coordination’, in Heidenreich, M. and Zeitlin, J. (Eds.) Changing European Employment and Welfare Regimes: The Influence of the Open Method of Coordination on National Reforms, London: Routledge, 173–191.
Jessoula, M., Kubisa, J., Madama, I. and Zielenska, M. (2014) ‘Understanding convergence and divergence: Old and new cleavages in the politics of minimum income schemes in Italy and Poland’,Journal of International and Comparative Social Policy, 30(2), 128–146.
Kittel, B. and Winner, H., (2005) ‘How reliable is pooled analysis in political economy? The globalization–welfare state nexus revisited’, European Journal of Political Research, 44, 269–293.
Korpi, W. and Palme, J. (2003) ‘New politics and class politics in the context of austerity and globalization: Welfare state regress in 18 countries, 1975–95’, American Political Science Review, 97(03), 425–446.
Marchal, S., Marx, I. and Van Mechelen, N. (2014) ‘The Great Wake-Up Call? Social citizenship and minimum income provisions in Europe in times of crisis’.Journal of Social Policy, 43(02), 247–267.
Meltzer, A. H. and Richard, S.F. (1983) ‘Tests of a rational theory of the size of government’. Public Choice, 41(3), 403–418.
Nelson, K. (2010) ‘Social assistance and minimum income benefits in old and new EU democ-racies’,International Journal of Social Welfare, 19(4), 367–378.
Nelson, K. (2013b) The Social Assistance and Minimum Income Protection Interim Data-Set. Stockholm: Swedish Institute for Social Research.
Nickell, S. (1981) ‘Biases in dynamic models with fixed effects’, Journal of the Econometric Society, 49, 1417–1426.
OECD. (2015)Labour Statistics. Paris: OECD.
OECD. (2016)Social Benefit Recipients Database. Paris: OECD.
Olaskoaga, J., Alaez-Aller, R. and Diaz-De-Basurto-Uraga, P. (2013) ‘Beyond welfare effort in the measuring of welfare states’,Journal of Comparative Policy Analysis: Research and Practice, 15(3), 274–287.
Paetzold, J. and Van Vliet, O. (2014) ‘EU Co-Ordination and the convergence of domestic unem-ployment protection schemes’.Journal of Common Market Studies, 52(5), 1070–1089. Podesa`, F. (2006) ‘Comparing time series cross-section model specifications: the case of welfare
state development’,Quality and Quantity40, 539–559.
Potrafke, N. (2016) ‘Partisan Politics: The Empirical Evidence from OECD Panel Studies’,CESifo Working Paperno. 6024.
PPMI. (2011) ‘Assessing the effectiveness and impact of the Social OMC in Preparation of the New Cycle’.Service Order No. VC/2009/0880, Commissioned by DG Employment, Social Affairs and Inclusion.
Radaelli, C. M. (2002) ‘The domestic impact of European Union public policy: Notes on concepts, methods, and the challenge of empirical research’,Political Europ ´eenne, 1(5), 105–136. Rodrik, D. (1998) ‘Why do more open economies have bigger governments?’,Journal of Political
Economy, 106(5), 997–1002.
Rueda, D. (2007)Social Democracy Inside Out: Partisanship and Labor Market Policy in Indus-trialized Democracies, Oxford: Oxford University Press.
Smeeding, T. (2006) ‘Poor people in rich nations: The United States in comparative perspective’, The Journal of Economic Perspectives20(1), 69–90.
Starke, P. (2006) ‘The politics of welfare state retrenchment: A literature review’,Social Policy and Administration, 40(1), 104–120.
Swank, D. (2002)Global capital, political institutions, and policy change in developed welfare states, Cambridge: Cambridge University Press.
Swank, D. (2011) ‘Activating Workers? The Political Economy of Active Social Policy in Post-industrial Democracies’, in Brady, D. (ed.)Comparing European Workers Part B: Policies and Institutions (Research in the Sociology of Work, Vol. 22), Bingley: Emerald Group Publish-ing Limited, 9–51.
Swank, D. (2013) ‘Party government, institutions, and social protection in the age of austerity’, in: Armingeon, K. (ed.)Staatsta¨tigkeiten, Parteien und Demokratie, Wiesbaden: Springer Verlag, 307–330.
Van Mechelen, N. and Marchal, S. (2013) ‘Struggle for life: Social assistance benefits, 1992-2009’, in Marx, I. and Nelson, K. (eds.)Minimum Income Protection in Flux, Basing-stoke: Palgrave Macmillan, 28–53.
Van Vliet, O. and Caminada, K. (2012) ‘Unemployment Replacement Rates Dataset among 34 Welfare States 1971-2009: An Update, Extension and Modification of Scruggs’Welfare State Entitlements Data Set’. NEUJOBS Special Reportno. 2. Leiden: Leiden University.
Van Vliet, O. and Koster, F. (2011), ‘Europeanization and the political economy of active labour market policies’,European Union Politics,12(2), 217–239.
Van Vliet, O. and Wang, J. (2017), ‘The political economy of social assistance and minimum income benefits: a comparative analysis across 26 OECD countries’,Comparative European Politics, https://doi.org/10.1057/s41295-017-0109-7
Vandenbroucke, F., Cantillon, B., Van Mechelen, N., Goedem´e, T. and Van Lancker, A. (2013) ‘The EU and minimum income protection: Clarifying the policy conundrum’, in Marx, I. and Nelson, K. (eds.)Minimum Income Protection in Flux, Basingstoke: Palgrave Macmillan, 271–317. Vanhercke, B. (2014) ‘Is Belgium (still) the best pupil in the class?’, in Barcevicˇius, E., Weishaupt,
J. T. and Zeitlin, J. (eds.)Assessing the Open Method of Coordination: Institutional Design and National Influence of Social Policy Coordination, Basingstoke: Palgrave Macmillan, 40–86. Wang, J. and Van Vliet, O. (2016a) ‘Social assistance and minimum income benefits: Benefit
levels, replacement rates and policies across 26 OECD countries, 1990-2009’,European Jour-nal of Social Security, 18(4), 333–355.
Wang, J. and Van Vliet, O. (2016b).Social Assistance and Minimum Income Levels and Replace-ment Rates Dataset. Leiden University.
Weishaupt, J. T. (2014a) ‘The Social OMC in Germany: Slow but Steady?’, in Barcevicˇius, E., Weishaupt, J. T. and Zeitlin, J. (eds.)Assessing the Open Method of Coordination: Institutional Design and National Influence of Social Policy Coordination, Basingstoke: Palgrave Macmil-lan, 138–160.
Weishaupt, J. T. (2014b) ‘The Social OMCs at work: Identifying and explaining variations in national use and influence’, in Barcevicˇius, E., Weishaupt, J. T. and Zeitlin, J. (eds.)Assessing the Open Method of Coordination: Institutional Design and National Influence of Social Policy Coordination, Basingstoke: Palgrave Macmillan, 203–233.
World Bank. (2012)World Development Indicators, Washington, DC.
Zeitlin, J. (2009) ‘The Open Method of Coordination and reform of national social and employ-ment policies’, in Heidenreich, M. and Zeitlin, J. (eds.)Changing European Employment and Welfare Regimes: The Influence of the Open Method of Coordination on National Reforms, London: Routledge, 214–245.
Zeitlin, J., Pochet, P. and Magnusson, L. (2005)The open method of co-ordination in action: the European employment and social inclusion strategies (Vol. 49), Brussels: Peter Lang. Zeitlin, J. and Vanhercke, B. (2014) ‘Socializing the European Semester? Economic governance