THE ALLOCATION OF SUPREME COURT AGENDA ATTENTION: INSTITUTIONAL ISSUE DYNAMICS
Ryan J. Williams
A thesis submitted to the faculty of the University of North Carolina at Chapel Hill in partial fulfillment of the requirements for the degree of Master of Arts in the Department of Political Science, Concentration American Politics.
Chapel Hill 2015
ABSTRACT
RYAN J. WILLIAMS: The Allocation of Supreme Court Agenda Attention: Institutional Issue Dynamics
(Under the direction of Kevin T. McGuire.)
TABLE OF CONTENTS
LIST OF TABLES . . . v
LIST OF FIGURES . . . vi
Introduction . . . 1
The Macrodynamics of the Court’s Agenda . . . 3
Separation of Powers and Inter-Branch Responsiveness . . . 4
Societal Pressures . . . 12
Data . . . 14
Vector Autoregression and Agenda Dynamics . . . 22
Issue Area Results . . . 26
Modeling the Exogenous Pressures . . . 34
Conclusion . . . 36
APPENDIX . . . 39
LIST OF TABLES
Table
1 Summary Statistics: Post-War Court Cases by Major Topic Area . . . 16
2 Major Topic Areas Regressed on Year . . . 18
3 Correlations between Cases and Hearings and State of the Union . . . 22
4 Crime Granger Causality Tests . . . 27
5 Forecast Error Variance Decomposition: Crime . . . 28
6 Labor Granger Causality Tests . . . 29
7 Forecast Error Variance Decomposition: Labor . . . 30
8 Transportation Granger Causality Tests . . . 31
9 Forecast Error Variance Decomposition: Transportation . . . 32
10 Civil Rights and Liberties Granger Causality Tests . . . 33
11 Forecast Error Variance Decomposition: Civil Rights and Liberties . . . . 34
12 Effects of Exogenous and Inter-Branch Pressures . . . 36
13 Summary Statistics for Crime . . . 40
14 Summary Statistics for Labor . . . 41
15 Summary Statistics for Transportation . . . 41
16 Summary Statistics for Civil Rights and Liberties . . . 41
17 Correlations between Hearings and State of the Union Mentions . . . 41
18 Vector Autoregression Results for Crime . . . 42
19 Vector Autoregression Results for Labor . . . 43
20 Vector Autoregression Results for Transportation . . . 43
21 Vector Autoregression Results for Civil Rights and Liberties . . . 44
LIST OF FIGURES
Figure
1 Patterns of Institutional Agenda Attention . . . 4
2 Percentage of Supreme Court Cases by Major Topic Area: 1946-2009 . . . 15
3 Percentage of Supreme Court Cases: 1946-2009 . . . 17
4 Percentage of Governmental Agendas: Crime . . . 20
5 Percentage of Governmental Agendas: Labor . . . 20
6 Percentage of Governmental Agendas: Transportation . . . 21
7 Percentage of Governmental Agendas: Civil Rights and Liberties . . . 21
8 Number of New Case Filings . . . 39
Introduction
In 1988, Congress granted the Supreme Court nearly total control over its agenda by eliminating mandatory Court review of certain writs of appeal. The 1988 act was the cul-mination of a half-century long trend toward Court discretionary docket control,1 leaving the Court as master of its own agenda. Given the lifting of these impediments to full Court agenda control, identifying the factors underlying the Court’s agenda attention becomes increasingly more important to understanding the institution. Thus, in this paper, I ask whether this discretionary docket control insulates the Court from extra-judicial forces in allocating its agenda attention. Much has been written on the Court’s certiorari process and criteria for selecting cases.2 However, unlike the traditional analysis of the individual case-level cues that lead justices to accept cases, I examine the determinants of the Court’s agenda allocation from a broader, inter- and extra-institutional perspective.
This paper is concerned with the macro-dynamics of issue attention in the Supreme Court, one third of the institutional agendas of the three American political branches (Cobb and Elder 1972). Attention is a prerequisite for policymaking, and in the U.S. Supreme Court, attention is manifested in the issues it decides to hear via case selection. Moreover, compared to its brethren branches, the Supreme Court’s breadth of attention is more lim-ited. While presidential dominance of the news cycle allows presidents to pick and choose
1In 1925, Congress passed the Judges’ Bill, which granted the Court the ability to accept the majority of appeals by the writ of certiorari. The Supreme Court’s mandatory appellate jurisdiction was then limited to appeals of federal circuit decisions declaring state statutes unconstitutional. In the years between 1925 and 1988, Congress chipped away further at Court agenda requirements and, in 1988, converted all remaining appeals from lower courts to writs of certiorari.
issues to address or respond to in press conferences and televised addresses to the nation, and while congressional committees have the power to initiate and conduct hearings on any issue within their jurisdiction, the Court can neither initiate litigation nor simply choose to decide a case on any given issue. Instead, the Court must choose from among the petitions for adjudication it receives from litigants appealing lower court rulings. The Court certainly does not lack for options from which to choose, as the Court is faced with potential cases in almost any issue given the influx of thousands of new cert petitions each term.3 How-ever, while Congress holds thousands of hearings each year, the Court, especially in recent years, has limited the number of cases it accepts per year to approximately eighty.4 Thus, understanding the determinants of this limited attention to certain issue areas, as well as dis-covering the direction of attention flow, provide insight into the Court’s agenda composition and the linkages between institutional agendas. This paper proceeds by first theoretically motivating a set of partially competing and partially complementary hypotheses of Court agenda attention. Specifically, I seek to test the extent to which the Court’s issue agenda attention is a reflection of 1) the attention devoted by the president and Congress to similar issues, 2) societal pressures, or 3) a combination of both. I then draw on the Policy Agendas Project’s5 more than sixty years of data on post-war Supreme Court cases, and I describe the broad trends characterizing the Court’s issue agenda over this time and develop a more depth look at a smaller subsection of the Court’s agenda. In particular, I consider the in-triguing trends observed for civil rights and liberties, labor and employment, transportation, and law, crime, and family issues cases. I utilize a Vector autoregression model to evaluate the competing hypotheses for these four issue areas, and I then conclude with implications for future work on Court agenda setting.
3See Figure 8 in the appendix for a graph of the trend of new case filings from 1941-2009.
4See Figure 9 in the appendix for a graph of the trend of cases disposed by full opinion in the post-war era.
The Macrodynamics of the Court’s Agenda
Research on agenda setting within the American political context details a variety of macrodynamic issue attention patterns. Institutional agenda attention (attention by Congress, the Court, and the president) may be characterized by organized anarchy (Co-hen, March and Olsen 1972) or by a more systematic horizontal pattern of issue attention. Under a system of organized anarchy, issue attention is stochastic and unstructured. Policy-making under such a system becomes akin to a “garbage can” (Kingdon and Thurber 1984), where problems, solutions, and politics move randomly and are joined together as a matter of circumstantial happenstance. The participation of actors in such a system is fluid, as these participants move in and out of the system due to political appointments, elections, or their own preferences.
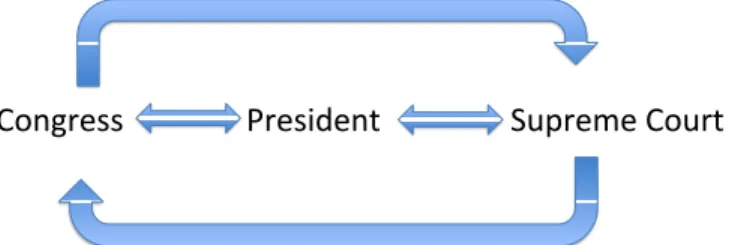
Conversely, institutional attention may be more sequential and systematic. Constitu-tional design and instituConstitu-tional adaptations link attention among the branches. The leg-islative process and electoral considerations join presidential and congressional attention. Presidents enter office with campaign promises and initiatives that define their issue agen-das. These priorities make their way to the legislative agenda. The legislative agenda also influences the president’s agenda, as presidents often co-opt congressional issues to form their legislative packages (Light 1991a). The Court’s agenda is linked to the president’s agenda primarily through the influence of the solicitor general (Segal 1988, 1990; Salokar 1994; Bailey, Kamoie and Maltzman 2005), and, with respect to Congress, it is the passage of congressional legislation that provides an influx of cases to the federal court system.6 Moreover, the president and the Senate determine the composition of the Court through the nomination and confirmation process. The dynamics of how the Court influences the other branches is less well understood. Certainly, when the Court strikes down congressional legislation, attempts to override these decisions necessitate legislative attention and pres-idential involvement (Eskridge Jr 1991; Eskridge 1991). Moreover, as Flemming, Wood
and Bohte (1999) note, landmark Court opinions often find their way into the public con-sciousness and incite political debate and action (e.g.Roe v. Wade). Thus, under systematic institutional agenda attention, the patterns of attention flow across branches would resemble something akin to the reciprocal relationships depicted in Figure 1.
Scholarly investigation into these broad agenda patterns, however, has been limited, es-pecially work that has focused on the Supreme Court’s agenda (an exception being Yates, Whitford and Gillespie (2005)). Another notable exception, Flemming, Wood and Bo-hte (1999), demonstrates these hypothesized inter-branch linkages in certain issue areas, although the authors are concerned less with one specific institution than in how those institutions’ agenda attentions interact and link. Thus, untangling these patterns of issue at-tention across institutions, whether stochastic or systematic and sequential, requires going further than the initial foray of Flemming, Wood and Bohte (1999) and requires developing a more theoretically driven explanation for these patterns. Having posited these institutional dynamics, I now motivate a set of competing hypotheses of the determinants of the Court’s agenda, focusing on inter-institutional dynamics and societal pressures and delineating the expectations one should expect to observe from each.
Congress( President( Supreme(Court(
Fig. 1: Patterns of Institutional Agenda Attention
Separation of Powers and Inter-Branch Responsiveness
of the other institutions and as an input in the attention calculus of the elected branches. Applying the New Institutionalist and strategic interaction judicial literature7on separation of powers to a theory of institutional agenda attention, I posit that the systemic, institutional relationship depicted in Figure 1 is driven by the interaction between strategic elite and non-elite actors in the policy process in such a manner as to create an inherently endogenous feedback loop.
Court Attention as Political System Output
Strategic interaction models posit justices as strategic actors who attempt to transform their policy preferences into law while operating within a system of constraints, both en-dogenous and exogenous. Judicial scholars have utilized this strategic approach to examine internal constraints, such as the certiorari process (Caldeira, Wright and Zorn 1999), the politics of opinion assignment (Epstein and Knight 1997), and the dynamics of opinion coalition formation (Maltzman, Spriggs and Wahlbeck 2000). Especially pertinent for this paper are the exogenous constraints influencing the Court’s agenda-setting behavior. As Justice Felix Frankfurter noted in his dissent in Baker v. Carr,8 “the Court’s authority-possessed of neither purse nor sword- ultimately rests on sustained public confidence in its moral sanction.” The Court’s inability to force compliance with its decisions forces reliance on the popularly elected executive to implement its decisions. In addition, Congress con-trols the Court’s budget and its jurisdictional purviews. Thus, concern for the efficacy of its rulings and, therefore, its institutional legitimacy should create incentives for the Court to engage in strategic action vis-a-vis Congress and the executive. Such propositions form the crux of separation of powers models, which explain Court decision-making in terms of this anticipation and reaction to the actions of the other political branches (Marks 2012; Baum 2009; Gely and Spiller 1990; Vanberg 2001; Helmke 2002). Derived formally, when the Court’s preference is located within the pareto set (i.e., within the range of alternatives
7This literature has its foundation in Walter Murphy’sElements of Judicial Strategy(1964).
where adverse congressional and presidential reaction are unlikely), the Court is free to act upon its preference. When the Court is situated outside this set, concern for institutional legitimacy, according to separation of powers models, limits the range of actions the Court can consider.
The logic behind separation of powers models translates well to understanding the flow of agenda attention from the elected branches to the Court, as concerns for its institutional legitimacy should drive the rational expectations of the forward-looking Court. For exam-ple, in reaching a decision or choosing which cases to place on its docket, the Court may anticipate possible adversarial congressional reaction, such as attempts to overturn deci-sions, limit jurisdiction, or alter the Court’s composition. In particular, Clark (2010) argues that congressional bills attempting to curb the power of the Court or alter its appellate ju-risdiction serve as signals to the Court of the prevailing winds of public opinion. Here, the Court utilizes congressional Court-curbing legislation as information on the state of public opinion and alters the behavior it perceives as out of line with public sentiment.
This inter-branch dynamic also applies to the interaction between the president and the Court (Helmke 2002; Yates, Whitford and Gillespie 2005). The prerogative of the execu-tive branch to enforce Court decisions necessitates Court anticipation of execuexecu-tive prefer-ence when reaching decisions. Empirical evidprefer-ence of Court responsiveness to presidential agenda attention is provided by Yates, Whitford and Gillespie (2005), who examine Court allocation of agenda space as a function of external political signals and find support that the Court responds to the presidential agenda.9 Moreover, presidential attention is filtered through the Office of the Solicitor General, which determines which cases the federal gov-ernment lost at the lower court level to appeal to the Court, as well as when to file an amicus brief supporting a litigant’s position. The importance of the solicitor general as an informa-tional cue at the certiorari level is widely supported (Caldeira and Wright 1988; Black and
Owens 2012), with some scholars noting that the solicitor general functions as “the tenth justice” (Caplan 1987). The Court’s agenda then is reflective of the influence of the pres-ident via the solicitor general’s involvement at the certiorari stage. Thus, the constrained nature of the Court requires anticipation and reaction to the attention of the other branches. I now turn to laying out a causal story linking institutional attention to issue area, focusing on the role of legislative activity in creating opportunities for litigation and the importance of salience in structuring Court certiorari decisions.
Central to the causal argument advanced in this work is the role of legislative action in creating litigation to be resolved by the courts.10 The causal story begins with initial legislative activity in an issue area.11 Congress introduces legislation in a given area, holds hearings, marks up the bill in committee sessions, and passes the legislation, which be-comes public law upon the addition of the president’s signature. Such legislative activity, however, creates policy winners and losers, both of whom organize to lobby for its preser-vation or repeal (Olsen 1965). In particular, policy losers, unsuccessful in the legislative sphere, expand the scope of conflict (Schattschneider 1975) and seek success in a different venue by sponsoring litigation in the judicial system. Such litigation then proceeds through the federal court system. Thus, increased activity in the legislative sphere creates the oppor-tunity for greater litigant appeals for redress in the Courts.12 The causal story need not rely
10Others argue that issues reach the Court’s agenda due to legislative inaction. Legislative abdication of its policymaking role in complex issues (Lowi 1979; Tate and Vallinder 1997) leads courts to then take up these issues. This judicialization of policymaking, the increased resolution of political questions by the judiciary previously handled by legislatures (Tate and Vallinder 1997), results from a legislature either lacking requisite resources or perhaps even dodging salient political questions. The initial push by the NAACP in the courts for greater civil rights for African-Americans (i.e.,Brown v. Board of Education) was partially a result of legislative inaction.
11Initial legislative activity at the state level can also be incorporated into the causal story presented in this section. The Court often hears constitutional challenges to state statutes, and court invalidations of state laws can prompt congressional response, as I illustrate below withTexas v. Johnson. Thus, Congress as an initiator of the process is not necessarily the key component of the story but rather the branch’s anticipation and reaction to the Court that is instrumental for the dynamics in Figure 1 to be operational. Moreover, as discussed below with regard to the saga of the Communications Decency Act of 1996, Court decisions, even constitutional ones, can spark legislative reaction.
on legislative activity. The actions of the president can set events in motion that create the necessity of Court adjudication. Unilateral presidential directives such as executive orders can create attempts by Congress to rein in the executive (e.g., War Powers Resolution of 1973) and/or opportunities for litigation. The Court notably overturned President Truman’s steel mill seizure in Youngstown Sheet & Tube Co. v. Sawyer(1952).13 Moreover, Pres-ident Reagan’s controversial use of the “pocket veto” led to a Court decision in Burke v. Barnes(1987),14and the Court turned its attention to the president’s use of executive orders to freeze Iranian assets in the United States in the wake of the Iran Hostage Crisis inDames & Moore v. Regan(1981).15 Clearly, institutional agenda interaction is a central component of the separation of powers system.
Yet the opportunity for adjudication is only part of the story, as four justices must still find a petition sufficiently worthy of adjudication to place the issue on the Court’s docket. Given the limited agenda space available on that docket, justices voting to grant cert require signals of the appropriate adjudicability of the issue. Individual case-level cues such as the presence of lower court conflict and the direction of the lower court ruling are certainly important, although I expect that the impact of a case’s salience on the likelihood of that case being granted cert becomes even more important with an increase in the number of opportunities for hearing cases within an issue area. Salience then should moderate the degree to which congressional attention should influence Court attention to certain issue areas. Non-salient issue areas such as labor and transportation do not tap into pre-existing attitudinal preferences like cases concerning civil rights and liberties and the rights of crim-inal defendants, where justices’ personal, ideological attitudes are more easily tapped and
as unconstitutional inWabash, St. Louis & Pacific Railway Company v. Illinois(118 U.S. 557) in 1886, which paved the way for the passage of the Interstate Commerce Act in 1887. Thus, as will be stressed below, the Court is an important input in creating agenda attention and policy activity. Moreover, during the late nineteenth century, the House of Representatives saw a vast increase in its workload, as the number of bills introduced doubled from around 4,000 in the 42nd Congress (1871-1873) to over 8,000 in the 48th (1883-1885) (Hinds 1907).
13343 U.S. 579
14479 U.S. 361
prevalent (Unah and Hancock 2006). Determining how the justices determine salience is beyond the scope of this work, although one factor is key at this juncture: the presence of the solicitor general. Through the solicitor general, the president’s preferences are translated to the Court, as solicitor recommendations and involvement in a case provide an important signal to the justices that the case is salient. Thus, I expect particularly salient issue areas with wide public interest or concern to fit best with this causal story; crime is a particularly attractive candidate for this argument. This leads to my first set of hypotheses.
• Hypothesis 1A: Increased attention by Congress to a salient issue area should lead to
increased attention by the Court to that same issue area.
• Hypothesis 1B: Increased attention by the president to a salient issue area should lead to increased attention by the Court to that same issue area.
The preceding discussion establishes the institutional dynamics of the Court’s agenda as an output of political system activity. I continue the causal story by examining Court attention as a driver of agenda attention, completing the feedback loop introduced in Figure 1.
Court Attention as Political System Input
In this section, I focus on the role of the Court in creating attention to issues in the political system. A Court decision does not end the policy process, as an adverse Court decision may spur Congress to respond with corrective legislation.16 Moreover, Congress may respond whether or not it was the original source of the struck law. Two examples illustrate this point well. The first concerns the long history of the congressionally enacted Communications Decency Act of 1996 (CDA) and its progeny. The second demonstrates congressional response to an invalidated state statute. The CDA was the first serious attempt by Congress to regulate pornography on the Internet and to protect children from indecent
content on the Internet. The American Civil Liberties Union (ACLU) challenged the statute on First Amendment grounds, and the Court struck down the CDA’s anti-indecency provi-sions inReno v. American Civil Liberties Union(1997)17as an unconstitutional violation of free speech guarantees. Congress responded in 1998 by passing the Child Online Protection Act (COPA), a more narrowly tailored law aimed at requiring commercial distributors to re-strict minors from accessing their sites if they contained material deemed harmful. Again, the law was challenged by the ACLU, and, after a court ordered injunction and several Third Circuit rulings against the law, the Supreme Court upheld the lower court’s deci-sion inAshcroft v. American Civil Liberties Union(2004).18 The initial injunction against COPA, however, led to the Children’s Internet Protection Act (CIPA), which employed In-ternet filters to protect children from harmful online content. The Court upheld the law in United States v. American Library Association(2003).19 Additionally, Congress may respond to Court rulings regarding state statutes. Such a scenario occurred following the Court’s decision inTexas v. Johnson (1989)20 that invalidated a Texas statute prohibiting flag-burning. Following the decision, Congress responded by passing the Flag Protection Act of 1989, which was itself then struck down by the Court inU.S. v. Eichman.21 As these examples demonstrate, congressional attempts to remedy legislation open new avenues for litigants to seek access to the federal courts. Legislative activity begets litigation; litigation creates opportunity for judicial adjudication.22 Court decisions then create the possibility of
17521 U.S. 844
18542 U.S. 656. Following theAshcroftdecision, the case was referred back to the federal district court and faced several more iterations of lower court rulings before the Supreme Court finally declined to review the law in 2009.
19539 U.S. 194
20491 U.S. 397. See also the history of the Religious Freedom Restoration Act, a congressional response to the Court’s decision inEmployment Division v. Smith, 492 U.S. 872, which upheld an Oregon law criminal-izing Peyote use. The RFRA resulted from pressure from religious groups concerned with the possibility that the Court’s precedent could be used to regulate common religious practices. The Court invalidated the RFRA inCity of Boernes v. Floresas an unconstitutional exercise of Congress’ enforcement power.
21496 U.S. 310
congressional response. These examples provide evidence of the cyclical attention patterns among governmental institutions posited thus far.
In addition to prompting a congressional response, Court attention and decisions may also provide important signals to future litigants. This piece of the causal story relies on the interaction between the Court and strategic litigants and the ability of the Court to affect its own agenda. As Baird (2007) argues, justices use politically salient decisions to signal to future litigants that they desire to hear more cases in a similar policy area. The Court then relies on strategic litigants to bring more well-framed cases for adjudication.
• Hypothesis 2A: Increased attention by the Court to a given salient issue area should
lead to increased attention by Congress to that same issue area.
• Hypothesis 2B: Increased attention by the Court to a given salient issue area should
lead to increased attention by the president to that same issue area.
Finally, implicit within such a causal story, however, is a significant time element. It takes time for a case to make its way through the court system, to be placed on the Supreme Court’s docket, to be scheduled for oral argument, and, finally, to be decided. Such a pro-cess can take years for a single case to be appealed through the federal court hierarchy. The odyssey of the CDA and its progeny, COPA and CIPA, illustrate this well, as it took nearly a decade for constitutional challenges to this set of cases to be resolved by the courts. Therefore, I would expect a lagged effect between governmental attention to an issue and Court attention due to the duration of the federal litigation process and the time necessary for congressional/executive response. In sum, the causal arrow should flow from congres-sional attention to an issue area, via hearings or enacted bills, to legislative process losers shifting their attention to the courts, and, then, to the Court accepting more cases in those areas it recognizes as particularly salient. Court decisions will then create opportunities for congressional and presidential reactions and will present signals to future litigants to direct more cases through the federal court system. This dynamic inter-relationship among
the three branches results in the aforementioned feedback loop of anticipation and reaction, indicating an inherently endogenous relationship between the branches. The wheel in the institutional sky thus keeps on turning.
Societal Pressures
Alternatively, the Court’s agenda may be less a reaction to the attention of the other branches than a response to prevailing technological and societal changes. I do not mean to imply that these two perspectives of Court agenda attention are mutually exclusive. In fact, I expect that these perspectives will complement one another or prove operative in differing issue areas. While making different predictions regarding the source of the Court’s agenda, both explanations rely on the Court’s concern for its institutional legitimacy, which is at odds with the dominant model of judicial decision-making in political science: the attitu-dinal model. Attituattitu-dinal explanations of Court decision-making argue that the institutional structure of the American political system affords the Court sufficient insulation from the constraining influences of Congress and the president (Rohde and Spaeth 1976; Segal and Spaeth 2002). Discretionary docket control provides great latitude for the Court in decid-ing which issues it will and will not hear, and the presence of multiple veto points in the legislative process means that congressional attempts to overturn Supreme Court statutory rulings is difficult. This implies that the Supreme Court enjoys a certain degree of protec-tion from congressional oversight.23 With lifetime tenure, no electoral connection, and no progressive ambition, attitudinalists argue justices are free to vote in accordance with their personal policy preferences and, with regard to the agenda stage, free to focus on the issues they find of greatest concern.
The attitudinal perspective outlined above is well-traversed in the Court literature. Less articulated, however, is an extra-governmental explanation of Court issue attention in terms of prevailing societal change. The Court may be hearing more of a certain type of issue because technological or societal changes require that this issue be adjudicated. Caldeira
(1981) was among the first to posit the Court’s agenda as a function of societal factors. Theorizing that the Court’s attention to criminal issues is a function of the rate or level of crime, the change in the crime rate, and media coverage, among other factors, the author found no support for these societal variables. However, Caldeira’s work, while foundational as an initial foray into the question of Court agenda building, relies only upon simple bi-variate analysis. Work on the Court and public opinion also theorizes that Court decisions on the merits is partly a reflection of social forces (Casillas, Enns and Wohlfarth 2011). The Court’s place in the separation of powers system provides good reason to expect the Court to respond to these societal pressures. Returning to the Felix Frankfurter quotation, the Court’s authority rests on the perceived legitimacy of its decisions, including the selec-tion and resoluselec-tion of important constituselec-tional quesselec-tions. Failure to attend to the important legal questions of the day may decrease the diffuse support enjoyed by the Court and may threaten its legitimacy and relationship with the other branches and their incentives to com-ply with Court decisions. Such perceived abdication of its constitutional role could be detri-mental to the Court (Clark 2010; Mondak 1992, 1994). Thus, we may need to look outside the sphere of governmental attention to understand the Court’s agenda attention. I theorize above that the Court’s issue attention may reflect prevailing changes in the societal climate or the forward march of technological progress that creates new issues necessitating adju-dication by the nation’s highest court. I operationalize attention to societal change by using media coverage of a given issue area. If major news outlets such as theNew York Timesare attending to an issue, such attention may signal to the Court an issue area’s adjudicability. This leads to the competing hypothesis:
Data
I utilize the Policy Agendas Project’s more than sixty years of data on post-war Supreme Court cases to describe the broad trends characterizing the Court’s agenda over this period, and I develop a more in-depth look at a smaller subsection of the Court’s agenda. In par-ticular, I examine the factors impacting the agenda space allocated to labor, crime, and transportation, as well as civil rights and liberties. As an issue area, civil rights and liberties has been a mainstay of the Court’s agenda, rising in prominence as the Court shifted its focus away from macroeconomics in the years following the Great Depression and Roo-sevelt’s New Deal Pacelle (1991).24 The importance of this issue area over time, especially beginning with the Warren Court, makes it an obvious inclusion. Moreover, given hypothe-ses 1 and 2, I expect that more salient issue areas should better reflect the macrodynamic institutional attention patterns reflected in Figure 1. Thus, in addition to civil rights and liberties, I expect that attention to the issue area of crime should exhibit the hypothesized patterns. Moreover, Court attention to crime has resulted in some of the landmark cases of the post-war era (Mapp v. Ohio (1961); Gideon v. Wainwright (1963)). Labor and transportation, on the other hand, are objectively lower salience issue areas, far from public consciousness. Thus, I have chosen two salient and two non-salient issue areas to examine in light of my expectations.
Figure 2 corroborates Pacelle’s (1991) findings and helps to justify the decision to study crime, labor, transportation, and civil rights and liberties. Figure 2 is a stacked area graph depicting the percentage of the Court’s agenda taken up by twenty-one issue areas from 1946 to 2009. Data is derived from the Policy Agendas Project, and the issue areas corre-spond to the now twenty-one different major topics in the database. As can be discerned from the figure, both civil rights and liberties and crime and law cases have comprised a large portion of the Court’s agenda during this era, whereas labor and transportation have trended downward over the time series. Moreover, the trends depicted in Figure 2 cor-roborate Pacelle’s analysis with regard to the decrease in the Court’s focus on issues of a
macroeconomic nature.
Fig. 2:Percentage of Supreme Court Cases by Major Topic Area: 1946-2009
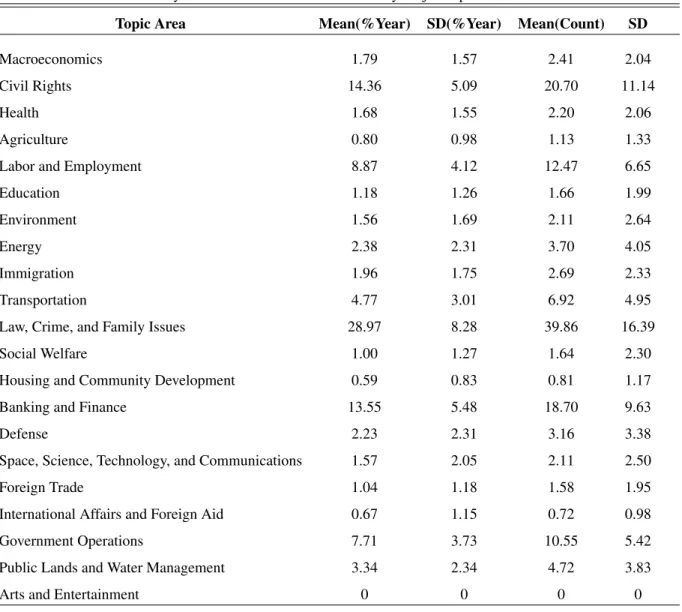
Table 1:Summary Statistics: Post-War Court Cases by Major Topic Area
Topic Area Mean(%Year) SD(%Year) Mean(Count) SD
Macroeconomics 1.79 1.57 2.41 2.04
Civil Rights 14.36 5.09 20.70 11.14
Health 1.68 1.55 2.20 2.06
Agriculture 0.80 0.98 1.13 1.33
Labor and Employment 8.87 4.12 12.47 6.65
Education 1.18 1.26 1.66 1.99
Environment 1.56 1.69 2.11 2.64
Energy 2.38 2.31 3.70 4.05
Immigration 1.96 1.75 2.69 2.33
Transportation 4.77 3.01 6.92 4.95
Law, Crime, and Family Issues 28.97 8.28 39.86 16.39
Social Welfare 1.00 1.27 1.64 2.30
Housing and Community Development 0.59 0.83 0.81 1.17
Banking and Finance 13.55 5.48 18.70 9.63
Defense 2.23 2.31 3.16 3.38
Space, Science, Technology, and Communications 1.57 2.05 2.11 2.50
Foreign Trade 1.04 1.18 1.58 1.95
International Affairs and Foreign Aid 0.67 1.15 0.72 0.98
Government Operations 7.71 3.73 10.55 5.42
Public Lands and Water Management 3.34 2.34 4.72 3.83
Arts and Entertainment 0 0 0 0
regressions, along with their correspondingR2values. Of the twenty-one major topic areas,
the coefficient estimates on crime, labor, and transportation are among the largest. Thus, I have chosen two issue areas that have trended upward in the post-war period and two issue areas that have trended downward.
Fig. 3:Percentage of Supreme Court Cases: 1946-2009
Year
P
ercentage of Agenda
1950 1960 1970 1980 1990 2000 2010
0
10
20
30
40
50 CrimeCivil Rights and Liberties
Table 2:Major Topic Areas Regressed on Year
(Year) R2
Macroeconomics -0.03 0.15
Civil Rights 0.07 0.06
Health 0.05 0.41
Agriculture -0.03 0.25
Labor and Employment -0.15 0.44
Education 0.03 0.14
Environment 0.05 0.33
Energy -0.06 0.22
Immigration -0.02 0.05
Transportation -0.13 0.61
Law, Crime, and Family Issues 0.35 0.62
Social Welfare 0.01 0.02
Housing and Community Development 0.01 0.06
Banking and Finance -0.14 0.22
Defense -0.08 0.38
Space, Science, Technology, and Communications 0.03 0.09
Foreign Trade -0.02 0.14
International Affairs and Foreign Aid 0.02 0.14
Government Operations -0.02 0.01
Public Lands and Water Management 0.05 0.14
Arts and Entertainment 0 NA
Note: Dependent Variable is the percentage of cases devoted to major topic area per year
Correlations and Time Series Trends
attention, the use of State of the Union policy quasi-mentions is a common measure of presidential issue priority (Yates, Whitford and Gillespie 2005; Light 1991b).25 For the congressional agenda, I use the percentage of congressional hearings per year for a given major topic area (Yates, Whitford and Gillespie 2005; Flemming, Wood and Bohte 1999). I present summary statistics for these variables for each issue area in the Appendix. Data for the congressional, Supreme Court, and presidential agendas are derived from the Policy Agendas Project. Using this data, I have graphed the time series trends of the three vari-ables for crime, labor, transportation, and civil rights and liberties below. Figure 4 shows the governmental agenda attention to crime. Interestingly, as hypothesized, the trends for the Supreme Court and Congress seem to move together, and the president’s agenda also mirrors its brethren agendas, although to a lesser degree. Figure 5 shows the governmental agenda attention to labor. Similar trends emerge for the Court and Congress, but not so for the president’s agenda. Once again, Congress and the Court appear to be moving in similar directions for transportation in Figure 6, but the president’s agenda appears much more volatile. Finally, Figure 7 depicts the government agenda allocation devoted to civil rights and liberties. Of the four time series graphs, civil rights and liberties appears to show the least degree of correlation among the agendas.
Fig. 4:Percentage of Governmental Agendas: Crime
Year
P
ercentage of Go
ver
nment Attention
1950 1960 1970 1980 1990 2000 2010
0
10
20
30
40
50 Court
Congress President
Fig. 5:Percentage of Governmental Agendas: Labor
Year
P
ercentage of Go
ver
nment Attention
1950 1960 1970 1980 1990 2000 2010
0
5
10
15
20
25
Fig. 6:Percentage of Governmental Agendas: Transportation
Year
P
ercentage of Go
ver
nment Attention
1950 1960 1970 1980 1990 2000 2010
0
2
4
6
8
10
Court Congress President
Fig. 7:Percentage of Governmental Agendas: Civil Rights and Liberties
Year
P
ercentage of Go
ver
nment Attention
1950 1960 1970 1980 1990 2000 2010
0
5
10
15
20
25
30
Court Congress President
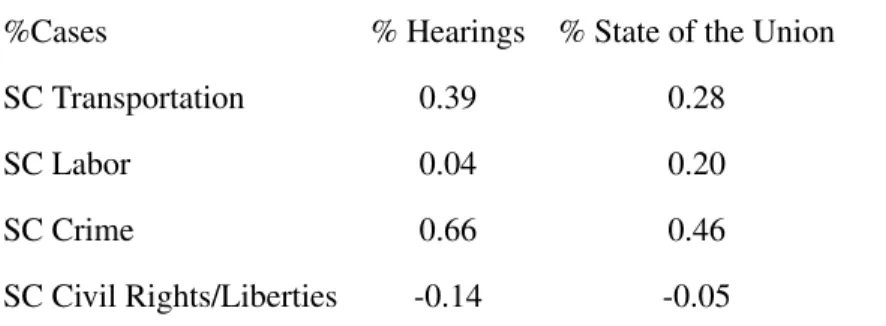
the correlations between the Supreme Court’s agenda and the congressional agenda and between the Court’s agenda and the president’s agenda are positive and moderately strong. The correlations are highest for crime, followed by transportation and then labor.26 The preceding figures and tables provide evidence of a link between the agenda attention allo-cations of the respective governmental branches. I now turn to exploring statistical evidence for the causal linkages between the agendas, with an emphasis on how the presidential and congressional agendas impact the cases that the Court hears and how the Court, in turn, drives issue attention.
Table 3:Correlations between Cases and Hearings and State of the Union
%Cases % Hearings % State of the Union
SC Transportation 0.39 0.28
SC Labor 0.04 0.20
SC Crime 0.66 0.46
SC Civil Rights/Liberties -0.14 -0.05
Vector Autoregression and Agenda Dynamics
The theoretical framework above motivates competing expectations regarding the dy-namics of institutional agenda attention. Hypotheses 1 and 2 posit that issue attention proceeds in a horizontal pattern across institutions, while under hypothesis 3, exogenous pressures structure an institution’s agenda attention. In this section, I formulate a model for testing hypotheses 1 and 2. The dynamic elements of these two hypotheses make the specification of a structural equation model difficult. Thus, I turn to a modeling strategy ca-pable of accounting for these competing dynamics by placing fewer restrictions on model specification and estimation: vector autoregression (Sims 1972, 1980). Vector autoregres-sion is a method of time-series modeling that attempts to capture dynamic interaction over time without the placement of undue restrictions on the nature of that interaction (Carsey,
Jackson, Stewart and Nelson 2011). VAR models do not assume a correct “causal” structure for the underlying data generating process for the time series. VAR attempts to account for the dynamics of all the variables in a time series without initially assuming whether they are endogenous or exogenous, thus simultaneity bias resulting from incorrect specification of an endogneous variable as exogenous is avoided (Brandt and Williams 2007). In a VAR model, “current values of each variable are expressed as functions of their own past values, the past values of the other variables in the analysis, and a residual” (Carsey et al. 2011). Contemporaneous relationships existing between the variables in the model are included in the residuals of each equation, allowing the residuals across equations to contemporane-ously correlate. The residuals are exogenous shocks and innovations. Because VAR models do not assume an a priori structure among related time series, the benefit of using this ap-proach is that multiple theories can be compared and evaluated without the identification and specification assumptions of a typical structural equation model. In essence, one starts with an admitted ignorance about the relationship between the variables in a time series and models the dynamic structure by accounting for the past history of each variable. One then utilizes a system of equations where each equation regresses a potentially endogenous variable upon its own values and the past values of the other variables in the system. Having specified the model, one then proceeds by evaluating the causal effects of the potentially endogenous variables on the others (Granger causality) and then accounting for the amount of variance in each variable that can be attributed to changes in both itself and the other variables in the model (Forecast Error Variance Decomposition).
other branches’ agendas.27,28 Thus, the Court’s agenda is a function of its past agendas, past congressional agendas, and past presidential agendas. The same logic applies to modeling the presidential and congressional agendas, resulting in a total of three equations. Concern for omitted variable bias is lessened because everything affecting the previous agendas of the branches is fully captured by the lagged values. For example, all the factors accounting for the Court’s agenda att 1ort 2is captured in those variables. Thus, only those factors
not fully incorporated in the decision-making process for previous agendas are outside the scope of this modeling approach.
For each issue area, I estimate a vector autoregression model29 with three equations. The dependent variable in each equation is a measure of one institution’s agenda attention and is regressed on past values of itself and on past values of the other measures of agenda attention. I then perform Granger causal testing and compute forecast error variance de-compositions to evaluate the relations between the variables. Granger testing in the VAR
27A key decision in utilizing vector autoregression is the choice of the number of lags to include in the model. Including too few lags is akin to omitted variable bias, as one is leaving some dynamics modeled, but including too many lags results in inefficiency. Specifying lag order relies upon a combination of theory and statistical tests. From a theoretical standpoint, when choosing the number of lags, one should include enough lags to capture the full data cycle. Agenda dynamics need a certain amount of time to fully play out, and lag structure should be chosen to account for the entirety of this structure. For each issue area, I employ both theory and these statistical tests to assist in the selection of an appropriate lag length.
28VAR literature offers two classical tests: Likelihood Ratio (Sims 1980) and Information Criteria (Judge, Hill, Griffiths, Lutkepohl and Lee 1988). A likelihood ratio test compares the maximum values of two models’ likelihoods. One model is estimated with p lags and the second withp 1lags. The null hypothesis under
this test is that the VAR model hasp=p0lags. The alternative hypothesis is that the VAR model hasp=p1
lags wherep1 > p0. This test is distributed 2 with m2(p1 p0)degrees of freedom. See Flemming,
Wood and Bohte (1999) and Brandt and Williams (2007) for the mathematical formula to compute the 2
test statistic. However, this approach is biased towards the inclusion of longer lag lengths because as more parameters (lags) are added to the model, the better the model fits and the larger the final log-likelihood value (Brandt and Williams 2007). Thus, incorrect lengths may be chosen because the likelihood ratio does not take into account the cost of more lags. The second method of determining lag length uses information criteria, including Akaike’s information criterion (AIC), the Bayesian (or Schwarz) information criterion (BIC or SC), and the Hannan-Quinn criterion (HQ). These criteria are computed across different values of p and penalize for adding parameters, in this case lags, to the model. The choice of p that results in the smallest criterion is considered the best fitting model. See Brandt and Williams (2007) for the proper computation of these criteria.
context is a multivariate extension of the direct Granger approach. To give an example, if one has a bivariate VAR model with two time series variables (YtandXt), Granger causality
assesses whether the behavior of past values ofXt can better predictYtthan only the past
values ofYt. If true,Xtis said to Granger causeYt. Of course, this concept works in reverse
as well to evaluate the impact ofYtonXt. Formal hypothesis testing for Granger causality
is done using either an F or a 2 test to assess the joint exogeneity30 of each variable’s lags.31 The null hypothesis, then, is a joint hypothesis that the coefficients of the lags for a given variable are indistinguishable from zero. However, Granger tests offer no under-standing of the dynamics of the VAR system, obscuring reciprocal relationships among the variables. To assess these relationships, I utilize “innovation accounting” to interpret the in-terrelated dynamic changes of the VAR model. Innovation accounting estimates the amount of variation in each of the endogenous variables in the systems of equations due to changes in each of the other endogenous variables over some specified period of time. Specifically, innovation accounting decomposes “the variance of the variables in each equation into the amount of variation from each of the other variables in the system” (Brandt and Williams 2007, p. 46). We are interested, then, in how innovations in each variable affect the variance of each equation. I present the decomposition of the forecast error variance in tables below for each issue area. The numbers in the column are the percentage of a variable’s forecast error variance that can be attributed to both itself and the other variables. The tcolumn is the number of steps after the innovation. A variable that is exogenous to the rest of the system should account solely for its variance across time, and one would see percentages approaching 100 or unity in the given institution’s own column.
30As noted, the VAR multivariate approach to Granger testing uses block exclusion tests for causality. Block exogeneity allows for a block of several variables and each of their lags to be tested at one time. With block exclusion tests, one tests whether the system is dependent upon a block of variables.
Issue Area Results
Crime
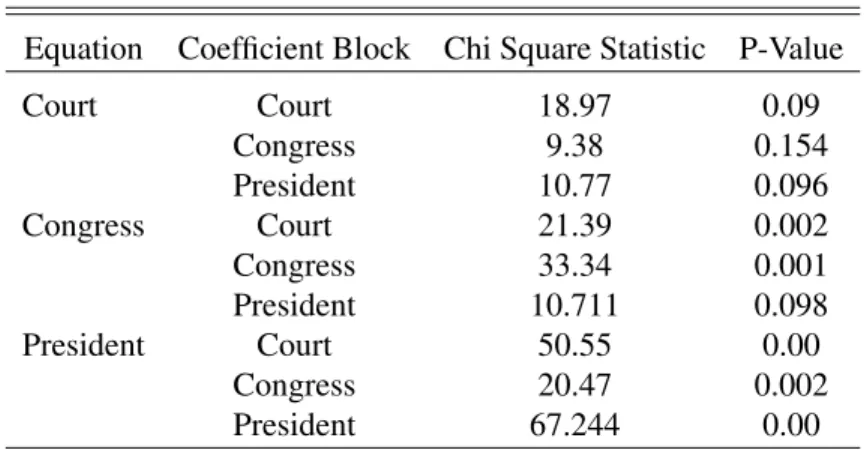
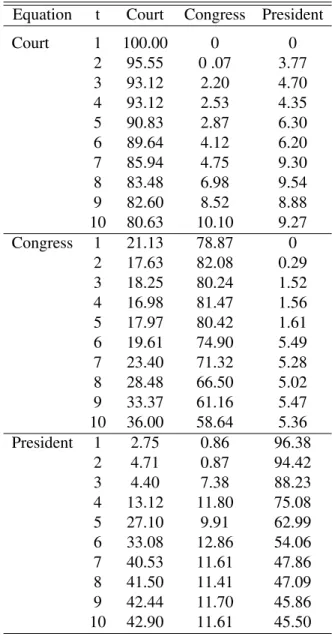
Table 4 shows the results of Granger causality Wald tests for crime.32 These tests present evidence of significant interdependent relationships across the institutions, as expected for a salient issue area. Beginning with this paper’s primary institution of interest, the U.S. Supreme Court, the Granger tests exhibit evidence of a reciprocal relationship between the Court and the president’s attention to crime (P-values lower than the 0.1 significance level). Court attention Granger causes presidential attention, and presidential attention Granger causes Court attention. However, while the Court Granger causes congressional attention, the reverse relationship is not present. Table 5 confirms the impact of the Court on the other institution’s agenda attentions. At each period following a shock to congressional attention, the Court explains a substantial portion of the congressional error variance. Seven years after the initial shock, for example, the Court explains about 23.40 percent of Congress’ forecast error variance, and this pattern continues in subsequent periods. The Court is per-haps even more influential with regard to the president. Seven years following a shock to presidential attention, the Court explains about 40.53 percent of the forecast error variance. Again, this trend is even more pronounced in subsequent years. The Court’s attention also displays path dependence, as past values of its own attention Granger causes current atten-tion. However, Congress and the president are both influential in explaining the Court’s attention. While a substantial portion of the Court’s attention is explained by its own past, the other branches are also important. Eight years after a shock to Court attention, presiden-tial attention explains about 9.54 percent of the Court’s forecast error variance. Moreover, while Congress does not Granger cause Court attention, Table 5 indicates that congres-sional attention has a moderate impact on explaining the Court’s forecast error variance,
particularly in later years following a shock. The Granger tests in Table 4 also indicate a reciprocal relationship between presidential attention and congressional attention. Further-more, congressional attention is modestly important in explaining the president’s forecast error variance. Six years after the initial shock to presidential attention, congressional at-tention explains about 12.86 percent of the forecast error variance. Ultimately, what results from this analysis of crime is evidence of a highly interdependent system of institutions displaying horizontal agenda attention dynamics. The Court, in particular, emerges as the key institution driving agenda attention in this area.
As depicted in Figure 4, crime occupies a significant portion of institutional attention across institutions. Moreover, crime has been an important electoral issue in the post-war era, particularly during the 1968 presidential election, and is frequently an important con-cern among the general public, particularly in densely populated urban areas. Furthermore, a number of the Supreme Court’s landmark decisions in the post-war era concerned this is-sue area. For example, the Warren Court’s expansion of defendants’ rights is encapsulated inMiranda v. Arizona (1965), Mapp v. Ohio(1961), andGideon v. Wainwright (1963). These cases are among the most salient and legally influential in post-war America. Given the salience of the cases in this area, as well as the issue’s high valence nature, it is not surprising that the institutional agendas appear highly interdependent. Indeed, crime is the issue area I would expect to display the most evidence of institutional interdependence. Thus, with regard to crime, the results provide support for Hypotheses 1 and 2.
Table 4:Crime Granger Causality Tests
Equation Coefficient Block Chi Square Statistic P-Value
Court Court 18.97 0.09
Congress 9.38 0.154
President 10.77 0.096
Congress Court 21.39 0.002
Congress 33.34 0.001
President 10.711 0.098
President Court 50.55 0.00
Congress 20.47 0.002
Table 5:Forecast Error Variance Decomposition: Crime
Equation t Court Congress President
Court 1 100.00 0 0
2 95.55 0 .07 3.77
3 93.12 2.20 4.70
4 93.12 2.53 4.35
5 90.83 2.87 6.30
6 89.64 4.12 6.20
7 85.94 4.75 9.30
8 83.48 6.98 9.54
9 82.60 8.52 8.88
10 80.63 10.10 9.27
Congress 1 21.13 78.87 0
2 17.63 82.08 0.29
3 18.25 80.24 1.52
4 16.98 81.47 1.56
5 17.97 80.42 1.61
6 19.61 74.90 5.49
7 23.40 71.32 5.28
8 28.48 66.50 5.02
9 33.37 61.16 5.47
10 36.00 58.64 5.36
President 1 2.75 0.86 96.38
2 4.71 0.87 94.42
3 4.40 7.38 88.23
4 13.12 11.80 75.08
5 27.10 9.91 62.99
6 33.08 12.86 54.06
7 40.53 11.61 47.86
8 41.50 11.41 47.09
9 42.44 11.70 45.86
10 42.90 11.61 45.50
Labor
Table 6 presents Granger tests for the labor issue area.33 The pattern of labor agenda attention is certainly less interdependent than what was presented for crime and accords well with the expectations for a lower salience issue area. The Granger tests in Table 6 indicate that congressional attention Granger causes Court attention, but the relationship is
not reciprocal. Table 7 shows that six years after a shock to Court attention, congressional attention explains about 7.96 percent of the Court’s error variance, while presidential atten-tion never explains more than 2.12 percent in any period. The Granger results also indicate that presidential attention does not Granger cause Court attention, but Court attention does Granger cause presidential attention. However, Court attention explains very little of the forecast error variance for the president. More of presidential attention error variance is explained by congressional attention and by the president’s own history of attention.
Finally, congressional attention is not Granger caused by any of the other institutional variables, and appears exogenous. This result is confirmed by the forecast error variance de-compositions in Table 7, as even ten years after the initial shock to congressional attention, 95.91 percent of congressional error variance is explained by its own past values. Thus, while some evidence of agenda linkages emerges, the pattern of labor agenda attention across institutions is much less interdependent than for crime, and only moderate support is found for the inter-branch hypotheses. Of the institutional agendas, the president’s agenda attention appears most dependent on the other branches, followed closely by the Court’s. These results indicate that Congress is the most important institution with respect to its influence on attention to labor issues.
Table 6:Labor Granger Causality Tests
Equation Coefficient Block Chi Square Statistic P-Value
Court Court 1.06 0.30
Congress 2.99 0.08
President 4.34 0.11
Congress Court 1.20 0.27
Congress 1.30 0.52
President 0.27 0.60
President Court 4.29 0.04
Congress 3.41 0.07
Table 7:Forecast Error Variance Decomposition: La-bor
Equation t Court Congress President
Court 1 100.00 0.00 0.00
2 95.83 3.08 1.08
3 92.58 5.72 1.69
4 90.92 7.12 1.96
5 90.21 7.73 2.06
6 89.94 7.96 2.10
7 89.8 8.04 2.11
8 89.82 8.07 2.11
9 89.81 8.08 2.12
10 89.80 8.08 2.12
Congress 1 0.91 99.09 0.00
2 2.60 97.07 0.33
3 3.33 96.31 0.35
4 3.60 96.04 0.35
5 3.70 95.60 0.35
6 3.72 95.92 0.36
7 3.73 95.91 0.36
8 3.73 95.91 0.36
9 3.73 95.91 0.36
10 3.73 95.91 0.36
President 1 0.31 0.01 99.68
2 2.96 4.28 92.76
3 3.92 6.15 89.94
4 4.12 6.80 89.02
5 4.26 7.01 88.73
6 4.28 7.08 88.64
7 4.29 7.10 88.62
8 4.29 7.11 88.61
9 4.29 7.11 88.61
10 4.29 7.11 88.61
Transportation
Table 8 presents Granger tests for the transportation issue area.34 Results indicate that attention dynamics are even less interdependent than either labor or crime, as the horizon-tal attention patterns that emerged for crime, and to a lesser degree for labor, are absent. Neither congressional nor presidential attention Granger causes Court attention, and
dential attention is not Granger caused by Court or congressional attention. Attention does, however, flow from the Court to Congress, but, again, this relationship is not reciprocal. This result is observed in Table 9, which shows that five years after a shock to congres-sional attention, Court attention explains over 14 percent of Congress’ forecast error vari-ance. The Court’s attention is fairly exogenous, as congressional attention explains a very modest amount of the Court’s forecast error variance, only slightly more than presidential attention. Ultimately, weak support is uncovered for the inter-branch hypotheses in this issue area. Like with labor, the absence of significant “causality” flowing from presidential and congressional agendas to the Court is not surprising given transportation’s low salience nature. Indeed, as Figure 3 demonstrates, during the post-war era, transportation cases occupy the least amount of Court agenda attention of the issues analyzed in this paper.
Table 8:Transportation Granger Causality Tests
Equation Coefficient Block Chi Square Statistic P-Value
Court Court 3.57 0.17
Congress 1.74 0.19
President 1.51 0.22
Congress Court 4.92 0.03
Congress 5.03 0.08
President 0.03 0.87
President Court 0.19 0.66
Congress 0.02 0.90
Table 9:Forecast Error Variance Decomposition: Transportation
Equation t Court Congress President
Court 1 100.00 0 0
2 96.24 2.26 1.49
3 94.33 3.62 2.05
4 93.53 4.23 2.23
5 93.22 4.49 2.29
6 93.10 4.59 2.31
7 93.04 4.64 2.32
8 93.02 4.65 2.32
9 93.02 4.66 2.32
10 93.01 4.66 2.32
Congress 1 1.84 98.16 0.00
2 7.81 92.16 0.03
3 11.54 88.40 0.06
4 13.28 86.59 0.13
5 14.03 85.79 0.18
6 14.34 85.45 0.20
7 14.46 85.32 0.22
8 14.52 85.26 0.23
9 14.54 85.24 0.23
10 14.55 85.23 0.23
President 1 5.53 2.69 91.79
2 5.26 2.82 91.92
3 5.29 2.82 91.89
4 5.31 2.82 91.87
5 5.32 2.82 91.86
6 5.33 2.82 91.85
7 5.33 2.82 91.85
8 5.33 2.82 91.85
9 5.33 2.82 91.85
10 5.33 2.82 91.85
Civil Rights and Liberties
Table 6 presents Granger tests for the civil rights and liberties issue area.35The results indi-cate that little interdependence characterizes agenda attention across institutions, a finding that runs counter to the Flemming, Wood and Bohte (1999) VAR analysis of this issue area. These authors find significant evidence of horizontal institutional agenda attention to civil rights and liberties. However, the authors utilize different data and measurements in their analysis of institutional agenda attention. Moreover, they separate civil rights and liberties into two categories and run separate VAR models on these categories. My analysis lumps together the two areas. Viewing the Granger tests in the table, only Court attention Granger causes presidential attention, and no reciprocal Granger causal relationships are uncovered. Table 11 indicates a high degree of exogeneity for each institution’s agenda attention. Past congressional attention explains more than 99 percent of the forecast error variance of its current attention even ten years after an initial shock. Court and presidential attention fore-cast error variance are also substantially explained by their own past histories. Ultimately, institutional issue attention is least interdependent and is the most exogenous with respect to civil rights and liberties. Thus, no support is found for the inter-branch hypotheses, and I now turn to exploring a possible exogenous influence on institutional agenda attention.
Table 10:Civil Rights and Liberties Granger Causality Tests
Equation Coefficient Block Chi Square Statistic P-Value
Court Court 2.02 0.37
Congress 1.88 0.17
President 0.26 0.61
Congress Court 0.023 0.88
Congress 0.024 0.99
President 0.00 0.97
President Court 5.23 0.02
Congress 0.003 0.96
President 5.31 0.07
Table 11:Forecast Error Variance Decomposition: Civil Rights and Liberties
Equation t Court Congress President
Court 1 100.00 0 0
2 98.19 1.47 0.35
3 97.00 2.63 0.37
4 96.45 3.19 0.37
5 96.21 3.42 0.37
6 96.11 3.52 0.36
7 96.07 3.56 0.36
8 96.06 3.58 0.36
9 96.05 3.59 0.36
10 96.04 3.59 0.37
Congress 1 0.72 99.28 0.00
2 0.61 99.39 0.00
3 0.57 99.43 0.00
4 0.56 99.44 0.00
5 0.55 99.44 0.00
6 0.55 99.45 0.00
7 0.55 99.45 0.00
8 0.55 99.45 0.00
9 0.55 99.45 0.00
10 0.55 99.45 0.00
President 1 0.00 1.31 98.62
2 6.85 1.21 91.94
3 7.42 1.30 91.29
4 7.43 1.37 91.20
5 7.43 1.42 91.15
6 7.43 1.44 91.13
7 7.43 1.43 91.13
8 7.43 1.45 91.12
9 7.43 1.45 91.12
10 7.43 1.45 91.12
Modeling the Exogenous Pressures
regres-sion for crime and an iterative procedure for the other issue areas as estimation tools.36 I continue to control for the effects of inter-governmental agenda attention, using the same measures and lag structures detailed above. The key independent variable in this model is a measure of societal change. Media coverage seems an appropriate proxy for dealing with prevailing societal change, and it is logically sound to expect that the media serves as a conduit for societal and technological information to the Court. I operationalize media attention using theNew York TimesIndex measure, and I again use the percentage of a given issue per year. The results37are presented below in Table 12,38and the evidence appears to support the exogenous support hypothesis for transportation and labor.
Columns 1 and 2 present the results for transportation and labor. TheNew York Times coefficient is statistically significant and is in the expected positive direction. An increase inNew York Times attention to transportation and labor leads to a corresponding increase in Supreme Court attention to those areas. While theNew York Timescoefficient is in the expected positive direction for civil rights and liberties, the coefficient does not attain sta-tistical significance. In addition, no significant result emerges for crime with respect to the New York Timescoefficient. Thus, moderate evidence is uncovered to support hypothesis 3. Turning to inter-branch explanations of the Court’s attention, the Court’s issue agenda attention appears path dependent across issue areas. The impact of past values of Court attention is consistently significant and positive in direction. This indicates that Court deci-sions do not themselves provide the final word on political and legal questions, but instead beget the need for further clarification. Such a finding accords well with that of Baird’s (2009), who argues that politically salient Court decisions signal to potential litigants the
36I originally estimated OLS models for each major topic area. However, upon detection of serial correla-tion in the models for labor, transportacorrela-tion, and civil rights and liberties, I estimated these parameters with the Prais-Winston, Cochran-Orcutt iterative procedure. The results from these models are reported in the table for these three issue areas along with robust standard errors. No serial correlation was detected from the OLS model for crime. Thus, I report OLS coefficients for this topic area. I also tested for multicollinearity among the many coefficients for the crime model, but the issue was not present.
37Cases, Hearings, and State of the Union are lagged six years for crime, and one year for labor, transporta-tion, and civil rights and liberties. TheNew York Timesseries is also lagged one year.
Court’s desire to hear more cases in that issue area.
On the other hand, the results for inter-branch effects are uneven, as Hearings and State of the Union quasi-mentions are never both positive and significant. While evidence of inter-branch relationships emerged in the VAR analysis for crime, the weak findings for inter-branch explanations for labor, transportation, and civil rights and liberties in that anal-ysis suggests the need to incorporate other factors of attention to these areas in terms of exogenous factors. WhileNew York Timesattention was significant for transportation and labor, the lowR2 value for civil rights and liberties indicates that important dynamics are
being left unmodeled. Future work should utilize different and more informed measures of exogenous pressures.
Table 12:Effects of Exogenous and Inter-Branch Pressures
Crime Labor Transportation Civil Rights and Liberties
(Intercept) -2.62 3.79⇤⇤ -0.82 8.26⇤⇤
(4.67) (1.67) (1.07) (2.56)
Cases 0.18 0.77⇤⇤ 0.47⇤⇤ 0.42⇤⇤
(0.17) (0.09) (0.13) (0.13)
Hearings -0.37 -0.82⇤ 0.24 -0.56⇤⇤
(0.77) (0.44) (0.26) (0.25)
State of the Union -0.35 -0.04 0.07 0.05
(0.26) (0.08) (0.28) (0.27)
New York Times -0.40 0.43⇤ 0.64⇤⇤ 0.88
(0.71) (0.25) (0.27) (0.53)
N 58 62 62 62
R2 0.73 0.71 0.71 0.32
⇤p <0.10,⇤⇤p <0.05
Note: Standard errors in parentheses.
Conclusion
How-ever, much less interdependent agenda attention is found for labor, transportation, and civil rights and liberties. This result for civil rights and liberties is curious and runs counter to Flemming, Wood and Bohte’s (1999) earlier finding for these issue areas. This result may be due to a number of factors. For one, Flemming, Wood and Bohte (1999) partition civil rights and liberties into separate issue areas and run VAR models on both areas. Moreover, our different data sources and differing measures of the institutional agenda attentions may be driving some of these disparate results. As noted above, my measures of attention are derived from the Policy Agendas Project, while Flemming, Wood and Bohte (1999) use the Supreme Court Judicial Database (Spaeth 1993), the proportion of all hearing days as reported by theCongressional Information Service Index (CIS), and an index of presiden-tial attention usingThe Public Papers of the President. Regardless, both projects provide evidence of inter-institutional agenda attention across different issue areas.39
What drives the agenda attention of the United States Supreme Court? This paper moti-vates and tests a series of competing and complementary hypotheses regarding this agenda attention, and, to some extent, the results provide evidence for both inter-branch and ex-ogenous explanations. I theorize that Court agenda attention is a reaction to attention to salient issues by the other branches, but also drives attention from itself to Congress and the president. Granger causality tests and innovation accounting analysis provide support for this expectation, particularly with regard to crime. The role of the Court as agenda setter is perhaps this project’s most interesting finding, as the importance of the Court as an attention driver for the American political system is often not emphasized. Such a finding speaks to the importance of studying the three branches together rather than in isolation as a means to further our understanding of the relationships underlying the political system.
Additionally, OLS and iterative estimation uncover support for an exogenous pressures explanation for transportation and labor. These results suggest the importance of incorpo-rating both inter-branch and exogenous explanations to studies of Court agenda-setting and developing a more unified theory for explaining the macrodynamic patterns of the Court’s
APPENDIX
Note that the data utilized for Figures 8 and 9 are derived from the Supreme Court Com-pendium (Epstein, Segal, Spaeth and Walker 2011) and the Federal Judicial Center,40 re-spectively. The numbers featured in Tables 13 through 16 reflect percentages.
Fig. 8: Number of New Case Filings
Year
Case Filings
1940 1950 1960 1970 1980 1990 2000 2010
2000
4000
6000
8000
Fig. 9: Number of Cases Disposed by Full Opinion
Year
Cases
1950 1960 1970 1980 1990 2000 2010
0
50
100
150
200
Table 13:Summary Statistics for Crime
Variable Mean Std. Dev. Min. Max.
Cases 28.97 8.28 13.04 45
Hearings 4.31 1.87 0.68 9
Table 14:Summary Statistics for Labor
Variable Mean Std. Dev. Min. Max.
Cases 8.87 4.12 0.00 21.21
Hearings 2.93 0.95 0.83 8.1
State of the Union 3.36 3.52 0 24.08
Table 15:Summary Statistics for Transportation
Variable Mean Std. Dev. Min. Max.
Cases 4.77 3.01 0 10.94
Hearings 4.95 1.11 2.65 13.76
State of the Union 0.64 1.21 0 5.97
Table 16: Summary Statistics for Civil Rights and Liberties
Variable Mean Std. Dev. Min. Max.
Cases 14.35 5.09 3.13 29.17
Hearings 4.31 1.87 0.68 9
State of the Union 2.53 2.22 0 11.11
Table 17:Correlations between Hearings and State of the Union Mentions
Issue Area %State of the Union
% Hearings Transportation 0.18
% Hearings Labor -0.06
% Hearings SC Crime 0.48
Table 18:Vector Autoregression Results for Crime
Court Cases Hearings State of the Union
(Intercept) -2.62 -0.85 -11.67 (4.63) (1.00) (2.28) % Casest 1 0.18 -0.09⇤⇤ -0.08
(0.16) (0.04) (0.11)
% Casest 2 0.06 0.02 0.06
(0.18) (0.04) (0.12) % Casest 3 0.47⇤⇤ -0.03 -0.21⇤
(0.18) (0.04) (0.12) % Casest 4 0.03 0.11⇤⇤ 0.27⇤⇤
(0.17) (0.04) (0.11) % Casest 5 0.37⇤ 0.02 0.44⇤⇤
(0.19) (0.12) (0.09) % Casest 6 0.04 0.07 0.36⇤⇤
(0.22) (0.05) (0.14) % Hearingst 1 -0.34 0.59⇤⇤ -0.08
(0.76) (0.14) (0.11) % Hearingst 2 1.01 -0.23 -0.99⇤
(0.87) (0.18) (0.57) % Hearingst 3 -1.46⇤ 0.51⇤⇤ -0.39
(0.85) (0.18) (0.56) % Hearingst 4 0.24 -0.28 0.30
(0.91) (0.20) (0.60) % Hearingst 5 0.59 0.27 -0.41
(0.90) (0.19) (0.59) % Hearingst 6 0.68 -0.27 -0.05
(0.80) (0.17) (0.52) % State of the Uniont 1 -0.31 0.02 -0.17
(0.25) (0.05) (0.16) % State of the Uniont 2 -0.17 0.01 0.09
(0.23) (0.05) (0.15) % State of the Uniont 3 0.15 -0.05 -0.05
(0.23) (0.05) (0.15) % State of the Uniont 4 -0.14 -0.01 -0.10
(0.22) (0.05) (0.15) % State of the Uniont 5 -0.10 -0.09⇤ -0.23
(0.22) (0.05) (0.14) % State of the Uniont 6 -0.39 0.05 -0.02
(0.20) (0.04) (0.13)
N 58 58 58
R2 0.73 0.76 0.65
adj.R2 0.60 0.65 0.49
⇤p <0.10,⇤⇤p <0.05