Personality and Social Psychology Review 2016, Vol. 20(3) 245 –268
© 2015 by the Society for Personality and Social Psychology, Inc. Reprints and permissions: sagepub.com/journalsPermissions.nav DOI: 10.1177/1088868315592334 pspr.sagepub.com
Article
The question–behavior effect (QBE) refers to the impact of asking questions about a behavior (vs. not asking such ques-tions) on subsequent performance of that behavior. This effect is also known as the mere-measurement effect, the self-prophecy effect, self-erasing errors of prediction, and self-generated validity (Sprott, Spangenberg, Block, et al., 2006). An illustrative study by Williams, Block, and Fitzsimons (2006) showed that asking students about their intentions to exercise increased subsequent self-reported exercise rates from 14% to 26% 2 months later. Although the QBE has also been assessed using questions about attitudes and past behavior, the vast majority of studies ask self-pre-diction or intention questions, which form the focus of the present review. We report a meta-analysis that updates and extends previous narrative (Dholakia, 2010) and quantitative (Spangenberg & Greenwald, 1999; Sprott, Spangenberg, Knuff, & Devezer, 2006) reviews, and tests conceptual and methodological moderators using both univariate and multi-variate analyses.
The QBE has been observed in a variety of research domains, and most often for health, consumer, and prosocial behaviors. Within the health domain, a large number of stud-ies have demonstrated that the QBE can be harnessed as an effective intervention, increasing uptake of health checks (Conner, Godin, Norman, & Sheeran, 2011; Spangenberg &
Sprott, 2006; Sprott, Smith, Spangenberg, & Freson, 2004; Sprott, Spangenberg, & Fisher, 2003), health screening (Sandberg & Conner, 2009), and vaccinations (Conner et al., 2011). QBEs on consumer purchase behaviors have also been demonstrated and replicated (Chandon, Morwitz, & Reinartz, 2004; Fitzsimons & Williams, 2000; Janiszewski & Chandon, 2007; Morwitz & Fitzsimons, 2004; Morwitz,
1University of Sheffield, UK 2University of Leeds, UK 3University of Sussex, UK
4Macquarie University, Sydney, Australia 5Laval University, Quebec City, Quebec, Canada 6University of North Carolina at Chapel Hill, USA
Corresponding Authors:
Chantelle Wood, Department of Psychology, University of Sheffield, Western Bank, Sheffield S10 2TP, UK.
Email: [email protected]
Mark Conner, School of Psychology, University of Leeds, Leeds LS2 9JT, UK.
Email: [email protected]
Paschal Sheeran, Department of Psychology and Neuroscience, University of North Carolina at Chapel Hill, 323B Davie Hall, Chapel Hill, NC 27599-3270, USA.
Email: [email protected]
The Impact of Asking Intention or
Self-Prediction Questions on Subsequent
Behavior: A Meta-Analysis
Chantelle Wood
1, Mark Conner
2, Eleanor Miles
3,
Tracy Sandberg
2, Natalie Taylor
4, Gaston Godin
5,
and Paschal Sheeran
6Abstract
The current meta-analysis estimated the magnitude of the impact of asking intention and self-prediction questions on rates of subsequent behavior, and examined mediators and moderators of this question–behavior effect (QBE). Random-effects meta-analysis on 116 published tests of the effect indicated that intention/prediction questions have a small positive effect
on behavior (d+ = 0.24). Little support was observed for attitude accessibility, cognitive dissonance, behavioral simulation,
or processing fluency explanations of the QBE. Multivariate analyses indicated significant effects of social desirability of behavior/behavior domain (larger effects for more desirable and less risky behaviors), difficulty of behavior (larger effects for easy-to-perform behaviors), and sample type (larger effects among student samples). Although this review controls for co-occurrence of moderators in multivariate analyses, future primary research should systematically vary moderators in fully factorial designs. Further primary research is also needed to unravel the mechanisms underlying different variants of the QBE.
Keywords
Johnson, & Schmittlein, 1993; Van Kerckhove, Geuens & Vermeir, 2012), as have effects on prosocial behaviors such as blood donation (Cioffi & Garner, 1998; Godin, Sheeran, Conner, & Germain, 2008).
The most recent meta-analyses of the QBE are either long out of date (Spangenberg & Greenwald, 1999) or focused only on health-related behaviors (Sprott, Spangenberg, Knuff, & Devezer, 2006). Importantly, neither meta-analysis specifically examined mediators and moderators of the QBE, which form the focus of the present review. Sprott, Spangenberg, Block, et al. (2006), and Dholakia (2010) pointed out that there have been few attempts to examine the moderators and drivers of the QBE across different domains of research. Similarly, although a number of plausible theo-retical explanations for the QBE have been supported in the literature, very few studies have pitted these explanations against one another, and there is no current consensus as to the mechanisms underlying the QBE. Accordingly, the time seems fitting for a broad meta-analytic synthesis that includes recent literature, with the aim of shedding light on mediators and moderators of the QBE.
Mechanisms Underlying the QBE
A number of mediators of the QBE have been proposed as potential mechanisms. The most prominent explanations involve attitude accessibility (Morwitz et al., 1993; Morwitz & Fitzsimons, 2004), cognitive dissonance (Spangenberg & Greenwald, 1999; Spangenberg & Sprott, 2006; Spangenberg, Sprott, Grohmann, & Smith, 2003), and processes related to behavioral simulation and processing fluency (Janiszewski & Chandon, 2007; Levav & Fitzsimons, 2006; Sherman, 1980). We discuss these key explanations of the QBE, and how they are tested in the current meta-analysis, below.
Attitude Accessibility
The attitude accessibility explanation of the QBE assumes that asking people to report their behavioral intentions or to predict their behavior activates the attitude underlying that behavior, making it more accessible in memory. In turn, this heightened accessibility of the relevant attitude increases the likelihood that the person will perform the target behavior (Dholakia, 2010) or, more accurately, makes it more likely that the person will act consistently with his or her attitude (Morwitz et al., 1993; Morwitz & Fitzsimons, 2004). It is well established that the relationship between attitudes and behavior is stronger when attitudes are more accessible (Chen & Bargh, 1999; Fazio, Chen, McDonel, & Sherman, 1982; Fazio & Williams, 1986; for a meta-analysis, see Cooke & Sheeran, 2004). Attitude accessibility accounts of the QBE suggest that questioning should only promote behavior when the sample predominantly holds attitudes that favor perfor-mance of the behavior (Fitzsimons & Morwitz, 1996; Godin et al., 2008; Morwitz et al., 1993). This explanation of the
QBE is particularly prevalent in research using the mere-measurement label (Dholakia, 2010).
Consistent with an attitude accessibility explanation of the QBE, participants who are asked to report their intentions or to predict their behavior exhibit more accessible attitudes relative to those that are not asked (Chapman, 2001; Fitzsimons, Nunes, & Williams, 2007; Morwitz & Fitzsimons, 2004). Wood, Conner, Sandberg, Godin, and Sheeran (2014) also recently observed that attitude accessi-bility was a significant mediator of the relationship between intention measurement and behavior. Other research has also shown that the valence of attitudes toward the behavior mod-erate the QBE in line with an attitude accessibility account, such that participants reporting positive attitudes show a stronger QBE than those with negative attitudes (Conner et al., 2011). Indeed, some studies show that questions can decrease performance of the behavior among participants with negative attitudes (e.g., Conner et al., 2011, Study 2).
However, support for attitude accessibility as a mediator of the QBE is by no means uniform. For example, both Perkins, Smith, Sprott, Spangenberg, and Knuff, (2008), and Spangenberg et al. (2012) found no significant differences in attitude accessibility between participants asked to predict whether they would engage in a target behavior relative to participants who made no such prediction. Furthermore, some demonstrations of the QBE occur under conditions that are not easily accounted for by attitude accessibility. In par-ticular, attitude accessibility does not provide a wholly satis-fying explanation of the QBE for behaviors that are performed a long time after questioning, when transient increases in attitude accessibility presumably have decayed. For instance, Godin et al. (2008) observed QBE effects up to 12 months after questioning.
accessibility index was computed by multiplying the response rate to the questionnaire by the attitude valence rating. The association between attitude accessibility and the magnitude of the QBE was then assessed via meta-regression.
Cognitive Dissonance
Cognitive dissonance (Festinger, 1957) is the dominant explanation of the QBE among researchers using the self-prophecy label (Dholakia, 2010). Festinger (1957) defined cognitive dissonance as “the existence of nonfitting relations among cognitions” where cognitions include “any knowl-edge, opinion or belief about the environment, about oneself, or about one’s behavior” (p. 3). Cognitive dissonance is a tension state that motivates attempts to reduce dissonance. In the context of the QBE, cognitive dissonance accrues when people perform a behavior that is inconsistent with a relevant standard of judgment, that is, when people’s actions are inconsistent with beliefs about how they should act (Stone & Cooper, 2001). Answering prediction/intention questions increases the salience of both social norms associated with the behavior (a standard of judgment) and any previous fail-ures to behave in a manner that is consistent with such norms. Such questions cause the respondent to become simultane-ously cognizant of what they should do and what they have done in the past; any observed inconsistency can potentially generate cognitive dissonance. One way to reduce this aver-sive cognitive dissonance is to subsequently act in accor-dance with the social norms or standards (Aronson, 1992). In their self-standards model of cognitive dissonance, Stone and Cooper (2001) noted that both normative standards (i.e., perceived norms) and personal standards (i.e., individual attitudes) can operate in similar ways as the standard for judgment. Dholakia (2010) suggested that personal goals or resolutions can also serve as standards.
Consistent with the dissonance account of the QBE, Spangenberg et al. (2012) found that participants who were asked to predict their own behavior were more likely to engage in downward comparisons that are known to reduce dissonance (Spangenberg et al., 2003)—Participants subse-quently reported higher levels of past socially desirable behavior for themselves, but lower levels for other people. However, most research concerning the cognitive dissonance explanation of the QBE has evaluated this mechanism only indirectly. Support for the mechanisms involved in the QBE is often inferred from moderator effects that are more consis-tent with one theoretical approach rather than another (Sprott, Spangenberg, Block, et al., 2006), and not by directly mea-suring the experience of dissonance. These indirect tests offer mixed support for the role of cognitive dissonance (Spangenberg & Sprott, 2006; Spangenberg et al., 2003; Spangenberg et al., 2012). Spangenberg et al. (2003) found that a self-affirmation manipulation (that is known to reduce cognitive dissonance) attenuated the QBE, whereas Sprott et al. (2003) found that preference for consistency (which is
known to increase susceptibility to cognitive dissonance; Cialdini, Trost, & Newsom, 1995) did not moderate the QBE.
The current meta-analysis sought to address the paucity of direct evidence concerning the cognitive dissonance mecha-nism. We therefore rated the likely degree of discomfort (i.e., cognitive dissonance) experienced by participants at the time of prediction, if their past behavior was not consistent with the normative or personal standards conveyed by their self-predictions or intentions concerning their future behavior. Greater experienced dissonance should increase the likeli-hood of acting in line with normative/personal standards. This explanation of the QBE assumes that actions consistent with standards will reduce dissonance, whereas actions that are inconsistent with standards could maintain or even increase dissonance. Accordingly, we also rated the likely degree of discomfort participants would experience if their future behavior was not consistent with their predictions/ intentions—both at the time of prediction and at the moment of enacting the behavior. Given the potential for overlap among these three ratings, we first examined their intercor-relation before determining whether to treat the items indi-vidually or as a combined index of cognitive dissonance.
Behavioral Simulation and Processing Fluency
A third explanation of the QBE concerns the processes involved in the simulation of behavior and related effects on processing fluency. In the original demonstration of this effect, Sherman (1980) suggested that the QBE is driven by the formation of cognitive representations or behavioral scripts during questioning that are subsequently reactivated when the individual has an opportunity to enact the behavior. Sherman proposed that mental simulation may lead to an increase in the accessibility of the behavioral script or in the perceived likelihood of behavior; either process would pro-mote behavior consistent with the representation.
be easier to represent than incongruent question frames (i.e., asking the same participants about their intentions to eat
fatty foods), and congruent framing generated larger QBEs (Levav & Fitzsimons, 2006). In this meta-analysis, we evalu-ate the role of ease of representation by examining whether the congruence between the question frame (approach, avoidance, or both approach and avoidance) and likely atti-tude distribution moderates the QBE. Evidence for the mod-erating effect of ease of representation would provide indirect support for a behavioral simulation explanation for the QBE.
Recent work has provided more direct support for the role of processing fluency in enhancing the accessibility or per-ceived likelihood of behavior. Janiszewski and Chandon (2007) argued that the QBE prompts processing fluency effects in the form of transfer-appropriate processing. At the moment of acting, activation of the behavior representation and processes involved in deciding whether to act should be facilitated because the same behavior representation and pro-cesses are accessed when participants predicted behavior. Janiszewski and Chandon suggest that this increased process-ing fluency may be misinterpreted as an increased probability of the behavior actually occurring, that is, as an inclination toward the behavior that serves to change subsequent behav-ior. Consistent with this explanation, Janiszewski and Chandon found larger QBEs when there was greater corre-spondence between the intention and behavior measures. That is, asking participants to predict general or specific con-sumer behaviors influenced general and specific ratings of likelihood to purchase, respectively. However, general pre-dictions did not increase the likelihood of specific purchases, or vice versa. In the current meta-analysis, we use the princi-ple of correspondence (e.g., Fishbein & Ajzen, 1975) to quan-tify the match between questions and behavior (along the dimensions of target, action, context, and time), to examine the effect of processing fluency on the QBE. It is important to note, however, that the role of correspondence is not unique to processing fluency accounts for the QBE. Sprott et al. (2004) argued that if cognitive dissonance underlies the QBE, then people who make predictions about a specific behavior should be more likely to capitalize on the first opportunity to reduce dissonance by changing that particular behavior. Thus, both processing fluency and cognitive dissonance accounts predict a larger QBE for intention/prediction questions that show greater correspondence with the behavioral measure. Among QBE studies that use similar self-report measures to tap intention/prediction and behavior, greater correspondence may also reflect greater common method variance (see Conner, Warren, Close, & Sparks, 1999, for an example in relation to intention and behavior). To examine whether any overall effect of correspondence observed in the full set of studies reviewed is due to the common method variance of using self-reports, we also test effects of correspondence in the subset of studies that used objective measures of behavior.
Characteristics of the Question,
Behavior, and Methodology as
Moderators of the QBE
In addition to exploring conceptual factors specified by key explanations of the QBE, we also examined features of the primary studies to identify potential moderators of the QBE—to shed light on the QBE’s boundary conditions and to increase understanding of how to magnify (or attenuate) the effect. In particular, the current meta-analysis explored the impact of characteristics of the question, behavior, and methodology on the strength of the QBE.
Question Characteristics
Question type. QBE research under the mere-measurement versus self-prophecy label differs in the type of question posed to respondents (Sprott, Spangenberg, Block, et al., 2006; Williams et al., 2006). Mere-measurement studies gen-erally ask participants to report their intentions to engage in behavior, whereas self-prophecy studies characteristically ask participants to predict, or rate the likelihood of perform-ing, the behavior. There are reasons to suspect that prediction questions could have a larger effect on subsequent behavior than intention questions. Self-predictions are probability judgments about what one will do and are based on appraisals of both the feasibility and desirability of acting. Behavioral intentions, however, are based more on the behavior’s desir-ability than its feasibility (Sheppard, Hartwick, & Warshaw, 1988) and represent an idealized aim to reach a goal that may involve little commitment. Evidence indicates that behavioral intentions relevant to people’s overarching identity goals are enacted with little tenacity or effort (Gollwitzer, Sheeran, Michalski, & Seifert, 2009), and primary research and meta-analysis have shown that self-prediction has a larger correla-tion with subsequent behavior compared with intencorrela-tion (Armitage & Conner, 2001; Armitage, Norman, Alganem, & Conner, 2015; Sheppard et al., 1988). Here, we test whether question type (prediction vs. intention) moderates the QBE.
Several studies have examined the impact of measuring anticipated regret alongside intentions (e.g., Sandberg & Conner, 2009, 2011), based on findings that measuring antic-ipated regret strengthens intentions and improves intention– behavior consistency (Abraham & Sheeran, 2003, 2004). The QBE might thus be increased by including questions about anticipated regret. However, it is also possible that drawing attention to anticipated regret could be perceived as blatant manipulation by participants and lead to reactance (Brehm, 1966) that reduces the QBE (Godin et al., 2010; see also Godin, Germain, Conner, Delage, & Sheeran, 2014). The current meta-analysis examines whether the QBE is moderated by the use of questions based on the TPB, or the addition of questions relating to anticipated regret.
Number of questions. Studies vary in terms of the number of intention or prediction questions to which participants are asked to respond. However, there has been little explicit con-sideration of whether the number of prediction or intention items moderates the magnitude of the QBE (though see Chapman, 2001; Morwitz et al., 1993), and whether the total number of general questions relating to the focal behavior is influential. The hypothesis that the number of intention/pre-diction questions strengthens the QBE would seem to be consistent with attitude accessibility and behavioral simula-tion explanasimula-tions of the QBE, as repeated measurement should make attitudes and behavioral scripts more accessible or fluent. The current meta-analysis therefore tests whether the number of self-prediction or behavioral intention items, and the total number of behavior-related items moderate the QBE.
Behavior Characteristics
Experience with the behavior. The QBE has been observed for both novel (e.g., singing the Star Spangled Banner over the telephone; Sherman, 1980) and familiar behaviors (e.g., flossing teeth, eating fatty foods; Levav & Fitzsimons, 2006; Williams, Fitzsimons, & Block, 2004). However, relatively little research has directly examined whether experience with performing a behavior moderates the QBE, and the evi-dence is mixed. Morwitz et al. (1993) found that the magni-tude of the QBE on PC purchase was stronger for participants with no previous experience with owning a PC, whereas Godin et al. (2010; Godin et al., 2008) found that the QBE was stronger for participants with considerable experience of blood donation than for participants with little or no previous experience. This meta-analysis will test the role of experi-ence in predicting the strength of the QBE.
Behavior domain. The question of whether the QBE consti-tutes a behavior change intervention with wide reach demands analysis of the nature of the target behavior. There has been a recent debate concerning the operation of the QBE in relation to risky behaviors (see Fitzsimons & Moore,
2008b; Sherman, 2008, for detailed discussions). Some stud-ies show that the QBE decreases performance of risky behav-iors (e.g., consumption of fatty foods; Levav & Fitzsimons, 2006), whereas other studies show increases in risky behav-iors (e.g., illegal drug use; Williams et al., 2006). Such doubt over the direction of the QBE for risky behaviors has led some researchers to recommend that asking questions about these behaviors should be avoided—so that risk incidence is not exacerbated (e.g., Fitzsimons & Moore, 2008a). Gollwit-zer and Oettingen (2008) argued, however, that a meta- analytic comparison of the QBE for risky, as compared with other, behaviors is required before conclusions are reached. Accordingly, the current meta-analysis tests the magnitude of the QBE as a function of the risk level of the target behav-ior, by examining the impact of behavior domain on the QBE.
Social desirability. QBE studies have investigated both socially desirable (e.g., blood donation) and socially undesirable (e.g., eating fatty foods) behaviors. Evidence concerning the influence of social desirability on the QBE is mixed. Whereas some studies suggest that the direction of the QBE depends on the desirability of the target behavior (Williams et al., 2004), other research suggests that the QBE prompts increases in behavior regardless of social desirability (Fitzsi-mons et al., 2007; Williams et al., 2006). In the current meta-analysis, we attempt to resolve this debate by testing whether the rated social desirability of each behavior moderates the QBE.
Difficulty of behavior. Another issue concerns whether the magnitude of the QBE depends on the difficulty of perform-ing the target behavior. Classic theories of motivation (e.g., Atkinson, 1954) point out that behavioral performance depends not only on the desirability of the perceived out-comes but also on the feasibility of performing the behavior. This might suggest either a linear effect (i.e., QBE is smaller for difficult-to-perform behaviors relative to those that are easier to perform) or a curvilinear effect (i.e., moderately dif-ficult behaviors are most motivating and therefore likely to produce a larger QBE relative to behaviors that are easy to perform). We therefore assess both linear and quadratic rela-tionships between behavioral difficulty and effect sizes.
Behavior measure. The QBE has been observed both using self-report (e.g., participants indicate whether or how often they performed the target behavior, via questionnaire: Fitzsi-mons et al., 2007; Williams et al., 2006; Williams et al., 2004) and objective measures (e.g., observation of actual behavior; Chandon et al., 2004; Conner et al., 2011; Williams et al., 2004) of behavior. A number of studies have measured the same behavior using both objective and self-report indices, allowing for a direct test of whether the size of the QBE is affected by the way in which behavior is assessed. However, findings are inconsistent. Whereas some research suggests that the QBE is not affected by the type of behavioral measure (Wil-liams et al., 2004), other studies show stronger QBEs using objective measures (Sprott, Spangenberg, & Perkins, 1999), and still other studies observe stronger effects using self-report measures of behavior (Spence, Burgess, Rodgers, & Murray, 2009). The present meta-analysis assesses the impact of behav-ior measure (self-report vs. objective) on the QBE.
Methodological Characteristics
Time interval. Another important factor related to deploy-ment of the QBE as a behavior change intervention concerns the durability of behavioral effects in the wake of self-pre-diction or intention measurement. Research has observed a significant QBE when behavior is measured shortly after questioning within a single laboratory session (e.g., Janisze-wski & Chandon, 2007; Morwitz & Fitzsimons, 2004), over delays of 1 or 2 weeks (e.g., Cioffi & Garner, 1998; Williams et al., 2004), and also after more extended time periods of up to 12 months (e.g., Godin et al., 2008). However, only a handful of studies compared the same behavior at different time points within a single study, and these studies obtained inconsistent results (see, for example, Godin et al., 2008; Spangenberg, 1997). The current meta-analysis examines whether the time interval between questioning and behavior influences the magnitude of the QBE.
Personal contact with the experimenter. Garnering self-predic-tions or intenself-predic-tions from participants can involve personal contact with the experimenter (e.g., questions answered via telephone or face-to-face), or no personal contact (e.g., ques-tions answered via written or online surveys). Concerns about making a good impression on the researcher could steer predictions and intentions in a socially desirable direc-tion when they are reported via personal contact. Moreover, reporting intentions and predictions in-person to the experi-menter could increase people’s feelings of commitment or obligation, and motivate greater striving for consistency between their intentions/predictions and their future behav-ior. We therefore test whether the size of the QBE differs in studies that involve personal contact during questioning rela-tive to studies with no personal contact.
Research setting. The QBE may differ for studies conducted in laboratory versus field settings. In particular, the QBE could
be larger in laboratory settings due to greater demand effects: Participants could feel pressure to act consistently with their intentions or self-predictions because of the presence of the experimenter or the authority of the setting. We therefore com-pare the magnitude of the QBE as a function of the research setting.
Response rate and incentives. One might also expect a smaller effect in field-based relative to laboratory studies because of lower survey response rates in field settings. Research within the health domain, for example, suggests that significant QBEs are found only for those participants who complete and return questionnaires (i.e., when per-protocol analysis is used to examine the data, Sandberg & Conner, 2009). Accordingly, the response rate to questionnaires in field studies (the proportion of participants returning the questionnaire) will be investigated as a potential moderator in the present meta-analysis. We also examine whether the use of incentives (participant payments) moderates the size of the QBE. For example, use of incentives may increase the response rate to questionnaires in field studies (which, as above, is expected to increase the size of the QBE).
Sample type. We examine whether recruitment of students versus non-students as participants influences the QBE. Reli-ance on student samples has been criticized in psychological research (Henrich, Heine, & Norenzayan, 2010). However, the QBE has been tested in a wide variety of different popula-tions, and there seems no reason to expect differences in the QBE as a function of this sample characteristic. Nonetheless, we also code and test the type of sample as a moderator.
Publication year. Finally, we investigate whether there is any evidence of a “decline effect” in the QBE literature (see, for example, Schooler, 2011), by examining whether publication year influences the magnitude of the QBE.
The Present Research
Although a great deal of research has been conducted on the QBE, there is little consensus concerning the mechanisms that underlie the effect. The potential for harnessing the QBE as a simple but effective behavior change intervention is constrained by our relative lack of knowledge regarding the factors that moderate the effect. The present research aims to tackle this gap in the literature by deploying meta-analytic techniques both to gauge the overall effect of questioning on behavior and evaluate theoretical and meth-odological factors that may determine the magnitude and direction of the QBE.
Method
Literature Search
Expanded, Social Science Citation Index Expanded, Arts and Humanities Citation Index) and PsychInfo, encompassing the period between the first published article on the QBE (Sherman, 1980) and March 5, 2013. Search terms used were
self-generated validity, measurement reactivity, self-erasing errors of prediction, mere-measurement effect, self-prophecy effect, question–behavior effect, and questionnaire effects on behavior.1 The reference lists of each article and key narra-tive reviews published in the area (i.e., Dholakia, 2010) were examined, and contact was also made with leading authors in the field. The review was restricted to published studies to ensure that we could retrieve the necessary information con-cerning mediators and moderators of the QBE from the pri-mary reports. It is well established that published reports exhibit higher methodological quality than unpublished reports (e.g., Egger, Jüni, Bartlett, Holenstein, & Sterne, 2003); unpublished work may be partial or incomplete, and it may not be feasible to retrieve the necessary information from authors of unpublished reports. This inclusion criterion
seemed justified as our primary aim was to identify media-tors and moderamedia-tors of the QBE, and not merely estimate the overall effect size.
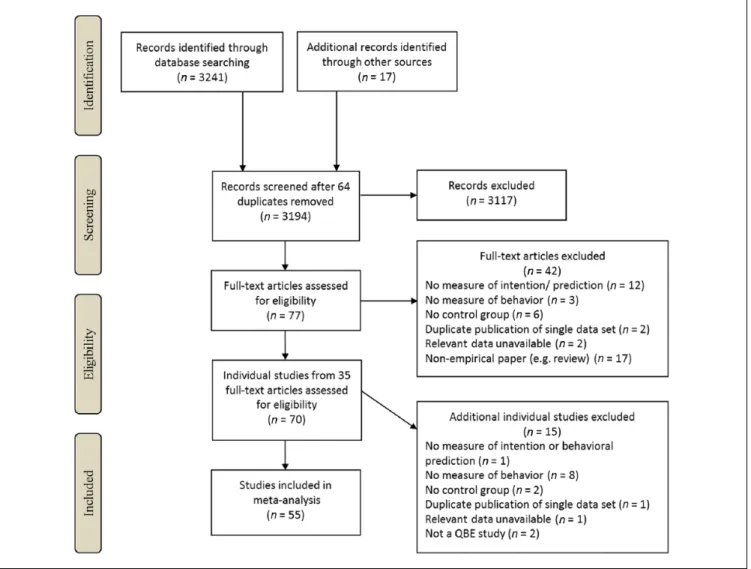
Figure 1 shows the flow of articles through the literature search. After screening for eligibility as detailed below, 35 articles consisting of a total of 55 study data sets were suit-able for inclusion, comprising 116 tests of the QBE. Included articles are marked with an asterisk in the “Reference” sec-tion of this article.
Inclusion Criteria and Eligibility
Studies had to meet the following inclusion criteria: First, studies had to address the QBE in their research, as indicated by their use of relevant QBE terminology (i.e., use of the terms question–behavior effect, mere measurement, self- generated validity, self-prophecy effect, or self-erasing nature of errors of prediction). Second, to allow the QBE to be quantified, studies had to include a measure of behavior.
Figure 1. Literature search flow diagram.
Third, studies had to include a condition that measured par-ticipant’s behavioral intentions, their expectations about the likelihood of them performing a target behavior, or predic-tions of their future behavior, as well as an appropriate com-parison control condition (i.e., no intentions/expectations measured, or non-target behavior intentions measured). Finally, studies had to provide sufficient statistical informa-tion to permit calculainforma-tion of effect sizes. In the case of miss-ing or incomplete effect size data, authors were contacted to request the relevant statistics.
There were also a number of exclusion criteria. QBE stud-ies that did not directly invite a response to questions (e.g., using hypothetical “ask yourself” questions; Fitzsimons & Shiv, 2001; Spangenberg et al., 2003) were excluded from the data set, as were those that focused on measurement of other cognitions that did not require prediction of future behavior, such as expectations regarding satisfaction with or evaluation of customer service (e.g., Dholakia & Morwitz, 2002; Dholakia, Singh, & Westbrook, 2010; Ofir & Simonson, 2007) and measurement of past behavior (e.g., Falk, 2010). Manipulations that involved predicting the behavior of another person (and not the self) were also excluded (Levav & Fitzsimons, 2006, Experiment 1). Finally, to avoid contamination effects, any manipulations or condi-tions that confounded the QBE with other intervencondi-tions designed to change behavior, such as commitment to a self-reward (Fitzsimons et al., 2007), motivational interventions (Ayres et al., 2013), or implementation intentions (Fitzsimons et al., 2007; Godin et al., 2010) were also excluded.2
Non-independent observations. Several studies reported more than one behavioral observation for the same group of partici-pants (e.g., behavior measured at two time points, different ways of measuring a single behavior, multiple alternative methods of analysis). However, inclusion of non-independent observations risks underestimating the error variance associ-ated with each effect size (Borenstein, Hedges, Higgins, & Rothstein, 2009). In cases where the inclusion of multiple non-independent measures did not enhance the scope of the main analyses or was irrelevant for moderator analyses, we elected to select a single key observation for inclusion and omit any additional observations. The key observation selected for inclusion was either that identified by the authors of each study as their key measure or, in the absence of this informa-tion, the first measure reported. Similarly, in cases where mul-tiple control groups were compared with a single experimental group and inclusion of more than one control condition pro-vided no added information concerning the QBE, the “purest” control group only was included (i.e., the no-contact control groups; Cioffi & Garner, 1998, Experiment 1; Obermiller, Spangenberg, & Atwood, 1992, Experiment 1; Sherman, 1980, Experiment 1; the neutral questionnaire control group; Chapman, 2001; the no-question control group; Van Kerck-hove et al., 2012, Experiment 2a).
A number of studies also reported results using multiple methods of analysis or data screening. Sandberg and Conner (2009, Experiment 1), Godin et al. (2010, Experiment 1), and Conner et al. (2011, Experiment 1 and Experiment 2), for example, reported the results of both per-protocol analy-ses (i.e., including data from participants who completed the questionnaire only) and intention-to-treat analyses (i.e., including data from all participants irrespective of whether or not they undertook the intervention and completed the questionnaire). In a similar vein, Greenwald, Carnot, Beach, and Young (1987, Experiment 1 and Experiment 2); Williams et al. (2006, Experiment 1); and Spangenberg (1997, Experiment 1) reported analyses using different screening criteria. Here, the most conservative analysis that excluded the fewest participants (e.g., intention-to-treat analysis) was selected for inclusion.
In some cases, however, non-independent data were inte-gral to the moderator analyses as when behavior was mea-sured over several different time periods within the same sample (Chandon et al., 2004, Experiment 1; Chapman, 2001, Experiment 2; Godin et al., 2010, Experiment 1; Godin et al., 2008, Experiment 1; Spangenberg, 1997, Experiment 1), when objective and self-report measures were both used (Spence et al., 2009, Experiment 1), or when studies com-pared multiple independent experimental groups with a sin-gle control group (Cioffi & Garner, 1998; Lawrence & Ferguson, 2012, Experiment 3; Sprott et al., 2004, Experiment 2, Williams et al., 2004, Experiment 4). Calculating an aver-age effect size that collapses over the observations (see Higgins & Green, 2011, Section 16.5.4) is not appropriate in these cases, as so doing would result in the omission of important moderator data. Accordingly, effect sizes for each of these non-independent comparisons were included to pre-serve moderator data. However, to avoid underestimating the error variance associated with each effect size, the sample sizes used to calculate the standard errors for each group were divided by the number of times they were included (see Higgins & Green, 2011, Section 16.5.4; Michie, Abraham, Whittington, McAteer, & Gupta, 2009; Webb, Miles, & Sheeran, 2012).3 The observations included in the meta-anal-ysis are presented in Appendices A and B in the article’s online Supplemental Materials.
Data Extraction and Calculation of Effect sizes
For continuous data, effect sizes were calculated using the means, standard deviations, and sample sizes for each group whenever possible. If these data were missing or incomplete, authors were contacted for further information and/or d was alternatively calculated using t values, univariate F values, and existing reported effect size measures (e.g., r). For dichotomous data, d was first calculated using the number or rate of events and sample size for each group. When these data were unavailable, effect size was instead calculated using odds ratios and confidence limits or chi-square and total sample size. If sample sizes for each condition needed to calculate effect sizes were not reported or not provided by the authors, the number of participants in each condition was estimated by dividing the total sample size by the number of conditions. Effect sizes were calculated such that a positive effect size represents an increase in behavior following posi-tively framed questions (e.g., “I intend to give blood during the next 6 months”; Godin et al., 2008) or neutral questions framed in terms of dichotomous or contrasting options (e.g., “How likely or unlikely would you be to try a Canadian candy bar if it was available in the U.S.”; Morwitz & Fitzsimons, 2004), or a decrease in behavior following nega-tively framed questions (e.g., the likelihood of not eating fatty foods; Levav & Fitzsimons, 2006), relative to the con-trol condition (i.e., no intentions/predictions measured, or intentions/predictions measured for a non-target behavior). Cohen’s (1992) guidelines were used to interpret effect sizes, such that effect sizes of .30, .50, and .80 represented small, medium, and large effects, respectively.
Moderator Coding
Each moderator variable was independently coded by one of the first five authors or the seventh author. Moderators that could be directly extracted from the data were recorded by the first author. These moderators are as follows: Whether questions based on the TPB or anticipated regret were included, the number of behavioral intention or prediction questions, the total number of behavioral questions, behavior frequency, the type of behavior measure, time interval, research setting, response rate and use of incentives, sample type, and publication year. For the remaining moderators, 20% of the studies were double-coded by another author. Interrater reliability was measured using Cohen’s kappa for categorical variables, and intraclass correlations (ICCs) for continuous variables, and is reported below. Disagreements were resolved by discussion (see Appendices A and B in the article’s online Supplemental Materials for key theoretical and methodological moderator coding and effect sizes of studies included in the meta-analysis).
Mechanisms underlying the QBE. Studies were coded for response rate and attitude valence (to compute the index of attitude accessibility), cognitive dissonance, ease of repre-sentation, and correspondence. Interrater reliability was acceptable for all indices and is reported below. Attitude
valence was indexed by rating how positive most of the sam-ple’s attitude toward the behavior was likely to be (5-point scale; extremely negative to extremely positive; ICC = .62). The attitude accessibility index was then calculated by stan-dardizing the attitude valence rating and the response rate to the question, which was the proportion of participants who had returned the relevant questionnaire containing the QBE manipulation (laboratory studies had a response rate of 1.0, whereas field studies varied), and multiplying these to form a single interaction term, such that higher scores indicate greater accessibility of more positive attitudes. Cognitive dissonance was indexed by three items. The first item rated the degree of discomfort experienced by the sample at the moment of pre-diction, if their past behavior is inconsistent with their predic-tions or intenpredic-tions regarding future behavior (5-point scale;
not at all uncomfortable to very uncomfortable; ICC = .66). The second and third items rated the degree of discomfort experienced by participants at the moment of prediction and the moment of behavior, respectively, if their future behavior were to be inconsistent with their predictions or intentions regarding that behavior (5-point scale; not at all uncomfort-able to very uncomfortable; ICCs = .70 and .78). Cronbach’s alpha indicated a high degree of consistency across the three items (α = .89). Accordingly, the three items were averaged to form a single index of cognitive dissonance.
Following Levav and Fitzsimons (2006), ease of repre-sentation was operationalized in terms of the congruency between the sample’s likely attitude and framing of the ques-tion in approach, avoidance, or both approach and avoid-ance, terms (5-point scale; very incongruent match to very congruent match; ICC = .94). For example, approach-framed questions asking about a behavior likely characterized by a strong positive attitude would score 5, whereas avoidance-framed questions asking about a behavior likely character-ized by a strong positive attitude would score 1. Questions framed in terms of both approach and avoidance (e.g., Do you predict that (a) You will do X or (b) You will not do X?) scored 3. Finally, correspondence between the measure of intention or behavioral prediction and behavior was indexed by assigning one point for each match in terms of action, target, context, and time (ICC = .89;for example, Fishbein & Ajzen, 1975).
to try a New Zealand candy bar if it was available in the U.S.?” Fitzsimons & Williams, 2000), or used other termi-nology implying prediction or expectation (e.g., “Would you return to the clinic 1 month after the first shot for a free second hepatitis vaccine shot?” Cox, Cox, Cyrier, Graham-Dotson, & Zimet, 2012). Finally, studies were classified as mixed if they included both intention and prediction items, or items that were not clearly classifiable. Where no exact wording was reported, the item was coded in line with the terminology used by the authors. We also recorded whether studies included TPB questions (attitudes, subjective norms, or perceived behavioral control), questions con-cerning anticipated regret, the number of items used to report behavioral intentions or self-predictions, and the total number of questions that participants were asked about the behavior.
Behavior characteristics. Behaviors were coded according to the following characteristics: experience with the behavior, behavior domain, social desirability, difficulty of behavior, behavior frequency, and the type of behavior measure. Expe-rience with behavior was classified into one of three catego-ries according to the sample’s likely level of experience of performing the behavior (none has experience, experience varies in the sample, or all highly experienced; κ = 0.83). The behavior domain was classified as health, prosocial, consumer, undesirable or risky behavior, and other (κ = 1.0). Behaviors were classified as healthy if performing them was conceived to promote the health or well-being of the indi-vidual performing the behavior (e.g., health club attendance and exercise; Chandon et al., 2011; Godin et al., 2011). Behaviors were coded as prosocial if performing them was considered to benefit other people or society as a whole (e.g., behaviors related to donating blood; Cioffi & Garner, 1998; Godin et al., 2010; Godin et al., 2008). Consumer behaviors were classified as such if they involved consumer purchase or choice decisions (e.g., purchase from an online grocery company; Chandon et al., 2004). Behaviors were classified as risky or undesirable if performing them was considered to be detrimental to health or well-being, or otherwise socially undesirable (e.g., illegal drug use; Williams et al., 2006). Behaviors that did not fit clearly into the above categories were classified as “other” (e.g., reading; Chandon et al., 2011; Levav & Fitzsimons, 2006).
Social desirability was indexed by rating how much the sample would think that other people would want them to perform the behavior (5-point scale; other people would very much [not want–want] the participants to perform this behav-ior; ICC = .89). The difficulty of performing the behavior was indexed by rating how hard it would be for the sample to perform the behavior (5-point scale; not at all hard to very hard; ICC = .61). Behavior frequency (one-time vs. repeated) and the type of behavior measure (self-report [e.g., question-naire] vs. objective [e.g., medical records, behavioral obser-vation]) was also coded.
Methodological characteristics. The following data were also extracted from each study: time interval, personal contact with the experimenter, research setting, response rate and use of incentive, sample type, and publication year. Time interval was indexed by the number of days between questioning and behavioral measurement. Contact with the experimenter was classified as personal when intentions or predictions were requested by the experimenter either face-to-face or via tele-phone, or impersonal when requested via paper question-naires, online questionquestion-naires, or lab-based computer tasks (κ = 1.0). The research setting was either the laboratory or the field. The response rate to questioning was the proportion of participants who had returned the relevant questionnaire con-taining the QBE manipulation; laboratory studies therefore always had a response rate of 1, whereas the values in field studies varied. Whether or not participants received a pay-ment for taking part in the study was also recorded. Finally, sample type was coded student, non-student, or mixed.
Analysis Strategy
Comprehensive Meta-Analysis software, Version 2.2.064 (Borenstein, Hedges, Higgins, & Rothstein, 2005) was used to compute effect sizes and conduct all univariate analyses. Weighted average effect sizes (d+) were based on a random-effects model, following general recommendations for the use of random-effects analyses in meta-analyses (Field, 2003), and given study differences are unlikely to be fully explained by a small number of simple study characteristics (Cooper & Hedges, 1994). Cochran’s (1952) Q statistic was used to test heterogeneity of effect sizes, with a significant Q
indicative of significant heterogeneity. The I2 statistic (Higgins & Thompson, 2002) was used to quantify the degree of heterogeneity. I2 reflects the percentage variance in effect sizes that cannot be explained by chance, and I2 values of 25%, 50%, and 75% indicate low, moderate, and high lev-els of heterogeneity, respectively (Higgins, Thompson, Deeks, & Altman, 2003).
calculated using the following formula: (1 − [τ2 within / τ2 total]) (Borenstein et al., 2009).
Multivariate analyses were performed in STATA (release 12; Stata Corporation, College Station, TX, the United States), using the same statistical model as Comprehensive Meta-Analysis Version 2.2.064 (method of moments without Knapp–Hartung modification of standard errors). Continuous moderators were standardized before analysis to reduce multicollinearity.
Publication bias was evaluated via inspection of funnel plots, Egger’s regression test (Egger, Smith, Schneider, & Minder, 1997), and Duval and Tweedie’s (2000) Trim and Fill technique, which computes an adjusted effect size based on the inclusion of putative missing studies.
Results
Overall Effect Size
The meta-analysis was conducted on 116 tests of the QBE (N = 54,985, unadjusted sample sizes). Meta-analysis using a random-effects model demonstrated a corrected mean-weighted effect size of 0.24, with confidence intervals (CIs) not including 0 (95% CI = [0.18, 0.30]). Interpreted in the context of Cohen’s (1992) guidelines, this suggests that inten-tion/prediction questions have a small, reliable, and positive effect on subsequent behavior. The Q statistics revealed evi-dence of significant heterogeneity in effect sizes (Q = 379.55,
p < .001). The I2 value was 69.70%, which constitutes a mod-erate-to-high degree of heterogeneity according to Higgins et al.’s (2003) guidelines. The Q and I2 results thus indicate that moderator analysis is justified.
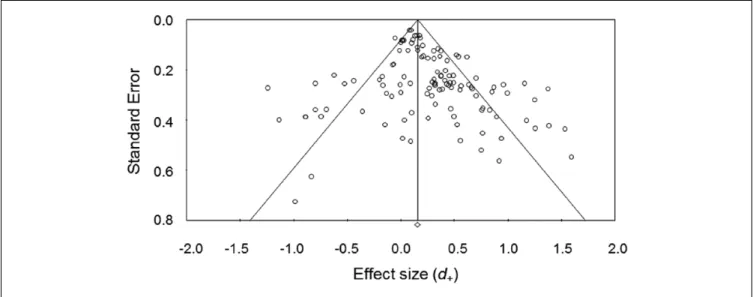
Funnel plots revealed that effect sizes were not symmetri-cally distributed, such that there was a disproportionate concentration of studies with larger effect sizes and larger
standard errors (see Figure 2). Egger’s regression test (Egger et al., 1997) revealed significant asymmetry (p < .01). Using a random-effects model, Duval and Tweedie’s (2000) Trim and Fill method revealed evidence of publication bias, with inclusion of 18 missing studies resulting in a lower estimated effect size than the original analysis (d+ = 0.15, 95% CI = [0.08, 0.21]). However, interpretation of the adjusted effect size is similar to the unadjusted effect size, in that the effect is positive, small in magnitude, and significantly different from zero. Thus, the influence of publication bias in the cur-rent meta-analysis can be designated as modest rather than severe (Rothstein, Sutton, & Borenstein, 2005).
Univariate Moderator Analyses
Subgroup analyses and univariate meta-regressions were con-ducted to examine whether the moderator variables had a sig-nificant effect on the magnitude of the QBE. Tables 1 and 2 report effect sizes and other relevant statistics for the subgroup analyses and univariate meta-regressions, respectively.
Mechanisms underlying the QBE. There was a significant asso-ciation between our index of attitude accessibility and the magnitude of the QBE; in particular, the interaction between attitude valence and response rates proved reli-able (β = .05, 95% CI = [0.001, 0.10], p = .047). Attitude valence on its own was not reliable (β = .002, 95% CI = [−0.05, 0.06], p = .95). This former finding supports an attitude accessibility explanation for the QBE, although adjusted R2 indicated that this moderator explained little heterogeneity (<0.1%).
Meta-regression analysis showed no effect of cognitive dis-sonance (rated degree of discomfort following a prediction/ behavior mismatch) on the magnitude of the QBE (β = −.05, 95% CI = [−0.12, 0.01], p = .12).
There was a significant negative effect of rated ease of representation on the QBE (β = −.11, 95% CI = [−0.20, −0.02], p = .02). However, this finding was not consistent with a behavioral simulation explanation as greater rated ease of representation was associated with smaller effect sizes. Calculation of adjusted R2 indicated that 2.23% of the
heterogeneity was accounted for by this moderator. Meta-regression analysis revealed no significant association between QBE and correspondence between the question and behavior measures in either the full set of studies (β = −.03, 95% CI = [−0.11, 0.05], p = .43) or the subset of studies using objective measures of behavior (β = −.05, 95%
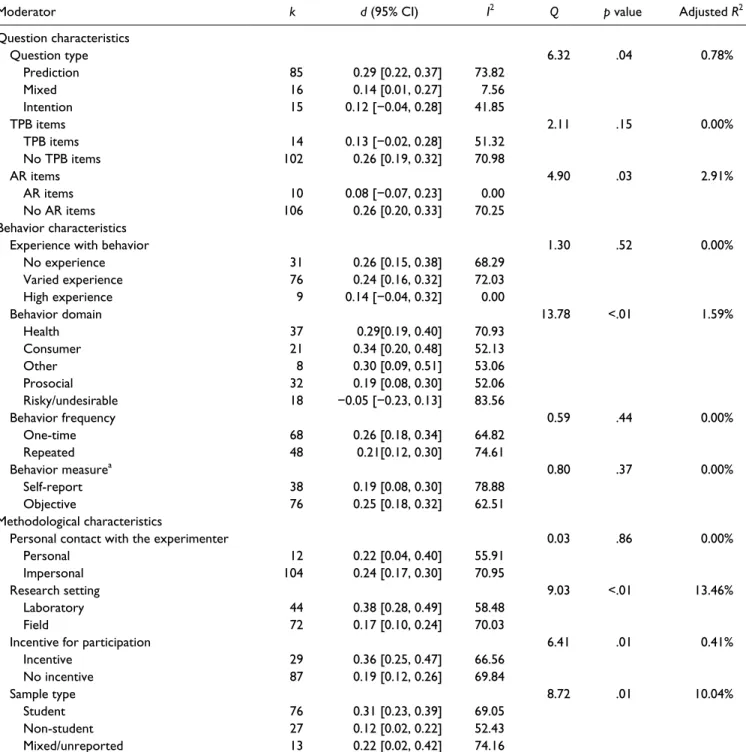
Table 1. Summary of Subgroup Moderator Analyses.
Moderator k d (95% CI) I2 Q p value Adjusted R2
Question characteristics
Question type 6.32 .04 0.78%
Prediction 85 0.29 [0.22, 0.37] 73.82
Mixed 16 0.14 [0.01, 0.27] 7.56
Intention 15 0.12 [−0.04, 0.28] 41.85
TPB items 2.11 .15 0.00%
TPB items 14 0.13 [−0.02, 0.28] 51.32
No TPB items 102 0.26 [0.19, 0.32] 70.98
AR items 4.90 .03 2.91%
AR items 10 0.08 [−0.07, 0.23] 0.00
No AR items 106 0.26 [0.20, 0.33] 70.25
Behavior characteristics
Experience with behavior 1.30 .52 0.00%
No experience 31 0.26 [0.15, 0.38] 68.29
Varied experience 76 0.24 [0.16, 0.32] 72.03
High experience 9 0.14 [−0.04, 0.32] 0.00
Behavior domain 13.78 <.01 1.59%
Health 37 0.29[0.19, 0.40] 70.93
Consumer 21 0.34 [0.20, 0.48] 52.13
Other 8 0.30 [0.09, 0.51] 53.06
Prosocial 32 0.19 [0.08, 0.30] 52.06
Risky/undesirable 18 −0.05 [−0.23, 0.13] 83.56
Behavior frequency 0.59 .44 0.00%
One-time 68 0.26 [0.18, 0.34] 64.82
Repeated 48 0.21[0.12, 0.30] 74.61
Behavior measurea 0.80 .37 0.00%
Self-report 38 0.19 [0.08, 0.30] 78.88
Objective 76 0.25 [0.18, 0.32] 62.51
Methodological characteristics
Personal contact with the experimenter 0.03 .86 0.00%
Personal 12 0.22 [0.04, 0.40] 55.91
Impersonal 104 0.24 [0.17, 0.30] 70.95
Research setting 9.03 <.01 13.46%
Laboratory 44 0.38 [0.28, 0.49] 58.48
Field 72 0.17 [0.10, 0.24] 70.03
Incentive for participation 6.41 .01 0.41%
Incentive 29 0.36 [0.25, 0.47] 66.56
No incentive 87 0.19 [0.12, 0.26] 69.84
Sample type 8.72 .01 10.04%
Student 76 0.31 [0.23, 0.39] 69.05
Non-student 27 0.12 [0.02, 0.22] 52.43
Mixed/unreported 13 0.22 [0.02, 0.42] 74.16
Note. k = number of observations; d = standardized mean difference effect size with Hedge’s adjustment; CI = confidence intervals; I2 = Higgins and
Thompson’s (2002) I2 statistic; Q = Cochran’s (1952) Q statistic; Adjusted R2 = percentage heterogeneity accounted for by the moderator. TPB = theory
of planned behavior; AR = anticipated regret.
CI = [−0.13, 0.03], p = .23). These findings do not support processing fluency or cognitive dissonance explanations for the QBE.
Question characteristics. Subgroup analysis comparing stud-ies using intention, prediction, or mixed questions revealed that question type had a significant effect on the QBE (Q = 6.32, p = .04). Although all three question types were charac-terized by small positive effect sizes, studies asking partici-pants to predict or report their expectations of future behavior had the largest effect on the QBE (d+ = 0.29, 95% CI = [0.22, 0.37]), followed by those using mixed items (d+ = 0.14, 95% CI = [0.01, 0.27]) and intention items only (d+ = 0.12, 95% CI = [−0.04, 0.28]). The effect size for intention questions was not significantly different from zero. Pairwise comparisons revealed a significant difference in effect size between studies using prediction versus mixed items (Q = 3.84, p = .05). No other comparisons were significantly different (ps > .10).
Subgroup analysis comparing studies measuring TPB constructs to those that did not measure TPB constructs revealed that this moderator had no significant effect on the size of the QBE (Q = 2.11, p = .15). Including questions relating to anticipated regret did have a significant effect on the QBE (Q = 4.90, p = .03). Studies that included antici-pated regret items had a smaller effect size (d+ = 0.08, 95% CI = [−0.07, 0.23]) than studies that did not (d+ = 0.26, 95% CI = [0.20, 0.33]). Adjusted R2 indicated that this moderator accounted for 2.91% of the heterogeneity.
Meta-regressions showed no significant effect of the number of questions relating to behavioral prediction or intention (β = −.03, 95% CI = [−0.09, 0.03], p = .36), or the total number of behavior-related questions (β = −.003, 95% CI = [−0.01, 0.001], p = .11) on the size of the QBE, although scatterplots indicated a restricted range of scores on this measure, such that single-item measures of intention/predic-tion were the norm.
Behavior characteristics. Subgroup analysis found no effect of experience with the behavior on the magnitude of the QBE (Q = 1.30, p = .52). However, the QBE differed by behav-ioral domain (Q = 13.78, p < .01). Studies targeting health behaviors (d+ = 0.29, 95% CI = [0.19, 0.40]), consumer behaviors (d+ = 0.34, 95% CI = [0.20, 0.48]), and miscella-neous other behaviors (d+ = 0.30, 95% CI = [0.09, 0.51]) had small-to-medium positive effect sizes that were significantly different from zero. Studies targeting prosocial behaviors also demonstrated a significant QBE (d+ = 0.19, 95% CI = [0.08, 0.30]). However, studies targeting risky or undesirable behaviors (d+ = −0.05, 95% CI = [−0.23, 0.13]) had a small negative effect size that was not significantly different from zero. Adjusted R2 indicated that this moderator accounted for 1.59% of the heterogeneity. Pairwise comparisons revealed that the effect size for studies targeting risky behaviors was significantly smaller than studies targeting health behaviors (Q = 8.83, p < .01), consumer behaviors (Q = 7.31, p < .01), and prosocial behaviors (Q = 4.91, p = .03). Consumer
Table 2. Summary of Univariate Meta-Regression Moderator Analyses.
Moderator k M (SD) I2 Regression coefficient (95% CI) p value Adjusted R2
Mechanisms underlying the QBE
Attitude accessibility 116 −0.43 (1.13) 69.59 0.05 [0.001, 0.10] .047 0.00%
Attitude valence 116 3.42 (1.13) 69.28 0.002 [−0.05, 0.06] .95 0.00%
Cognitive dissonance 116 2.39 (0.93) 69.15 −0.05 [−0.12, 0.01] .12 1.11%
Ease of representation 116 3.23 (0.61) 67.96 −0.11 [−0.20, −0.02] .02 2.23% Correspondence (all studies) 116 2.34 (0.78) 69.66 −0.03 [−0.11, 0.05] .43 0.00% Correspondence (objective behavior measure
studies only) 76 2.21 (0.81) 61.91 −0.05 [−0.13, 0.03] .23 0.00%
Question characteristics
Number of intention/prediction questions 116 1.32 (0.87) 68.73 −0.03 [−0.09, 0.03] .36 1.82% Number of behavior questions 116 6.34 (12.42) 69.20 −0.003 [−0.01, 0.001] .11 0.00% Behavior characteristics
Social desirability 116 3.63 (1.27) 69.90 0.07 [0.02, 0.11] .01 0.00%
Difficulty of behavior (linear) 116 2.35 (1.19) 68.54 −0.06 [−0.11, −0.02] .01 3.56% Methodological characteristics
Time interval (ln) 116 40.08 (78.08)a 67.57 −0.05 [−0.08, −0.03] <.001 7.33%
Response rate (field studies only) 72 0.86 (0.26) 70.42 0.09 [−0.15, 0.32] .48 0.00%
Publication year 116 2004 (6.75)b 69.94 0.004 [−0.01, 0.01] .34 0.00%
Note. k = number of observations; I2 = Higgins and Thompson’s (2002) I2 statistic; 95% CI = 95% confidence intervals; Adjusted R2 = percentage
heterogeneity accounted for by the moderator; QBE = question–behavior effect.
behaviors also had a significantly larger effect size than pro-social behaviors (Q = 5.13, p = .02). No other two groups were significantly different (ps > .1), although the difference in effect size between studies targeting prosocial versus mis-cellaneous other behaviors approached significance (Q = 3.20, p = .07).
Social desirability and difficulty of behavior also influ-enced the magnitude of the QBE. More socially desirable behaviors were associated with a larger effect size (β = .07, 95% CI = [0.02, 0.11], p = .01). More difficult behaviors were associated with a smaller effect size in linear analyses (β = −.06, 95% CI = [−0.11, −0.02], p = .01), and in a multi-variate model including both the linear and quadratic effects of behavior difficulty, there was also a significant quadratic association between behavioral difficulty and the QBE (β = .04, 95% CI = [0.001, 0.08], p = .047). Although 3.56% and 4.71% of the heterogeneity was accounted for by the behavioral difficulty moderator in linear and quadratic anal-yses, respectively, adjusted R2 indicated that the social desir-ability moderator explained little heterogeneity (<0.1%). There were no reliable effects of behavior frequency (one-time occurrence vs. repeated; Q = 0.35, p = .44), or behavior measure (self-report vs. objective; Q = 0.80, p = .37) on effect sizes.
Methodological characteristics. The distribution of scores for the time interval moderator was non-normal, with skewness of 2.56 (SE = 0.23) and kurtosis of 6.79 (SE = 0.45). To avoid violating assumptions of normality in meta-regression, a score of 1 was added to each time point and the resulting data were log transformed, which eliminated skewness (0.55,
SE = 0.23) and kurtosis (−1.02, SE = 0.45). Meta-regression analysis of the log transformed data demonstrated a signifi-cant negative effect of time interval on the magnitude of the QBE; longer time intervals between questioning and behav-ior measurement were associated with smaller effect sizes (β = −.05, 95% CI = [−0.08, −0.03], p < .001). Examination of the adjusted R2 indicated that this moderator explained 7.33% of the heterogeneity.
Subgroup analysis showed no effect of personal contact with the experimenter (Q = 0.03, p = .86). However, the research setting moderated the QBE (Q = 10.83, p < .01); studies that measured behavior in the laboratory had a small-to-medium effect size (d+ = 0.38, 95% CI = [0.28, 0.49]), whereas studies measuring behavior in the field had a small effect size (d+ = 0.17, 95% CI = [0.10, 0.24]); 13.46% of the heterogeneity was accounted for by this moderator.
The response rate in field studies did not influence the QBE (β = .09, 95% CI = [−0.15, 0.32], p = .48) but the use of incentives (in all studies) did (Q = 6.41, p = .01). Studies that provided an incentive showed a small-to-medium effect size (d+ = 0.36, 95% CI = [0.25, 0.47]) where studies not provid-ing an incentive showed a small effect size (d+ = 0.19, 95% CI = [0.12, 0.26]). However, adjusted R2 indicated that this moderator explained little heterogeneity (<0.1%).
Subgroup analyses revealed a significant effect of sample type on the QBE (Q = 8.72, p = .01), such that the QBE was the largest in studies using student samples (d+ = 0.31, 95% CI = [0.23, 0.39]), followed by mixed or unreported samples (d+ = 0.22, 95% CI = [0.02, 0.42]), followed by non-student samples (d+ = 0.12, 95% CI = [0.02, 0.22]). Pairwise com-parisons revealed that the effect size for studies of student samples was significantly larger than studies targeting non-student samples (Q = 9.43, p < .01). No other two groups were significantly different (ps > .1). Examination of the adjusted R2 indicated that 10.04% of the heterogeneity was accounted for by this moderator.
Finally, there was no significant association between year of publication and magnitude of the QBE (β = .004, 95% CI = [−0.005, 0.01], p = .34).
Relationships Between Moderators
Before undertaking multivariate analyses of the associations between effect sizes and moderator variables, we tested for collinearity among the moderators. Pearson’s correlations, point–biserial correlations, and phi-coefficients were calcu-lated between each pair of continuous, continuous–categori-cal, and categorical–categorical moderators, respectively (see Table 3). The four dichotomous categorical moderators were coded as follows: TPB items (TPB = 1, no TPB = 0), anticipated regret items (anticipated regret [AR] = 1, no AR = 0), research setting (laboratory = 1, field = 0), and incen-tive for participation (incenincen-tive = 1, no incenincen-tive = 0). The three categorical moderators that had more than two levels (question type, behavior domain, and sample type) were dummy coded into dichotomous variables as follows: ques-tion type (predicques-tion = 1, other = 0), behavior domain (risky/ undesirable behaviors = 1, other = 0), and sample type (stu-dent sample = 1, other = 0).
259
Table 3.
Correlations Between All Moderators.
Moderator 1 2 3 4 5 6 7 8 9 10 11 12 13 14 15 16 17 18 19 20 21
1. Attitude accessibility
—
2. Attitude valence
−.11
—
3. Cognitive dissonance
−.20*
.31***
—
4. Ease of representation
−.16 −.01 .01 — 5. Correspondence −.10 .09 .13 .10 —
6. Q type
.46*** −.31*** −.24** −.28** −.06 —
7. TPB items
−.35*** .41*** .39*** .11 −.07 −.49*** —
8. Anticipated regret items
−.43*** .32*** .28** .24* −.06 −.51*** .72*** — 9.
Number of intention/ prediction Qs
a −.26** .15 .28** .15 −.14 −.29** .42*** .52*** — 10.
Number of behavior- related Qs
b −.01 .24** .22* .19* .05 −.48*** .56*** .54*** .40*** —
11. Experience with behavior
.14 .14 .18 .04 .09 .13 −.10 −.19* −.10 −.08 —
12. Behavior domain
−.05 −.57*** .02 .19* .12 .26** −.18* −.13 −.16 −.19* .24* —
13. Social desirability
.003 .66*** .36*** −.27** .10 −.24** .24** .16 .09 .25** −.05 −.72*** —
14. Difficulty of behavior
−.52*** .40*** .54*** .05 .12 −.48*** .54*** .48*** .33*** .26** .11 −.05 .25** —
15. Behavior frequency
−.15 .16 .05 .28** .28** −.17 −.02 .18 .01 .03 .17 .12 −.13 .09 —
16. Behavior measure
.10 −.02 .06 .13 .26** −.08 −.15 −.15 −.21* −.05 .21* .31*** −.16 .09 .53*** —
17. Time interval
−.46*** .31*** .32*** .30** .23* −.60*** .39*** .43*** .28** .32*** .11 −.005 .06 .59*** .47*** .30** — 18.
Personal contact with the experimenter
.14 −.004 .02 .06 .14 .08 −.15 −.10 −.06 −.11 .05 −.15 .21* .04 −.06 −.24* .14 —
19. Research setting
.24* −.22* −.42*** −.21* −.42*** .39*** −.14 −.24** −.29** −.17 −.12 .01 −.12 −.43*** −.51*** −.43*** −.72*** −.27** —
20. Response rate
.84*** −.43*** −.31*** −.12 −.21* .63*** −.41*** −.43*** −.26** −.10 −.004 .18 −.26** −.59*** −.14 .08 −.51*** .14 .33*** —
21. Incentive for participation
−.03 −.12 .15 −.06 −.03 .12 −.08 −.04 −.05 −.01 −.01 .03 −.004 −.12 −.12 −.23* −.30** −.20* .29** .08 —
22. Sample type
.18 −.11 −.08 −.08 .07 .30** −.39*** −.42*** −.30** −.36*** .24** .11 −.08 −.30*** .20* .27** −.39*** −.29** .12 .14 .04
23. Publication year
−.26** .002 .02 .11 −.02 −.18* .12 .29** .21* .07 −.08 .06 −.08 −.02 .27** .09 −.03 −.46*** .08 −.24* .04 Note. N
= 116 for all analyses. TPB = theory of planned behavior; Q = question.
aNumber of intention/prediction questions. bNumber of behavior-related questions. *p
< .05. **
p < .01. ***
of the behavior that were highly correlated (r = −.72,
p < .001). Risky behaviors tended to also be low in social desirability (M social desirability = 1.50, SD = 0.86), whereas non-risky behaviors tended to be high in social desirability (M social desirability = 4.00, SD = 0.88); thus, higher scores on this factor indicate behaviors that are less risky and higher in social desirability. Finally, studies that included questions on TPB constructs were highly likely to also include ques-tions assessing anticipated regret (r = .72, p < .001). To com-bine these moderators, we computed a comcom-bined score ranging from zero to two, to indicate whether studies had assessed neither of these constructs, one of these constructs, or both of these constructs.
Multivariate Meta-Regression
We constructed an overall multivariate model by including all of the predictors that were significantly associated with the QBE in univariate analyses (i.e., attitude accessibility, ease of representation, question type, a combined score for the presence of TPB and anticipated regret questions, the fac-tor score for behavior domain and social desirability, the lin-ear and quadratic effects of difficulty of behavior, the factor score for time interval and research setting, incentive for par-ticipation, and sample type). In this model, the factor score for behavior domain and social desirability (β = .17, 95% CI = [0.08, 0.26], p < .001), the quadratic effect of difficulty of behavior (β = .05, 95% CI = [0.002, 0.10], p = .04, see
Figure 3), and sample type (β = .15, 95% CI = [0.004, 0.30],
p = .04), each predicted unique variance in the QBE; none of the other moderators predicted unique variance (ps > .12; see Table 4).
Discussion
The current meta-analysis aimed to provide a comprehensive quantitative review of the impact of asking self-prediction and intention questions on a broad range of behaviors, and shed light on the proposed mediators and moderators of this QBE. A random-effects model indicated that prediction/ intention questions have a small positive effect on subse-quent behavior. This effect size is consistent with Spangenberg and Greenwald’s (1999) previous meta-analysis on the QBE. In addition, the effect size was characterized by significant heterogeneity, suggesting the presence of moderating vari-ables, which we examined using subgroup analyses and meta-regressions. Univariate analyses concerning theoretical mechanisms underlying the QBE revealed significant mod-erating effects of attitude accessibility and ease of representa-tion, but no significant effects for rated cognitive dissonance or measurement correspondence (in either the full set of stud-ies or subset of studstud-ies using objective measure of behavior). Univariate moderator analysis concerning characteristics of the question, behavior, and methodology revealed that the QBE was stronger when prediction rather than intention ques-tions were asked, when anticipated regret quesques-tions were not
Figure 3. Weighted effect size (d+) at each level of behavior difficulty.
![Figure 3), and sample type (β = .15, 95% CI = [0.004, 0.30], p = .04), each predicted unique variance in the QBE; none of the other moderators predicted unique variance (ps > .12; see Table 4).](https://thumb-us.123doks.com/thumbv2/123dok_us/8274976.2191520/16.918.73.833.105.536/figure-predicted-variance-moderators-predicted-unique-variance-table.webp)
